vizGPT
Visit Website
vizGPT Overview
vizGPT is a revolutionary AI platform designed for modern data science and analytics, enabling users to turn complex datasets into clear, actionable visualizations in minutes. It fundamentally changes how we interact with data by replacing complex coding and software with a simple, conversational interface. By just asking questions in plain English, users can generate sophisticated charts and graphs, making data analysis as easy as talking to a colleague. This approach democratizes data insights, empowering business leaders, analysts, researchers, and students to uncover the stories hidden in their data without a steep learning curve.
The platform is built on advanced Natural Language Processing (NLP) that accurately understands the context of your data analysis queries. Whether you're a business professional needing a quick sales report or a researcher exploring complex correlations, vizGPT provides instant, real-time responses. It's not just a tool; it's an analytical partner that remembers your conversation, allowing for a seamless and iterative exploration of your data.
How to use vizGPT
Getting started with vizGPT is incredibly simple and takes less than a minute. The workflow is designed to be intuitive for users of all skill levels:
- Upload Your Data: Begin by visiting the vizGPT website. You can upload your data files directly, with support for common formats like CSV and Excel. Alternatively, you can connect to your databases for a more integrated analysis.
- Start Asking Questions: Once your data is loaded, you can start the conversation. Use the chat interface to ask questions in plain English. For example, you can type "Show me sales trends for the last quarter by region" or "What is the correlation between marketing spend and revenue?"
- Generate and Refine Visualizations: vizGPT will instantly process your request and generate the most appropriate visualization, such as a bar chart, line graph, or scatter plot. You can continue the conversation to refine the chart, like asking, "Now, can you show this as a pie chart?" or "Filter this for the European market only."
- Use the No-Code Editor: For users who prefer a more hands-on approach, vizGPT also offers a powerful drag-and-drop interface. You can manually select chart types, drag data fields to axes, and customize the appearance of your visualizations without writing a single line of code.
Core Features of vizGPT
- Conversational Data Analysis: Utilizes advanced NLP to understand and process queries in plain English, eliminating the need for coding.
- Real-Time Responses: Generates visualizations and insights instantly, allowing for a fluid and uninterrupted analytical workflow.
- Contextual Memory: The AI remembers the context of your conversation, enabling you to build upon previous queries for deeper, more cohesive analysis.
- No-Code GUI and Drag-and-Drop: Offers a user-friendly graphical interface for creating and customizing visualizations manually.
- Intelligent Data Tables: Provides easy-to-use data tables that allow you to transform, profile, and clean your data directly within the platform.
- AI Code Agent for Jupyter Notebooks: A newly introduced feature that integrates vizGPT's capabilities directly into the popular Jupyter environment for data scientists.
- Broad Data Source Compatibility: Supports uploads of CSV and Excel files, as well as direct connections to various databases.
Use Cases for vizGPT
vizGPT is a versatile tool perfect for a wide range of users and scenarios:
- Business Leaders: Quickly visualize key performance indicators (KPIs), track sales performance, and make faster, data-driven decisions without relying on an analytics team.
- Data Analysts: Accelerate their workflow by rapidly performing exploratory data analysis, generating charts for reports, and validating hypotheses conversationally.
- Researchers: Focus on discovering insights and patterns in their data rather than spending time learning and debugging complex visualization libraries in R or Python.
- Students: Easily create professional-grade visualizations for academic projects and assignments, helping them to better understand and present data.
- Marketing Teams: Analyze campaign effectiveness, visualize customer segmentation, and monitor website analytics to optimize marketing strategies.
Advantages of vizGPT
vizGPT offers a significant edge over traditional data visualization tools:
- Zero Learning Curve: If you can ask a question, you can create a professional visualization. It's accessible to both technical and non-technical users.
- Unmatched Speed: Transforms complex queries into charts in seconds, dramatically reducing the time it takes to get from data to insight.
- Iterative Exploration: The conversational nature allows for a natural, back-and-forth process of refining analysis, leading to deeper understanding.
- Democratization of Data: Empowers everyone in an organization to engage with data and tell compelling visual stories, fostering a data-driven culture.
Pricing and Plans
vizGPT offers flexible plans to suit different needs:
- Free Plan: A 'Free forever' plan is available, allowing users to experience the core features without any cost.
- Professional Plan: Priced at $10 USD per month (billed monthly), this plan is for advanced users. It includes visualization with GPT-4, priority AI processing, an unlimited number of data sources, and premium support. A 7-day free trial is available.
- Enterprise Plan: Offers custom pricing for organizations. This plan includes custom visualization development, dedicated support, on-premises deployment options, advanced security compliance, API integration, and comprehensive training & onboarding.
vizGPT Comments (0)
Log in to post comments
Log in nowvizGPTWebsite Traffic Analysis
Latest Traffic
Status
Monthly Traffic Trend
Geography
Top 5 Countries/Regions
-
🇺🇸 United States35.03%
-
🇮🇳 India23.55%
-
🇧🇷 Brazil16.96%
-
🇻🇳 Vietnam13.98%
-
🇨🇦 Canada10.48%
Popular Keywords
| Keyword | Cost Per Click |
|---|---|
|
$0.00
|
|
|
$3.20
|
|
|
$0.00
|
|
|
$2.92
|
|
|
$0.00
|
vizGPT Alternatives
View All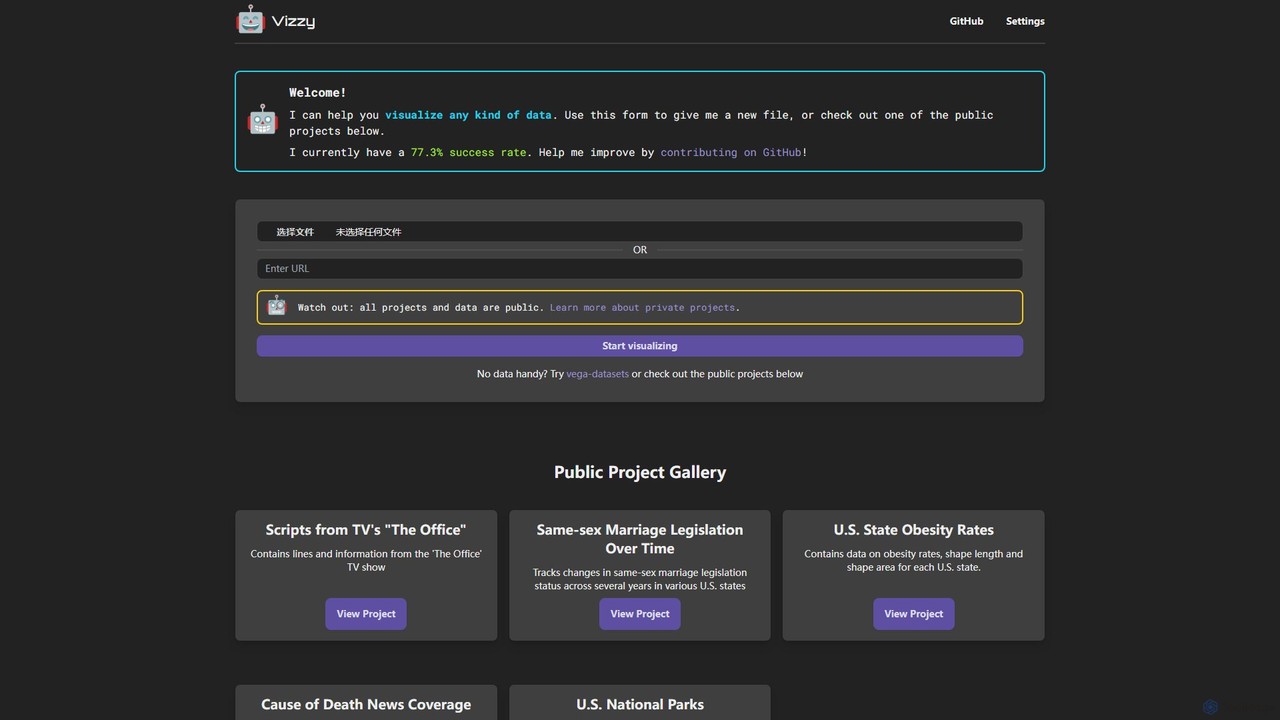
Vizzy
Vizzy is an AI-powered tool that leverages Large Language Models (LLMs) for rapid data visualization. Simply upload your …
Vizzy is an AI-powered tool that leverages Large Language Models (LLMs) for rapid data visualization. Simply upload your data file, and Vizzy's AI will analyze it to automatically generate insightful charts, graphs, and maps. It's a no-code, open-source platform designed to make data analysis accessible to everyone, from researchers to business analysts. Explore public datasets or visualize your own, turning raw numbers into clear visuals in seconds.
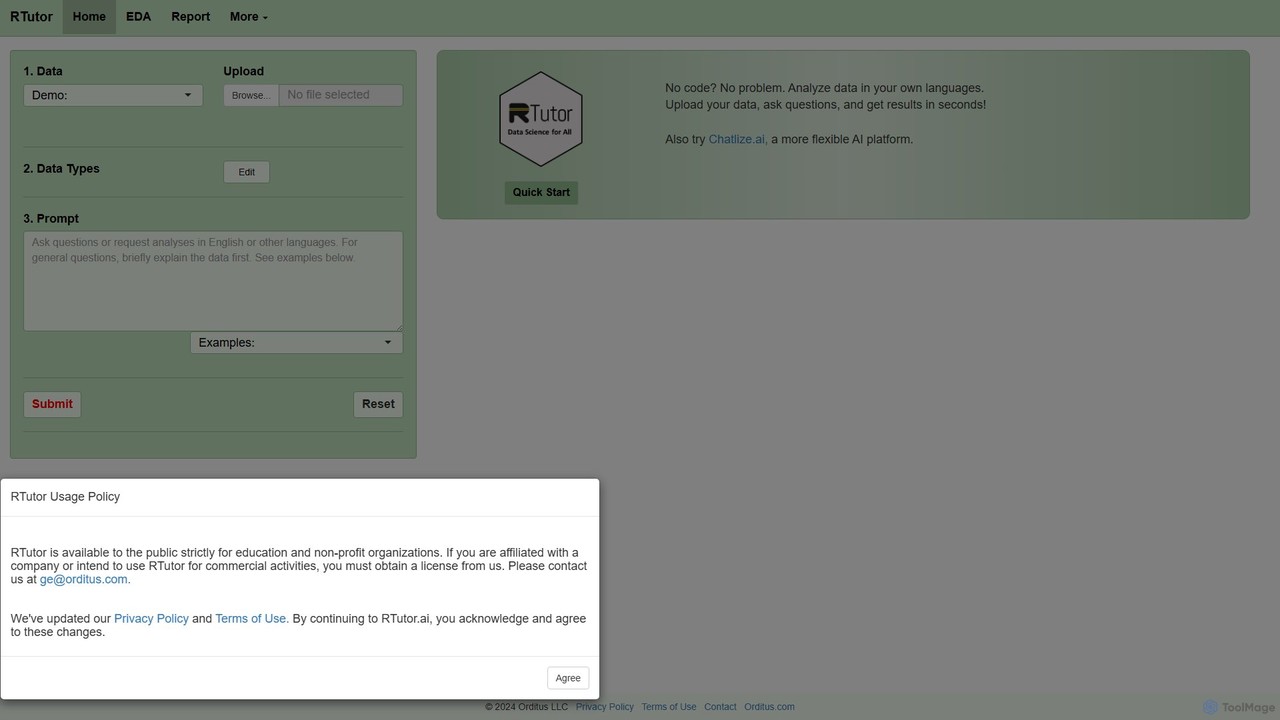
rtutor
rtutor is an AI-powered data analysis platform that enables users to analyze data using natural language. Upload your …
rtutor is an AI-powered data analysis platform that enables users to analyze data using natural language. Upload your dataset, ask questions in plain English, and rtutor generates insights, visualizations, and statistical analyses without requiring any coding knowledge, leveraging the power of the R language.
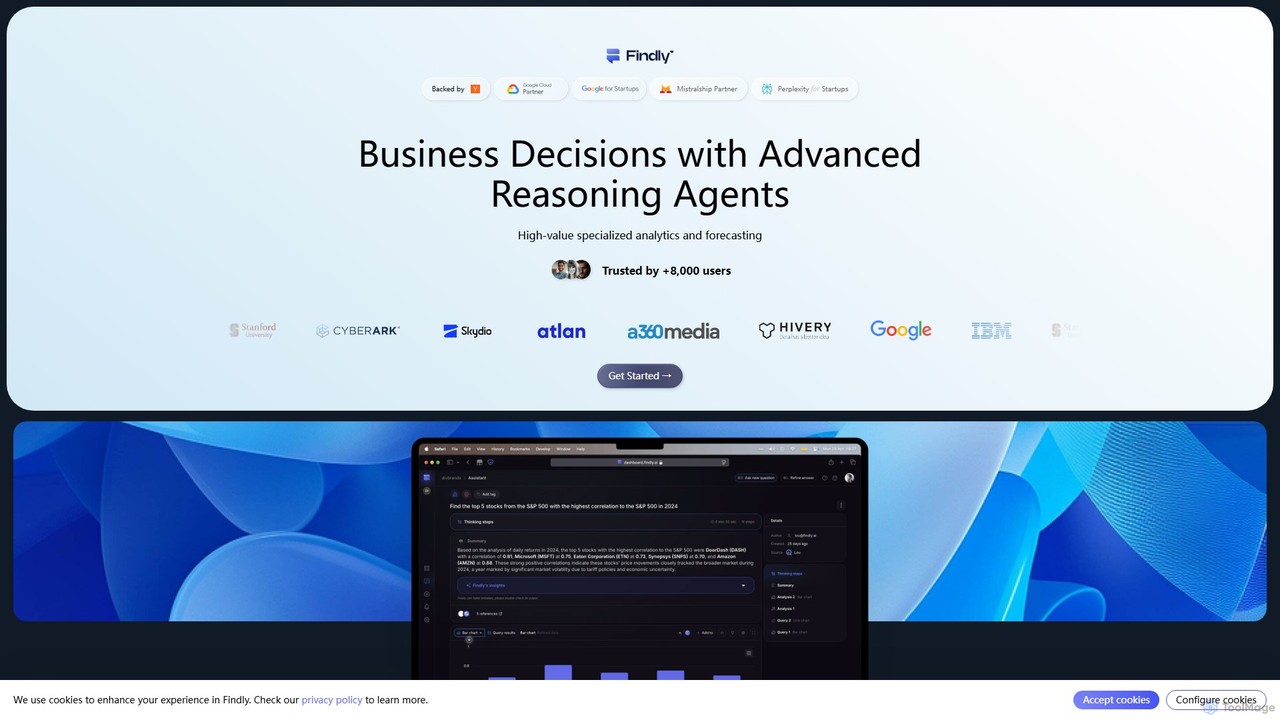
Findly
Findly is an AI-powered business intelligence (BI) platform that allows users to analyze data and get insights using …
Findly is an AI-powered business intelligence (BI) platform that allows users to analyze data and get insights using natural language. It connects to various data sources, translates plain English questions into complex SQL queries, and provides interactive visualizations and reports. Designed for both technical and non-technical users, Findly simplifies data analysis, making it faster and more accessible for entire teams.
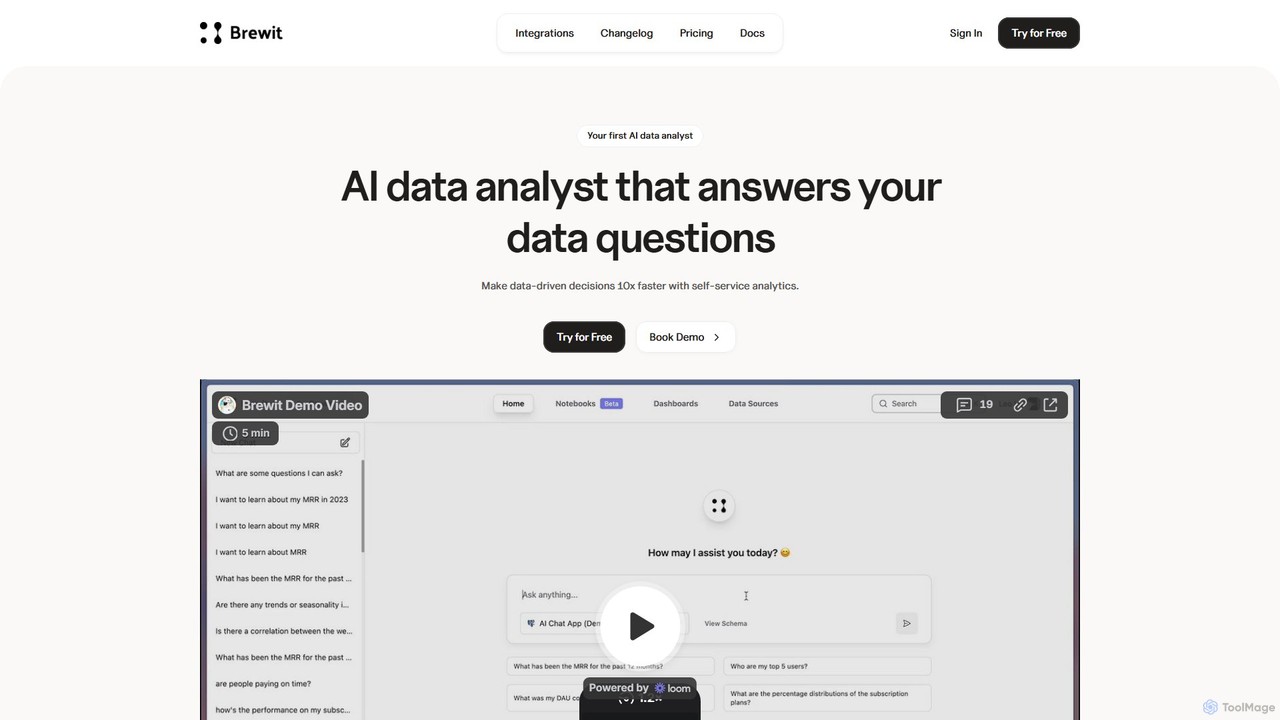
Brewit
Brewit is an AI-powered analytics platform that enables users to perform self-service data analysis. Connect to your databases, …
Brewit is an AI-powered analytics platform that enables users to perform self-service data analysis. Connect to your databases, chat in natural language to query data, generate SQL, and create interactive visualizations and reports. It simplifies business intelligence, making data accessible to everyone in the organization, regardless of their technical skills.
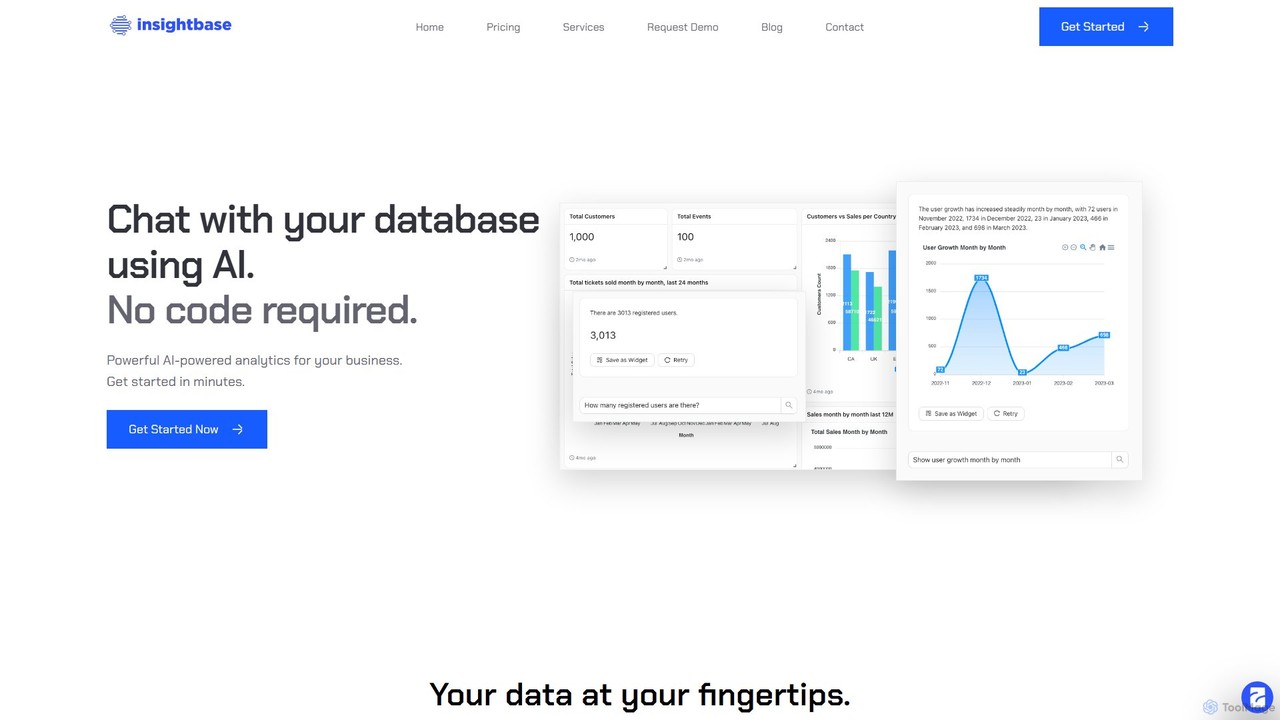
InsightBase
InsightBase is an AI-powered business intelligence platform that allows you to chat with your database using natural language. …
InsightBase is an AI-powered business intelligence platform that allows you to chat with your database using natural language. It empowers both non-technical and technical users to build dashboards, generate reports, and gain data-driven insights in minutes, without needing to write complex SQL queries.
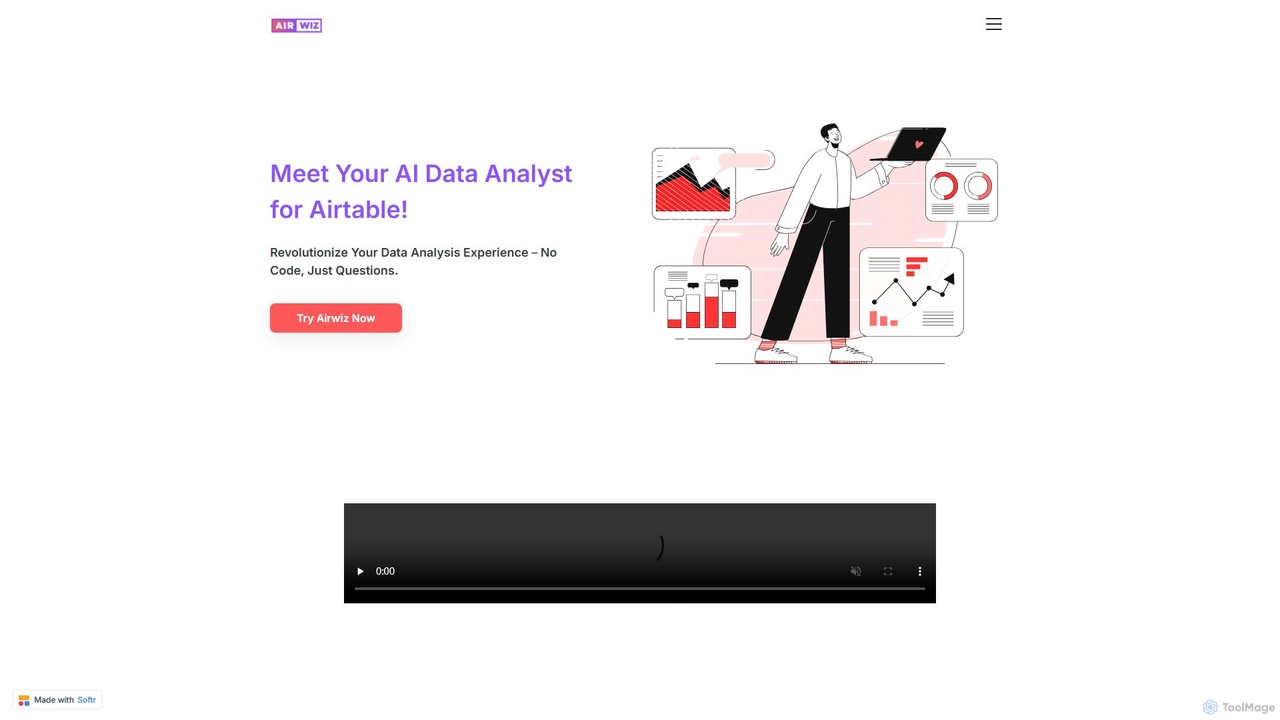
airwiz
Airwiz is an AI-powered data analyst designed specifically for Airtable. It allows users to ask complex questions about …
Airwiz is an AI-powered data analyst designed specifically for Airtable. It allows users to ask complex questions about their data in plain English and receive instant, actionable insights. With seamless integration and no coding required, Airwiz democratizes data analysis, enabling teams in product, finance, and operations to make faster, data-driven decisions directly from their Airtable bases.
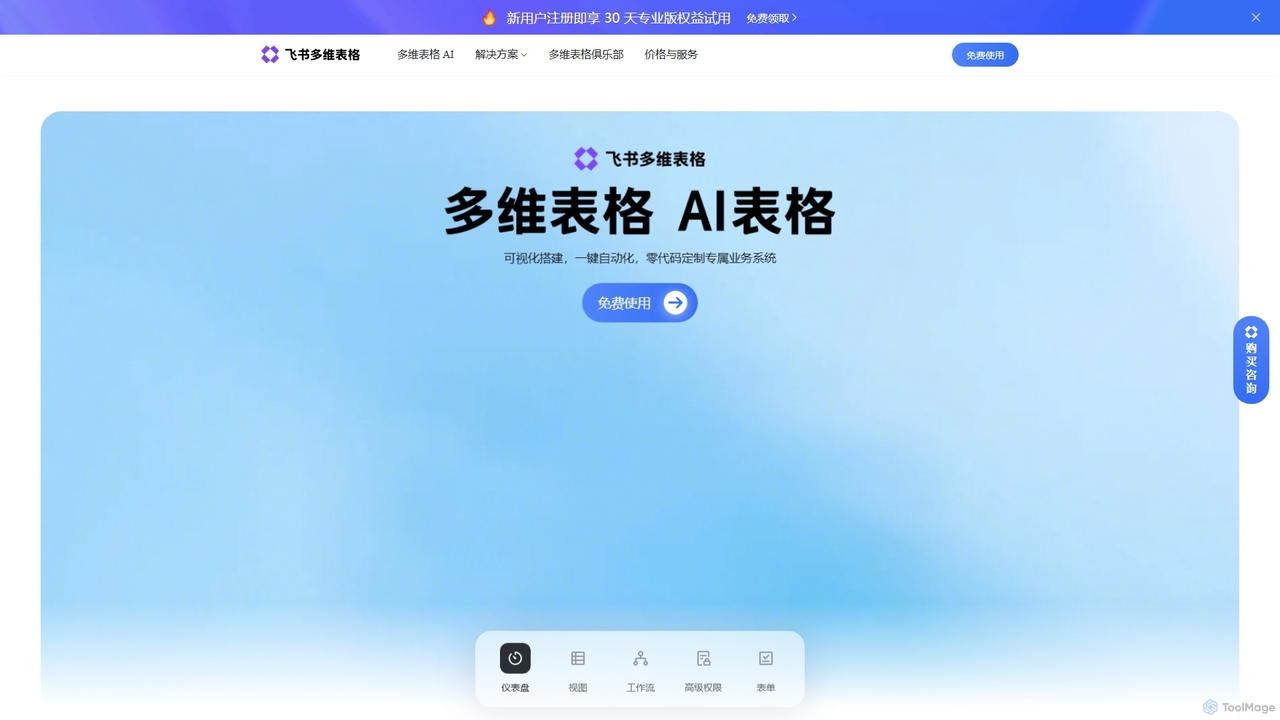
Feishu Base
Feishu Base is an AI-powered no-code platform that combines the flexibility of a spreadsheet with the power of …
Feishu Base is an AI-powered no-code platform that combines the flexibility of a spreadsheet with the power of a database. It enables teams to build custom business systems, automate workflows, and analyze data through intuitive dashboards without writing any code. It's designed for seamless collaboration and data management.
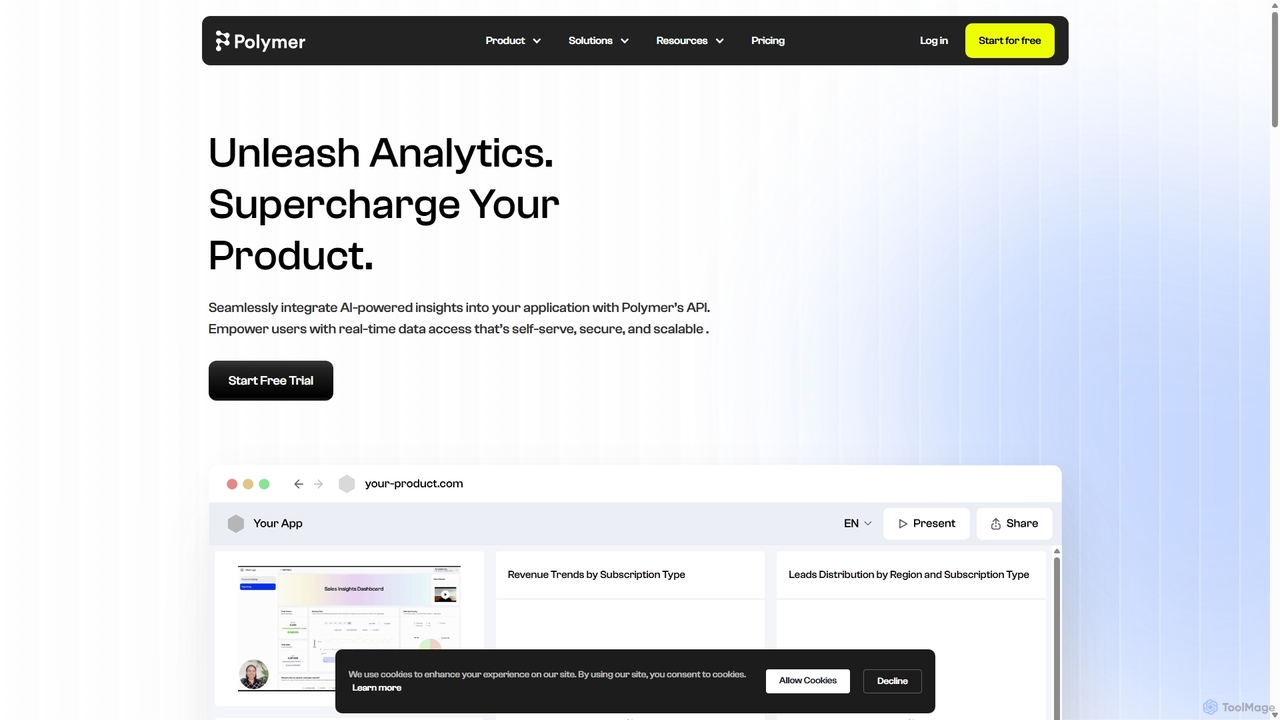
Polymer Search
Polymer Search is an AI-driven embedded analytics platform designed to supercharge products with powerful, white-labeled data visualizations. It …
Polymer Search is an AI-driven embedded analytics platform designed to supercharge products with powerful, white-labeled data visualizations. It enables seamless integration of beautiful dashboards and reports directly into your application, empowering users with self-serve analytics and AI-generated insights, all with minimal development effort.
Analyzr
Analyzr is a no-code predictive analytics platform that empowers businesses to build custom machine learning models. It simplifies …
Analyzr is a no-code predictive analytics platform that empowers businesses to build custom machine learning models. It simplifies data analysis, enabling users to uncover insights for customer clustering, propensity scoring, and forecasting without requiring engineering expertise.
ChartGPT
ChartGPT is an AI-powered tool that transforms natural language prompts and raw data into stunning, customizable charts and …
ChartGPT is an AI-powered tool that transforms natural language prompts and raw data into stunning, customizable charts and graphs. Effortlessly create complex visualizations like bar charts, line graphs, and pie charts without any coding, simply by describing what you want to see.
vizGPT Category
vizGPT Tag
vizGPT AI Tool Comparison
vizGPT Embed Feature
Just copy the embed code below and paste this beautiful badge on your blog, article, or official app website to drive traffic directly to this tool's detail page and quickly boost your exposure and user count!

No comments yet, be the first to comment!