ChartAI
Visit Website
ChartAI Overview
ChartAI is a revolutionary data visualization platform that leverages the power of artificial intelligence to simplify and accelerate the process of creating charts and graphs. By integrating a conversational, chat-based interface, it allows users of all skill levels to transform complex data into clear, insightful visualizations using simple natural language commands. This eliminates the steep learning curve associated with traditional data visualization software and empowers users to focus on deriving insights rather than grappling with complex tools.
The platform is designed for flexibility and power. Users can begin by either importing their own datasets from common formats like CSV or Excel, or by utilizing the unique 'Generate Synthetic Dataset' feature. This latter capability is particularly useful for testing visualization ideas, creating demonstrations, or for educational purposes without needing real, sensitive data. The core of ChartAI's experience lies in its interactive chat, where data analysis becomes a conversation.
How to use ChartAI
Using ChartAI is an intuitive, three-step process:
- Connect Your Data: Start by uploading your data file (e.g., CSV, XLSX) directly to the platform. Alternatively, if you don't have a dataset or want to experiment, use the 'Generate Synthetic Dataset' option to create realistic, structured data in seconds.
- Set Up Your API Key: ChartAI operates on a 'Bring Your Own Key' (BYOK) model. Navigate to the settings panel and enter your OpenAI API key. This connects the tool's powerful interface to the underlying language model, ensuring your data processing is secure and private.
- Chat to Visualize: Open a new chat and start making requests in plain English. For example, you can type prompts like "Show me the total sales per region as a bar chart," "Create a line graph of user growth over the last 12 months," or "What is the correlation between ad spend and revenue? Show it as a scatter plot." The AI will interpret your request, process the connected data, and generate the appropriate visualization instantly. You can then continue the conversation to refine the chart, such as asking to "Change the color scheme to blue" or "Add data labels to the bars."
Core Features of ChartAI
- Natural Language to Chart Generation: The primary feature that allows users to create charts by simply describing what they want to see.
- Conversational Data Analysis: Engage in a dialogue with your data. Ask follow-up questions, request different views, and drill down into specifics without leaving the chat interface.
- Multiple Data Sources: Supports importing data from popular file formats and includes a powerful synthetic data generator.
- Wide Range of Chart Types: Capable of generating various charts, including bar charts, line graphs, pie charts, scatter plots, histograms, and more.
- Interactive Refinement: Easily modify and customize your charts with subsequent commands, adjusting colors, labels, titles, and chart types on the fly.
- BYOK Model: The 'Bring Your Own Key' model ensures user privacy and provides transparent control over processing costs via their personal OpenAI API usage.
Use Cases for ChartAI
ChartAI is a versatile tool suitable for a wide range of professionals and use cases:
- Business Analysts: Quickly generate visualizations for weekly reports, performance dashboards, and stakeholder presentations from sales or operational data.
- Data Scientists: Accelerate exploratory data analysis (EDA) by rapidly visualizing datasets to identify trends, outliers, and patterns before diving into complex modeling.
- Marketers: Analyze campaign performance, visualize customer segmentation, and create compelling charts for marketing reports and content.
- Students and Academics: Effortlessly create charts for research papers, theses, and presentations without needing to learn complex software like R or Python libraries.
- Product Managers: Analyze user engagement metrics, track feature adoption, and present data-driven insights to development teams.
Advantages of ChartAI
The primary advantage of ChartAI is its unparalleled speed and accessibility. It democratizes data visualization, making it available to non-technical users who would otherwise find the process daunting. The conversational approach is not only intuitive but also highly efficient, allowing for rapid iteration and exploration of data. The synthetic data generation feature is a significant differentiator, providing a safe and convenient way to work with data structures. Finally, the BYOK model offers a transparent and often more cost-effective solution for users compared to fixed subscription plans.
Pricing and Plans
ChartAI operates on a 'Bring Your Own Key' (BYOK) model. The platform itself is free to use, but it requires users to connect their own OpenAI API key. This means that the cost is directly tied to your usage of the OpenAI API for generating the charts and analysis. This model provides users with full control and transparency over their expenses, as they are only billed by OpenAI for the processing they actually use. There are no subscription fees for the ChartAI platform itself.
ChartAI Comments (0)
Log in to post comments
Log in nowChartAIWebsite Traffic Analysis
Latest Traffic
Status
Monthly Traffic Trend
Geography
Top 5 Countries/Regions
-
🇺🇸 United States40.38%
-
🇮🇳 India20.84%
-
🇰🇪 Kenya16.84%
-
🇻🇳 Vietnam13.68%
-
🇲🇾 Malaysia8.26%
Popular Keywords
| Keyword | Cost Per Click |
|---|---|
|
$2.60
|
|
|
$4.19
|
|
|
$3.43
|
|
|
$0.00
|
|
|
$0.00
|
ChartAI Alternatives
View All
chat2csv
chat2csv is an AI-powered data visualization tool that transforms CSV files into various charts using simple, natural language …
chat2csv is an AI-powered data visualization tool that transforms CSV files into various charts using simple, natural language commands. No coding is required. Just upload your data, chat with the AI, and instantly generate bar charts, pie charts, line graphs, and more. It's designed for quick, intuitive analysis while prioritizing user data privacy.
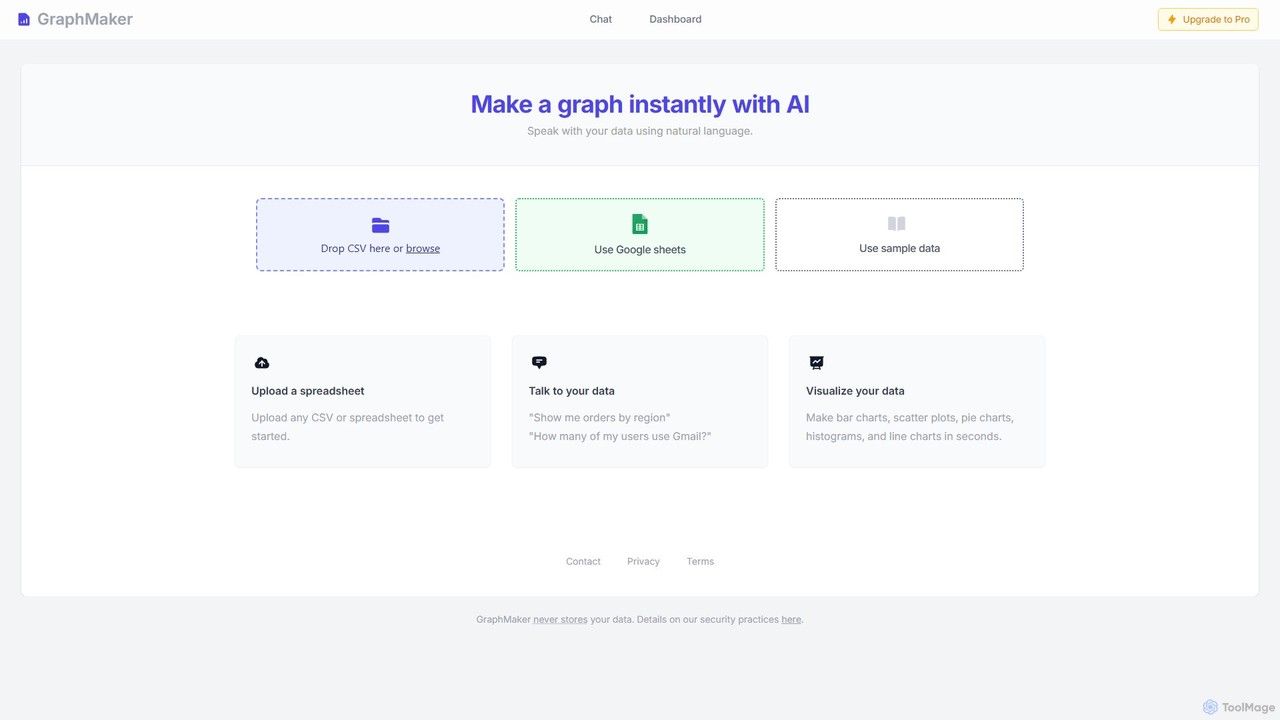
GraphMaker
GraphMaker is an AI-powered data visualization tool that allows you to create various charts and graphs in seconds. …
GraphMaker is an AI-powered data visualization tool that allows you to create various charts and graphs in seconds. Simply upload your data from a CSV file or Google Sheets, and use natural language commands to generate insightful visualizations like bar charts, pie charts, and histograms. It's designed for speed, simplicity, and security, as it never stores your data.
workviz.io
workviz.io is an AI-powered workforce analytics and project visualization platform. It transforms complex work data into clear, interactive …
workviz.io is an AI-powered workforce analytics and project visualization platform. It transforms complex work data into clear, interactive dashboards, helping teams optimize workflows, monitor project progress, and enhance productivity through intelligent insights and predictive analytics.
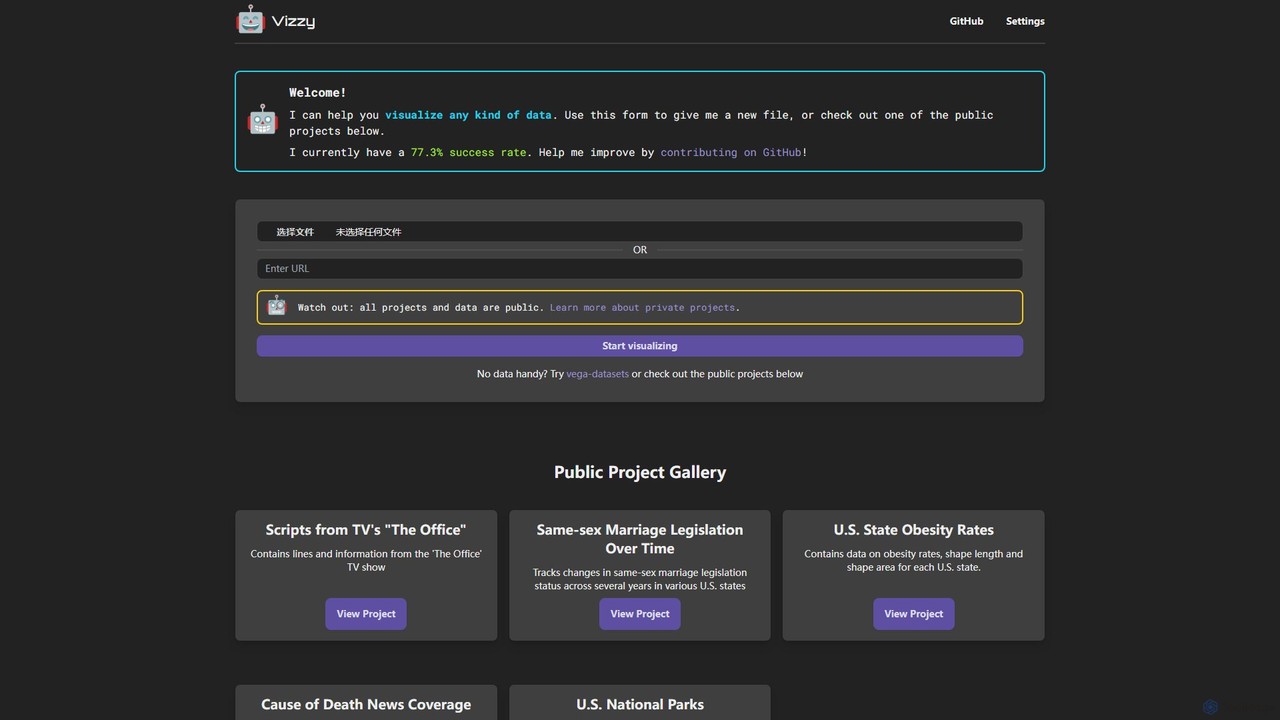
Vizzy
Vizzy is an AI-powered tool that leverages Large Language Models (LLMs) for rapid data visualization. Simply upload your …
Vizzy is an AI-powered tool that leverages Large Language Models (LLMs) for rapid data visualization. Simply upload your data file, and Vizzy's AI will analyze it to automatically generate insightful charts, graphs, and maps. It's a no-code, open-source platform designed to make data analysis accessible to everyone, from researchers to business analysts. Explore public datasets or visualize your own, turning raw numbers into clear visuals in seconds.
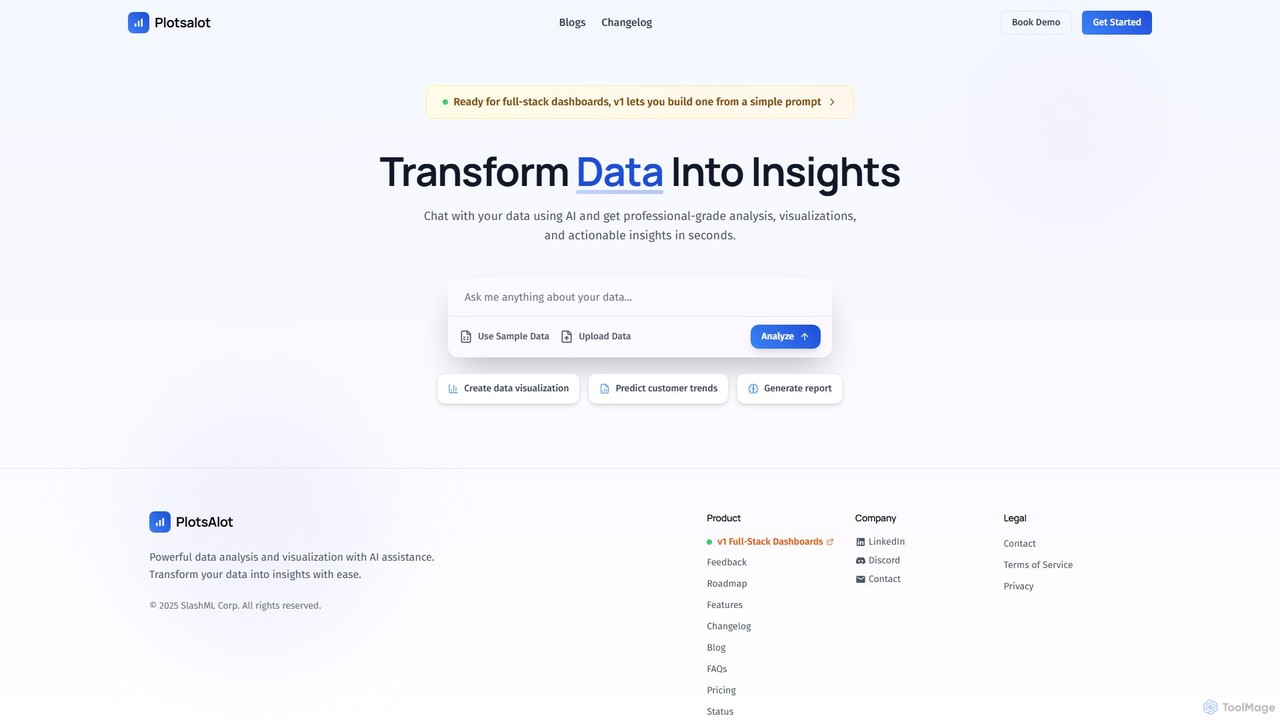
PlotsAlot
PlotsAlot is an AI-powered data analysis and visualization platform that transforms raw data into professional-grade charts, dashboards, and …
PlotsAlot is an AI-powered data analysis and visualization platform that transforms raw data into professional-grade charts, dashboards, and actionable insights. Simply upload your data and use natural language prompts to chat with it, perform advanced analysis, and predict trends in seconds.

Viewit Ai Chatbot
An AI-powered chatbot that transforms your data into insightful visualizations and summaries through simple, natural language conversations. Upload …
An AI-powered chatbot that transforms your data into insightful visualizations and summaries through simple, natural language conversations. Upload your dataset, ask questions, and instantly receive charts, graphs, and key metrics, making data analysis accessible to everyone without needing complex software or coding skills.
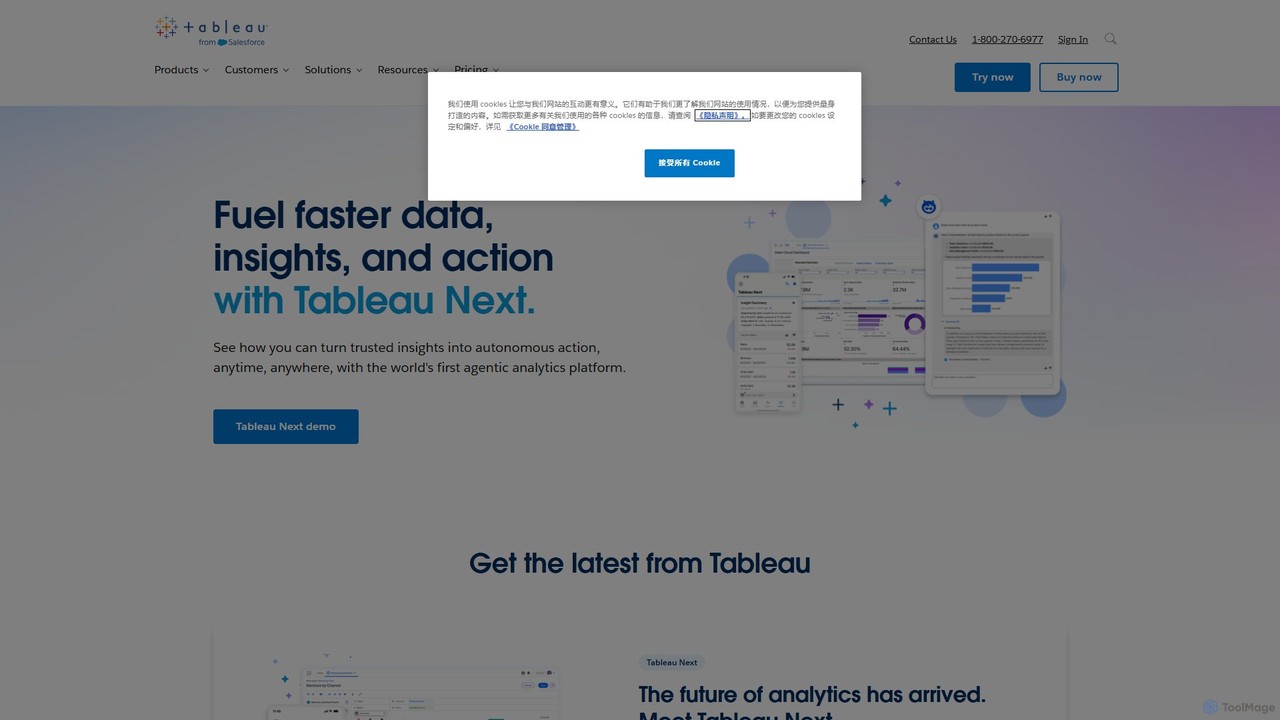
Tableau
Tableau is a leading AI-powered business intelligence and analytics platform that helps people see and understand data. It …
Tableau is a leading AI-powered business intelligence and analytics platform that helps people see and understand data. It enables users to create interactive dashboards, perform complex data analysis, and share insights across their organization, enhanced by AI features like Tableau Agent for accelerated decision-making.
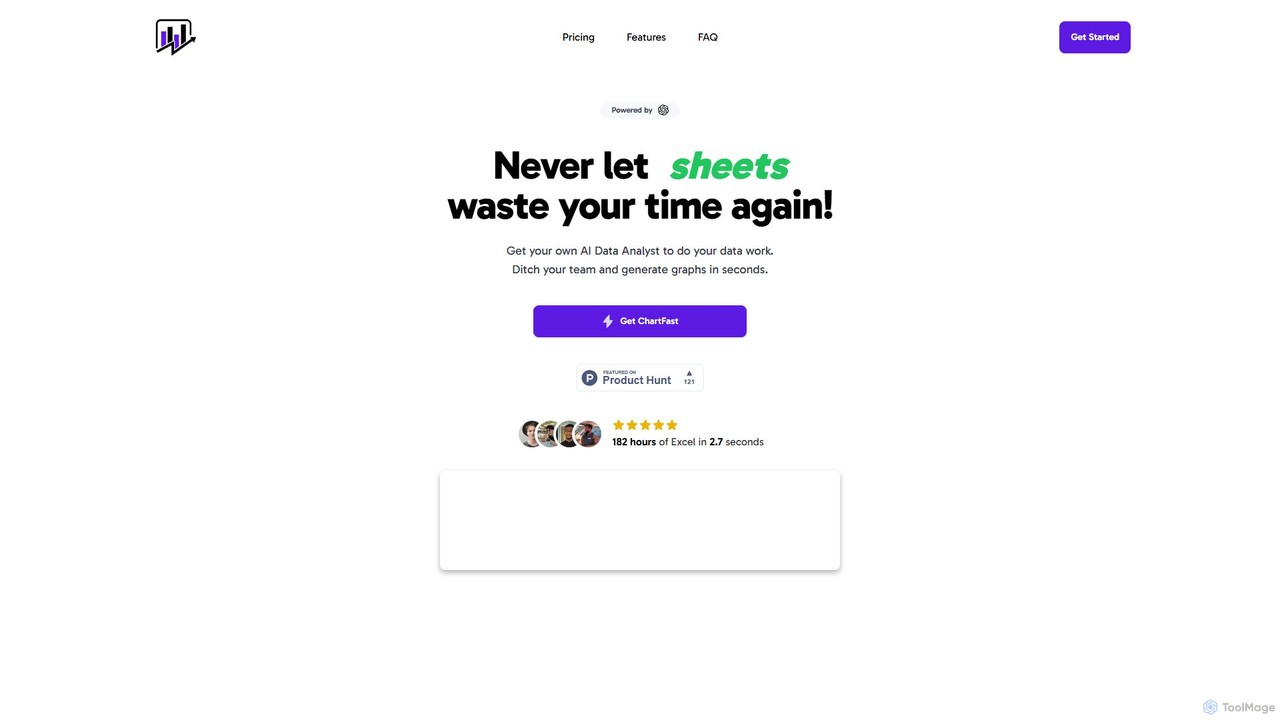
ChartFast
ChartFast is an AI-powered data analyst that transforms your data work. Upload CSV or Excel files, and it …
ChartFast is an AI-powered data analyst that transforms your data work. Upload CSV or Excel files, and it automatically cleans, analyzes, and visualizes your data. Generate complex charts and gain insights in seconds by simply asking questions, eliminating hours of manual spreadsheet tasks.
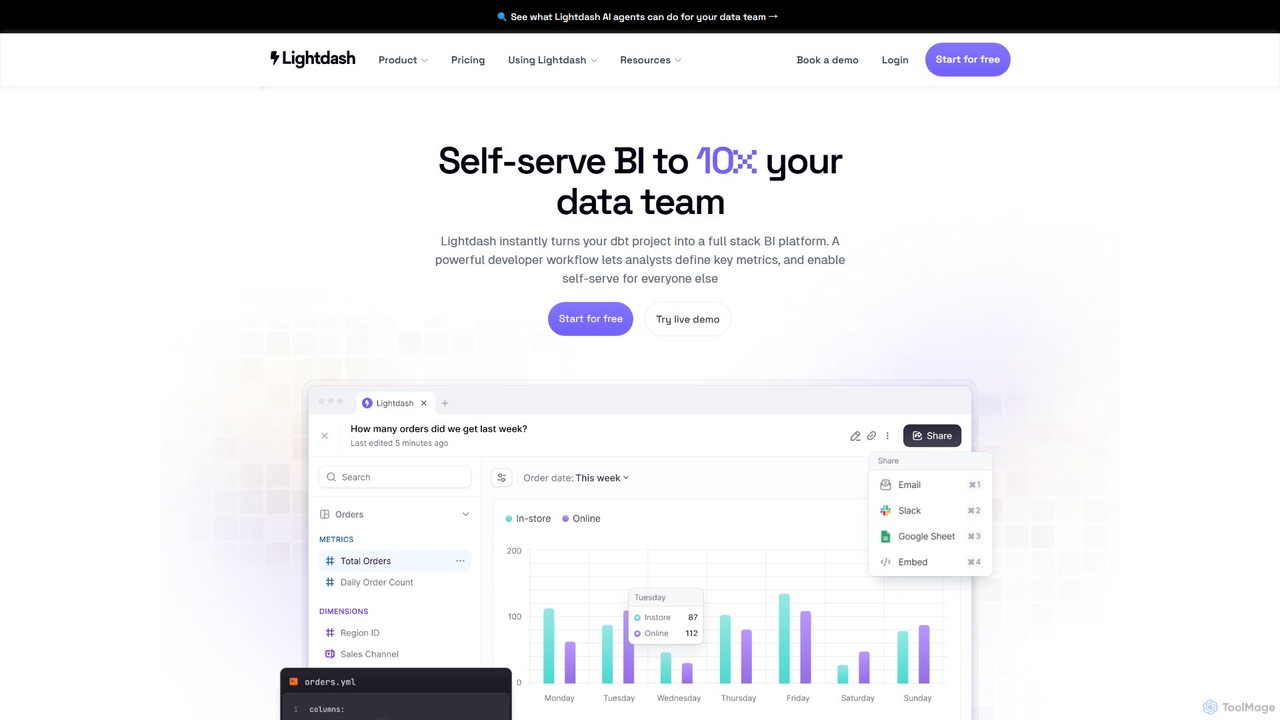
Lightdash
Lightdash is an open-source, AI-powered business intelligence (BI) platform built specifically for dbt. It empowers entire teams with …
Lightdash is an open-source, AI-powered business intelligence (BI) platform built specifically for dbt. It empowers entire teams with self-serve analytics, allowing users to ask data questions in plain English. With developer-friendly workflows and no per-user pricing, it's designed to make data accessible to everyone, from data engineers to business stakeholders.
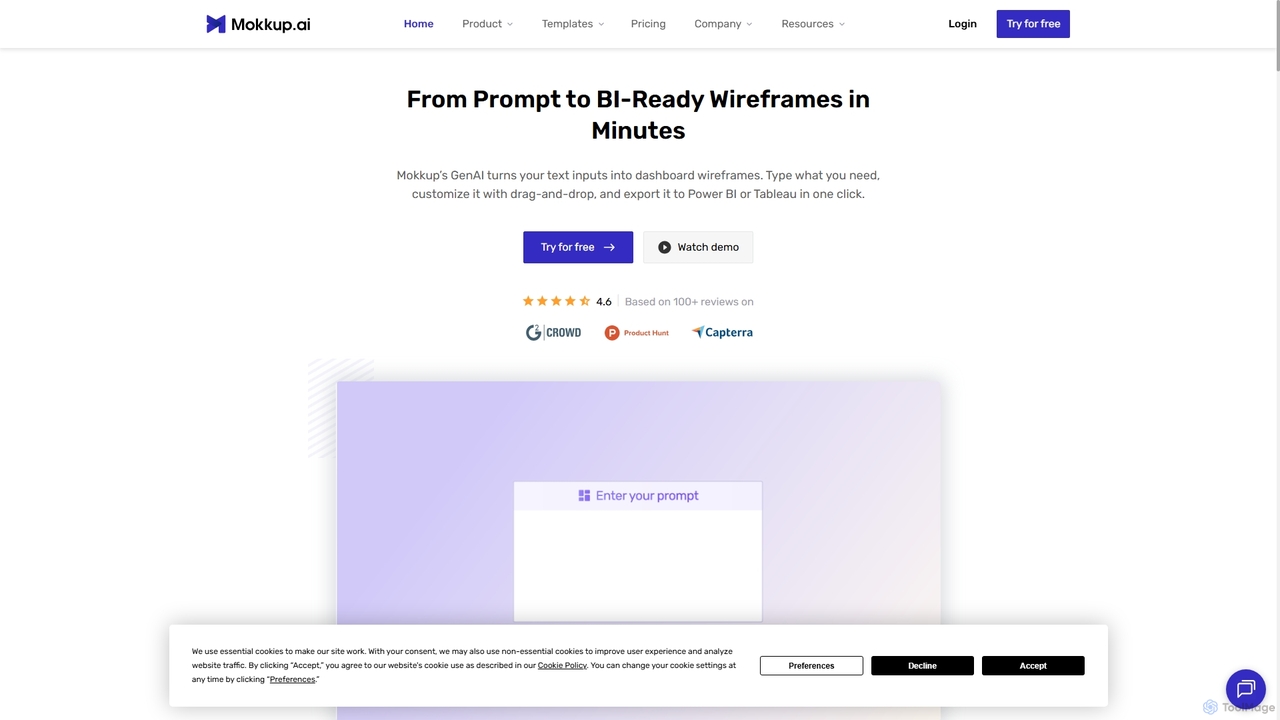
Mokkup
Mokkup is an AI-powered dashboard wireframing tool that transforms text prompts into high-fidelity, BI-ready mockups in minutes. Designed …
Mokkup is an AI-powered dashboard wireframing tool that transforms text prompts into high-fidelity, BI-ready mockups in minutes. Designed for data analysts and BI developers, it simplifies the design process with a drag-and-drop editor, real-time collaboration, and one-click export to Power BI and Tableau, accelerating the entire business intelligence workflow.
ChartAI Category
ChartAI Tag
ChartAI AI Tool Comparison
ChartAI Embed Feature
Just copy the embed code below and paste this beautiful badge on your blog, article, or official app website to drive traffic directly to this tool's detail page and quickly boost your exposure and user count!

No comments yet, be the first to comment!