astronuts
Visit Website
astronuts Overview
astronuts is a next-generation data intelligence and visualization platform designed to empower businesses by making data analysis accessible to everyone. In a world saturated with data, astronuts acts as your mission control, navigating through complex datasets to uncover critical insights that drive growth and innovation. By leveraging advanced AI and machine learning algorithms, the platform automates the entire analysis process, from data integration to insight discovery, allowing teams to focus on strategy and action rather than manual data wrangling.
The core philosophy behind astronuts is the democratization of data. It breaks down the barriers between data and decision-makers, enabling users without a technical background to explore data, ask complex questions, and understand the story their data is telling. Whether you're in marketing, sales, finance, or operations, astronuts provides the tools you need to become a data-driven powerhouse.
How to use astronuts
Getting started with astronuts is a seamless, three-step process designed for speed and efficiency:
- Connect Your Data: Securely connect to a wide range of data sources in just a few clicks. astronuts supports everything from simple CSV files and Google Sheets to complex SQL databases (like PostgreSQL, MySQL) and cloud data warehouses (like BigQuery, Snowflake, Redshift). The integration process is intuitive and requires no coding.
- Ask & Explore: Once your data is connected, start your exploration. Use the Natural Language Query (NLQ) feature to ask questions in plain English, such as "Show me the monthly revenue trend for the last year" or "Which marketing channels had the highest ROI in Q4?". The AI engine will instantly translate your questions into queries and present the results as beautiful, easy-to-understand visualizations.
- Visualize & Collaborate: Drag and drop your way to creating stunning, interactive dashboards. Customize charts, graphs, and tables to monitor your key performance indicators (KPIs) in real-time. Share your dashboards and insights with your team members in a collaborative workspace, add comments, and export reports to PDF or PNG to drive alignment and informed decision-making across your organization.
Core Features of astronuts
- AI-Powered Insight Engine: Automatically scans your data to identify significant trends, anomalies, correlations, and key business drivers without any manual effort.
- Natural Language Query (NLQ): Interact with your data by asking questions in plain English, making data analysis as simple as having a conversation.
- Automated Data Visualization: The platform intelligently selects the best chart or graph type to represent your data, ensuring clarity and impact.
- Interactive & Customizable Dashboards: Build real-time, dynamic dashboards with a user-friendly drag-and-drop interface to track the metrics that matter most.
- Predictive Analytics & Forecasting: Leverage built-in machine learning models to forecast future trends, predict outcomes, and perform what-if analysis.
- Collaborative Workspaces: Share dashboards, reports, and insights with your team, fostering a data-driven culture.
- Multi-Source Data Integration: Seamlessly connect and blend data from various sources to get a unified view of your business.
Use Cases for astronuts
astronuts is versatile and can be applied across various departments:
- Marketing Teams: Analyze campaign performance, track customer acquisition cost (CAC), understand customer lifetime value (LTV), and segment audiences for targeted messaging.
- Sales Departments: Monitor sales pipelines, forecast revenue, track team performance against quotas, and identify top-performing regions or products.
- Financial Analysts: Automate financial reporting, monitor cash flow, detect spending anomalies, and conduct budget vs. actual analysis.
- Product Managers: Understand user behavior, track feature adoption rates, analyze user funnels, and prioritize roadmap features based on data-driven evidence.
- Operations & Logistics: Optimize supply chains, monitor inventory levels, and improve operational efficiency by identifying bottlenecks.
Advantages of astronuts
astronuts offers a significant competitive edge by being more than just a BI tool. Its key advantages include its speed, intelligence, and accessibility. Unlike traditional BI platforms that require extensive setup and a steep learning curve, astronuts delivers insights in minutes. Its proactive AI engine finds opportunities and risks you might have missed, turning data analysis from a reactive reporting task into a proactive discovery process. This empowers every team member to contribute to business intelligence, fostering a more agile and informed organization.
Pricing and Plans
astronuts offers a flexible pricing structure to suit teams of all sizes. (Note: The following is a representative model as the site is under construction.)
- Explorer (Free): Perfect for individuals and small projects. Includes 1 user, 2 data sources, and basic dashboard features.
- Pioneer (Paid): Designed for growing teams. Includes up to 10 users, unlimited data sources, advanced analytics, Natural Language Query, and standard support. Typically priced per user per month.
- Odyssey (Enterprise): A custom plan for large organizations. Includes unlimited users, premium features like predictive analytics, dedicated support, API access, and enhanced security and compliance. Contact sales for a custom quote.
astronuts Comments (0)
Log in to post comments
Log in nowastronuts Alternatives
View All
alta
alta is an AI-powered business intelligence platform that transforms complex data into clear, actionable insights. Ask questions in …
alta is an AI-powered business intelligence platform that transforms complex data into clear, actionable insights. Ask questions in natural language, get instant visualizations, and uncover future trends without writing a single line of code. It's data analysis, democratized for your entire team.

vizbox
vizbox is an AI-powered data visualization platform that transforms raw data into insightful charts, graphs, and interactive dashboards. …
vizbox is an AI-powered data visualization platform that transforms raw data into insightful charts, graphs, and interactive dashboards. Users can simply upload data or use natural language prompts to generate compelling visuals, making data analysis accessible to everyone, regardless of technical skill.
Stadai
Stadai is an advanced AI-powered platform for data analysis, business intelligence, and predictive modeling. It empowers users to …
Stadai is an advanced AI-powered platform for data analysis, business intelligence, and predictive modeling. It empowers users to transform complex data into actionable insights, automate reporting, and forecast trends through an intuitive, no-code interface.

viewlocity
viewlocity is an AI-powered business intelligence platform that transforms complex data into clear, actionable insights. It enables users …
viewlocity is an AI-powered business intelligence platform that transforms complex data into clear, actionable insights. It enables users to create interactive dashboards, perform predictive analysis, and query data using natural language, accelerating data-driven decision-making for teams of all sizes.
SlickAlgo
SlickAlgo is an AI data analyst platform that transforms natural language questions into instant data insights, Python code, …
SlickAlgo is an AI data analyst platform that transforms natural language questions into instant data insights, Python code, and interactive dashboards. It connects to over 50 data sources, enabling businesses to make data-driven decisions without coding.

pythia
Pythia is an AI-powered predictive analytics and strategic intelligence platform. It empowers businesses to analyze complex data, forecast …
Pythia is an AI-powered predictive analytics and strategic intelligence platform. It empowers businesses to analyze complex data, forecast future trends, and make data-driven decisions with unparalleled accuracy, acting as a digital oracle for modern enterprises.
Graphy
Graphy is an AI-powered data visualization tool that transforms raw data into beautiful, interactive charts and graphs in …
Graphy is an AI-powered data visualization tool that transforms raw data into beautiful, interactive charts and graphs in seconds. It simplifies data storytelling by automatically identifying key insights, allowing users to chat with their data, and offering extensive customization. Ideal for marketers, analysts, and teams who need to create compelling visual reports and presentations without complex software.

insyte
insyte is an AI-powered business intelligence platform that transforms complex data into clear, actionable insights. Ask questions in …
insyte is an AI-powered business intelligence platform that transforms complex data into clear, actionable insights. Ask questions in natural language, create interactive dashboards, and uncover hidden trends to drive business growth without needing a data scientist.
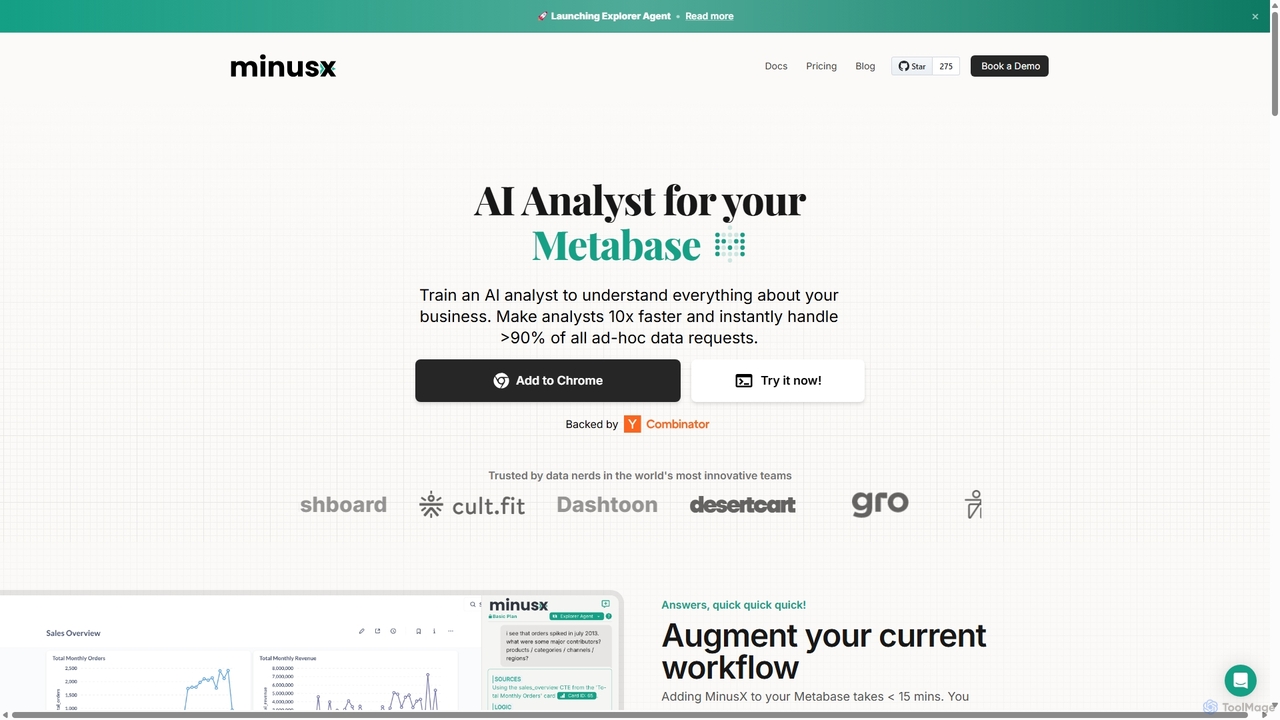
Minusx
Minusx is an AI data analyst designed to integrate seamlessly with Metabase. It empowers data analysts, business users, …
Minusx is an AI data analyst designed to integrate seamlessly with Metabase. It empowers data analysts, business users, and executives to query data using natural language, handling over 90% of ad-hoc requests instantly. By acting as a Chrome extension within your existing workflow, Minusx enhances productivity, codifies business knowledge through 'Context Engineering', and provides quick, accurate insights directly from your dashboards and reports, all while ensuring data security.
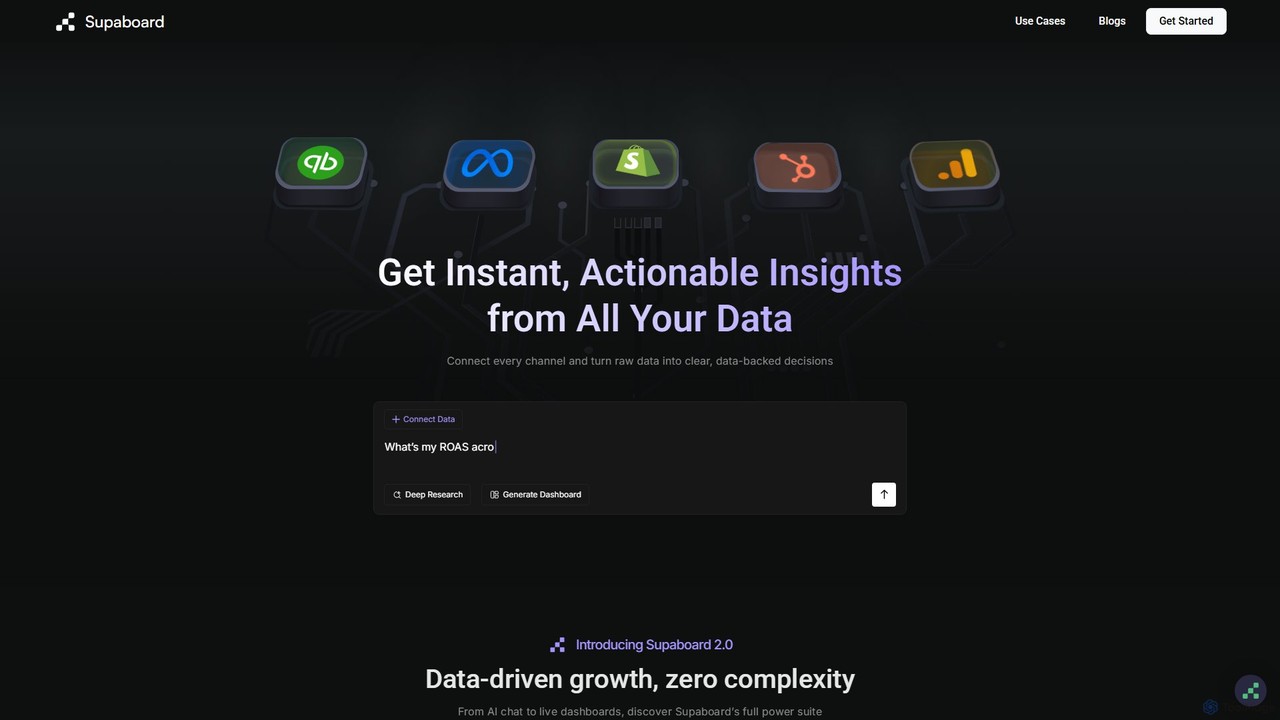
Supaboard
Supaboard is an AI-powered business intelligence platform that connects all your data sources into a unified hub. It …
Supaboard is an AI-powered business intelligence platform that connects all your data sources into a unified hub. It transforms raw data into actionable insights and live dashboards, allowing teams to make data-backed decisions quickly without needing to write code or wrangle spreadsheets.
astronuts Category
astronuts Tag
astronuts AI Tool Comparison
astronuts Embed Feature
Just copy the embed code below and paste this beautiful badge on your blog, article, or official app website to drive traffic directly to this tool's detail page and quickly boost your exposure and user count!

No comments yet, be the first to comment!