
vizbox Overview
vizbox is a cutting-edge, AI-driven platform designed to democratize data visualization. It empowers users to effortlessly convert complex datasets into clear, beautiful, and interactive visual representations. In a world saturated with data, the ability to quickly derive and communicate insights is crucial. vizbox addresses this need by providing an intuitive interface that bridges the gap between raw data and actionable intelligence. Whether you are a business analyst, a marketing professional, a student, or a researcher, vizbox equips you with the tools to tell compelling stories with your data, without requiring any background in coding or data science.
How to use vizbox
Getting started with vizbox is a seamless and straightforward process designed for maximum efficiency:
- Connect Your Data Source: Begin by linking your data. vizbox offers multiple options: upload a file directly from your computer (supports CSV, XLSX), connect to cloud services like Google Sheets, or link to a live database (e.g., PostgreSQL, MySQL) for real-time updates.
- Generate Visualizations with AI: This is where the magic happens. Use the AI-powered prompt bar to ask for what you want in plain English. For example, type "Show monthly sales trends for the last year as a line chart" or "Compare customer acquisition cost by channel using a bar chart." The AI will interpret your request and instantly generate the appropriate visualization.
- Customize and Refine: Once your chart is created, you have full control over its appearance. Use the intuitive editor to change chart types, adjust colors to match your brand, modify labels, add annotations, and tweak axes. The goal is to make the visualization perfectly suited to your narrative.
- Build Interactive Dashboards: Don't stop at a single chart. Combine multiple visualizations into a comprehensive, interactive dashboard. Drag and drop charts onto a canvas, resize and arrange them, and add filters that allow viewers to explore the data on their own.
- Share and Collaborate: Share your insights effortlessly. Generate a secure, shareable link to your live dashboard, embed it directly into your website or company wiki, or export your visuals as high-resolution images (PNG, JPG) or documents (PDF) for reports and presentations.
Core Features of vizbox
- Natural Language Processing (NLP) for Chart Generation: Simply type what you want to see, and let the AI build the visualization for you.
- Smart Chart Suggestions: The platform's AI analyzes your dataset and recommends the most effective chart types (bar, line, pie, scatter, etc.) to represent your data accurately.
- Interactive and Filterable Dashboards: Create dynamic dashboards that allow users to drill down into the data and uncover deeper insights.
- Broad Data Connectivity: Seamlessly connect to a wide range of data sources, including flat files, spreadsheets, and SQL databases.
- Extensive Customization Suite: A rich set of tools to control every visual aspect of your charts and dashboards, from colors and fonts to tooltips and legends.
- Real-time Data Synchronization: Keep your dashboards current with automatic data refreshes from connected live sources.
- Collaborative Workspaces: Invite team members to view, edit, and comment on dashboards, fostering a data-driven culture.
Use Cases for vizbox
vizbox is versatile and can be applied across various domains:
- Business Intelligence: Marketing teams can track campaign ROI and customer engagement. Sales teams can monitor performance against quotas and identify regional trends. Finance departments can visualize revenue, expenses, and profitability.
- Product Management: Analyze user behavior, track feature adoption rates, and monitor key product metrics to inform development roadmaps.
- Academic Research: Researchers and students can visualize experimental results, survey data, and statistical models for publications and presentations.
- Content Creation & Journalism: Create compelling, data-driven infographics and stories for blogs, articles, and social media to engage audiences.
- Operations & Logistics: Monitor key operational metrics like website performance, supply chain efficiency, and inventory levels in real-time.
Advantages of vizbox
vizbox stands out from traditional BI tools with several key advantages:
- Accessibility: Its no-code, natural language interface makes sophisticated data analysis accessible to non-technical users.
- Speed and Efficiency: Drastically reduces the time from raw data to insightful dashboard, allowing for faster decision-making.
- Enhanced Clarity: The AI-driven suggestions help ensure that you are using the most effective visualization, preventing misinterpretation of data.
- Seamless Collaboration: Shared dashboards act as a single source of truth, aligning teams and improving communication.
- Cost-Effective: Provides powerful BI capabilities at a fraction of the cost and complexity of enterprise-level solutions like Tableau or Power BI.
Pricing and Plans
vizbox offers a flexible freemium model to suit different needs:
- Free Plan: Ideal for individuals, students, and small projects. Includes a limited number of projects, basic chart types, and standard data connectors. vizbox branding will be present on shared visuals.
- Pro Plan: Designed for professionals and small teams. Offers a significant increase in projects and dashboards, access to all chart types, premium data connectors, real-time data sync, and the ability to remove branding. Billed monthly or annually.
- Enterprise Plan: A custom solution for large organizations. Provides unlimited usage, advanced security features (SSO), dedicated support, API access for programmatic integration, and robust team management controls. Contact sales for custom pricing.
vizbox Comments (0)
Log in to post comments
Log in nowvizbox Alternatives
View All
astronuts
astronuts is an AI-powered data intelligence platform that transforms complex data into clear, actionable insights. Connect your data …
astronuts is an AI-powered data intelligence platform that transforms complex data into clear, actionable insights. Connect your data sources, ask questions in natural language, and automatically generate interactive dashboards and reports. It's designed for teams to explore data, uncover hidden patterns, and make smarter decisions, faster.
alta
alta is an AI-powered business intelligence platform that transforms complex data into clear, actionable insights. Ask questions in …
alta is an AI-powered business intelligence platform that transforms complex data into clear, actionable insights. Ask questions in natural language, get instant visualizations, and uncover future trends without writing a single line of code. It's data analysis, democratized for your entire team.
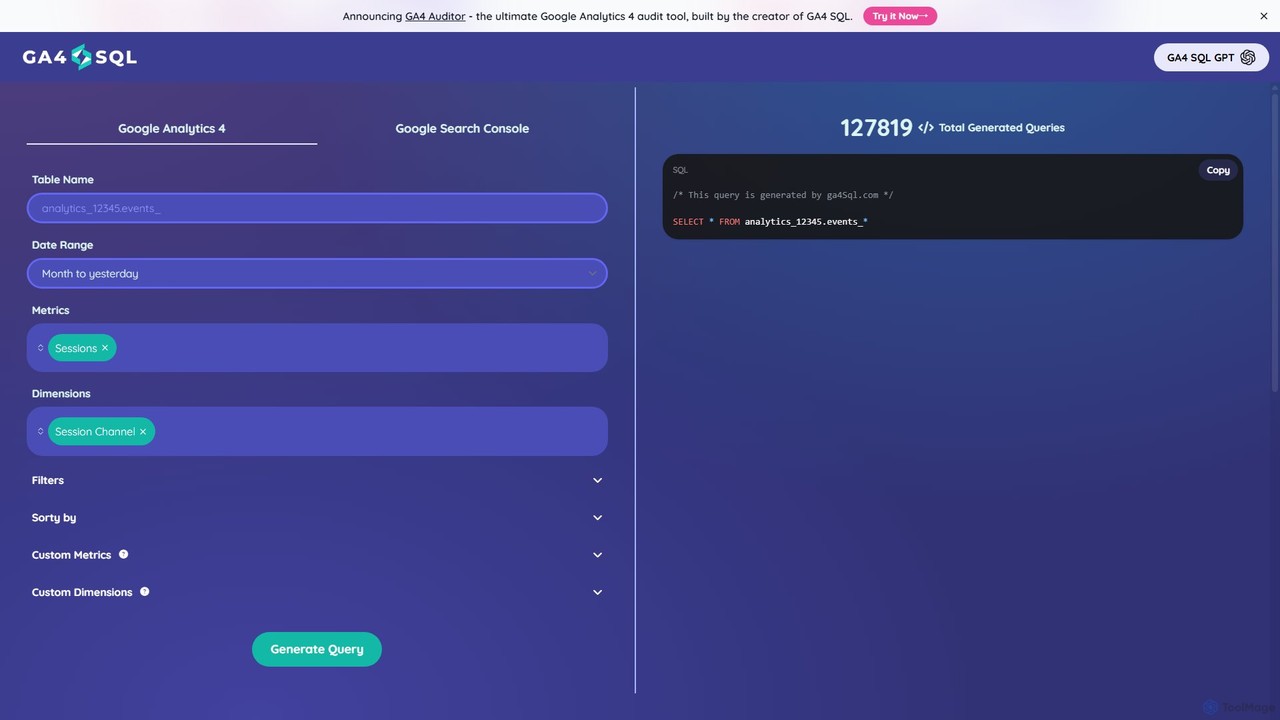
ga4sql
ga4sql is a free, user-friendly tool that empowers marketers and analysts to generate Google Analytics 4 (GA4) BigQuery …
ga4sql is a free, user-friendly tool that empowers marketers and analysts to generate Google Analytics 4 (GA4) BigQuery queries without any SQL knowledge. Simply select your desired metrics, dimensions, and date range through an intuitive interface, and the tool instantly creates the correct SQL query. It's the fastest way to unlock deep insights from your GA4 data in BigQuery, saving time and eliminating coding errors.
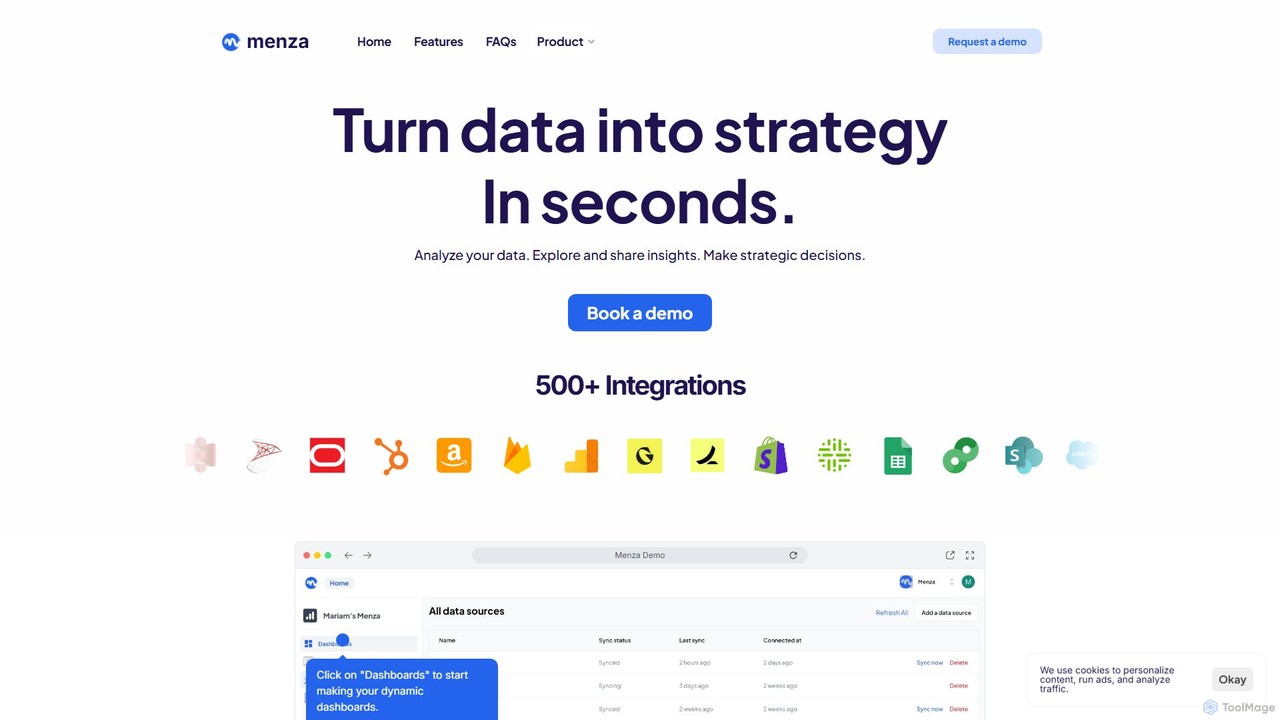
menza
menza is an AI-powered data analysis platform that transforms business data into actionable strategic insights in seconds. It …
menza is an AI-powered data analysis platform that transforms business data into actionable strategic insights in seconds. It allows non-technical users to analyze data, build interactive dashboards, and collaborate on decisions using plain language and a simple interface.
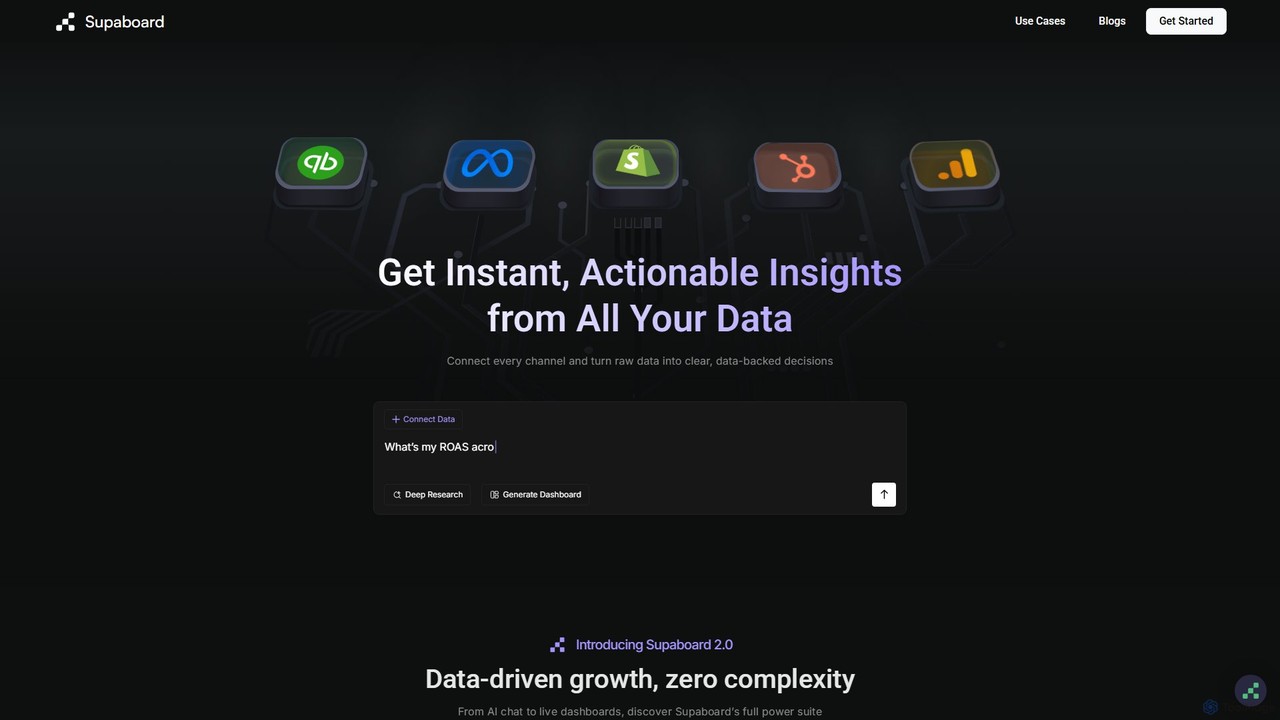
Supaboard
Supaboard is an AI-powered business intelligence platform that connects all your data sources into a unified hub. It …
Supaboard is an AI-powered business intelligence platform that connects all your data sources into a unified hub. It transforms raw data into actionable insights and live dashboards, allowing teams to make data-backed decisions quickly without needing to write code or wrangle spreadsheets.
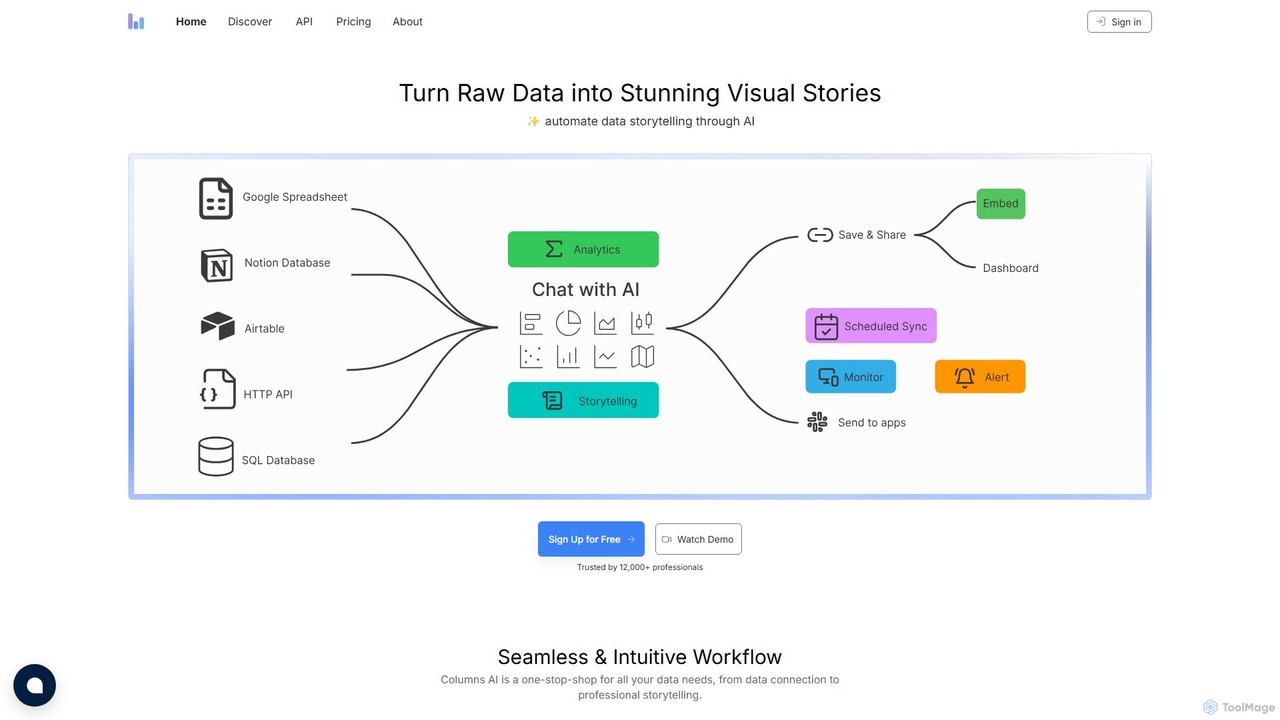
Columns
Columns is an AI-powered data storytelling platform that transforms raw data into stunning visual narratives. Using natural language, …
Columns is an AI-powered data storytelling platform that transforms raw data into stunning visual narratives. Using natural language, users can ask questions, generate insightful charts, and create professional presentations. It connects to various data sources like Google Sheets, SQL databases, and APIs, automating the entire process from data connection to visual storytelling.
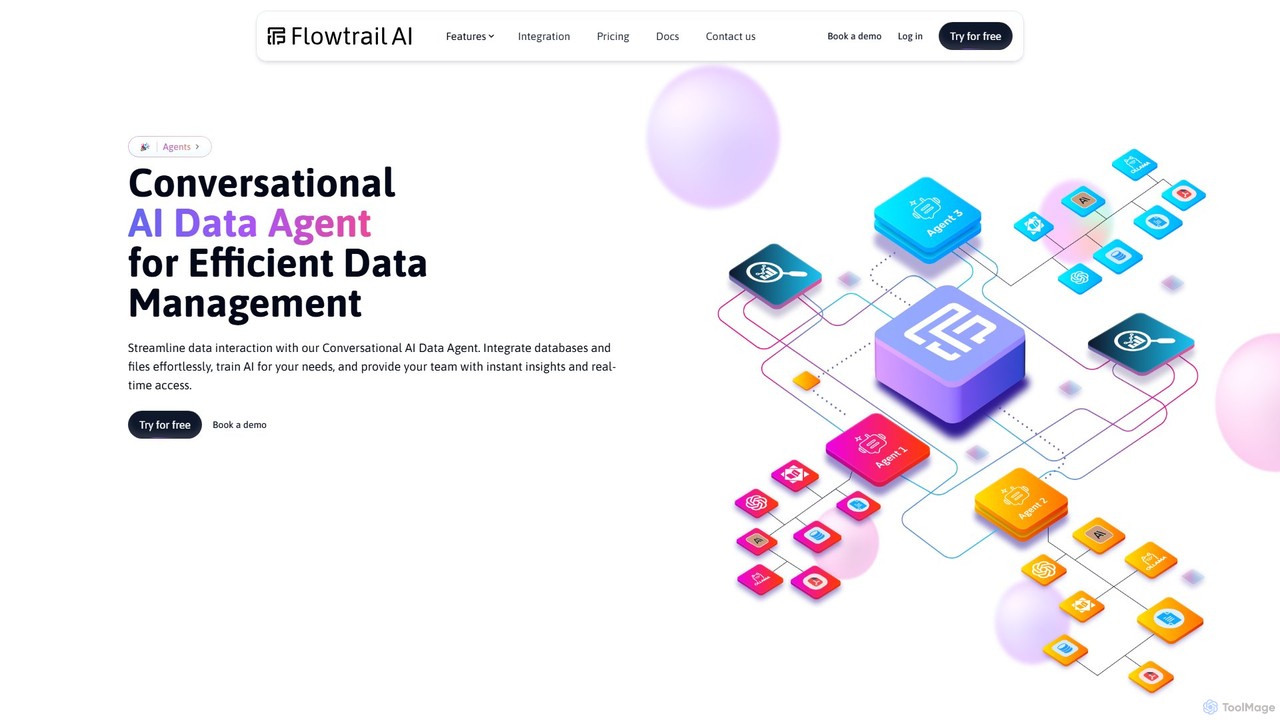
Flowtrail
Flowtrail is a conversational AI data agent that transforms how you interact with your data. Connect databases and …
Flowtrail is a conversational AI data agent that transforms how you interact with your data. Connect databases and files, ask questions in natural language, and receive instant insights, visualizations, and reports. It's a no-code platform designed to make data analysis accessible to everyone, from small businesses to large enterprises, fostering a data-driven culture.
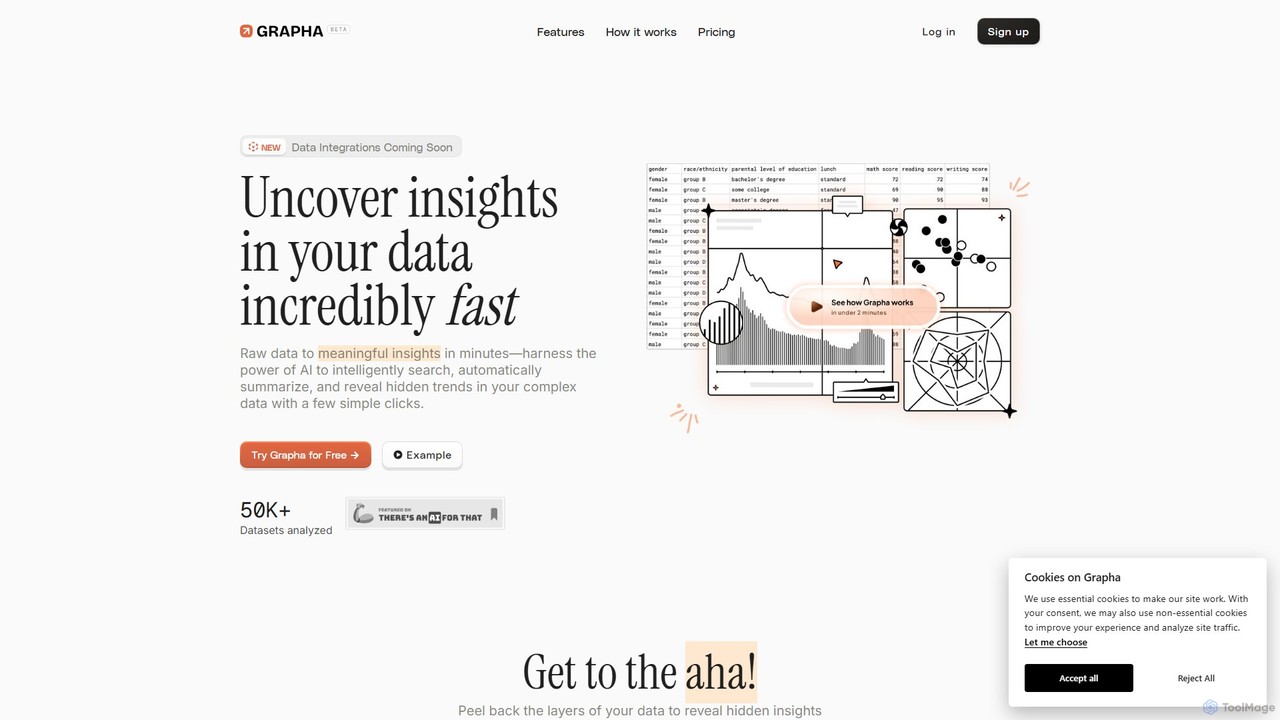
Grapha.ai
Grapha.ai is an AI-powered data exploration tool that transforms complex datasets into clear, actionable insights. Using a natural …
Grapha.ai is an AI-powered data exploration tool that transforms complex datasets into clear, actionable insights. Using a natural language copilot, users can search, summarize, and visualize data without any coding. It's designed for everyone, from business analysts to small business owners, to uncover hidden trends and make data-driven decisions in minutes.
Stadai
Stadai is an advanced AI-powered platform for data analysis, business intelligence, and predictive modeling. It empowers users to …
Stadai is an advanced AI-powered platform for data analysis, business intelligence, and predictive modeling. It empowers users to transform complex data into actionable insights, automate reporting, and forecast trends through an intuitive, no-code interface.

pandalyst
Pandalyst is an AI-powered data analysis platform that transforms how you interact with data. Ask questions in natural …
Pandalyst is an AI-powered data analysis platform that transforms how you interact with data. Ask questions in natural language and receive instant visualizations, insights, and reports. It automates complex data tasks, making business intelligence accessible to everyone, from analysts to business leaders, without writing a single line of code.
vizbox Category
vizbox Tag
vizbox AI Tool Comparison
vizbox Embed Feature
Just copy the embed code below and paste this beautiful badge on your blog, article, or official app website to drive traffic directly to this tool's detail page and quickly boost your exposure and user count!

No comments yet, be the first to comment!