ChartFast is an AI-powered data analyst that transforms your data work. Upload CSV or Excel files, and it automatically cleans, analyzes, and visualizes your data. Generate complex charts and gain insights in seconds by simply asking questions, eliminating hours of manual spreadsheet tasks.

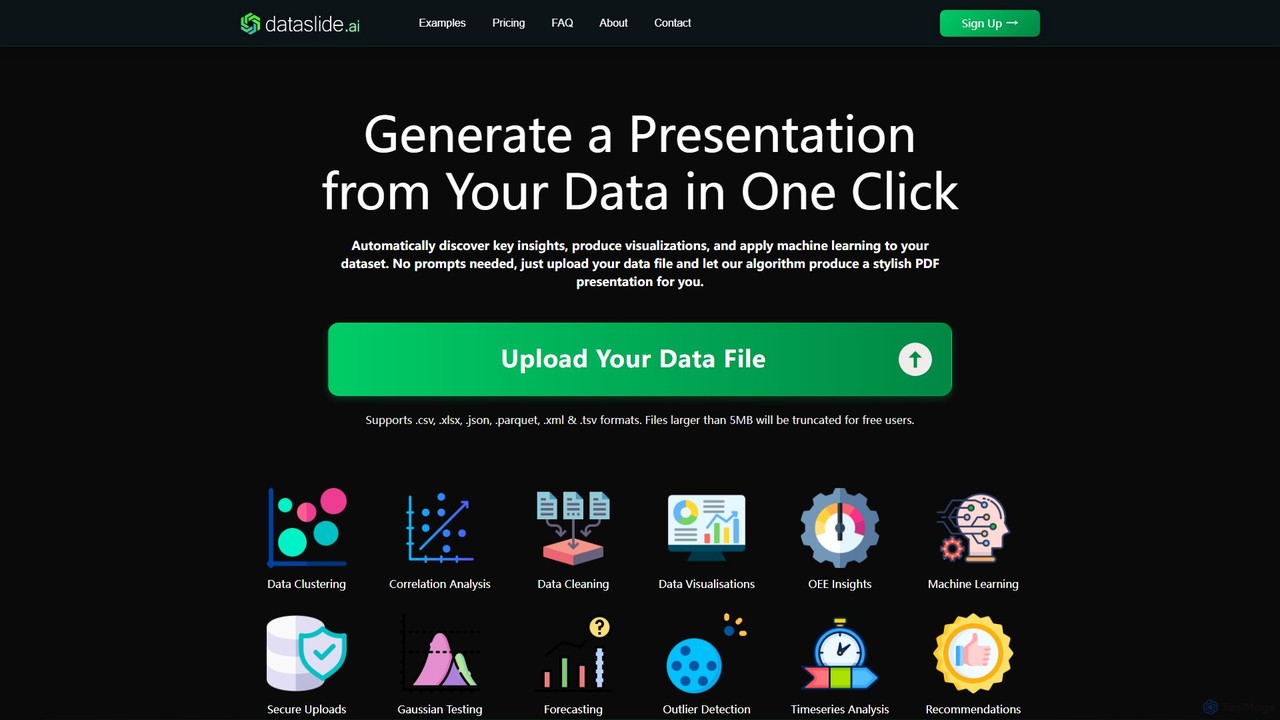
Dataslide.ai is an AI-powered tool that automatically generates insightful presentations from your data in a single click. Simply upload your data file (.csv, .xlsx, etc.), and it performs data cleaning, visualization, and machine learning to produce a comprehensive PDF or PowerPoint report, saving hours of manual analysis.
Product overview
ChartFast Product overview
ChartFast is an AI-powered data analyst that transforms your data work. Upload CSV or Excel files, and it automatically cleans, analyzes, and visualizes your data. Generate complex charts and gain insights in seconds by simply asking questions, eliminating hours of manual spreadsheet tasks.
Dataslide.ai Product overview
Dataslide.ai is an AI-powered tool that automatically generates insightful presentations from your data in a single click. Simply upload your data file (.csv, .xlsx, etc.), and it performs data cleaning, visualization, and machine learning to produce a comprehensive PDF or PowerPoint report, saving hours of manual analysis.
Detailed feature comparison
| Feature | ChartFast | Dataslide.ai |
|---|---|---|
| Primary category | Business Intelligence | Business Intelligence |
| Added | 2025-08-14 | 2025-08-10 |
| Pricing | Paid | Freemium |
| Official website | www.chartfast.io | www.csv-ai.com |
| Product type | Website | Website |
| Performance data | ||
| User rating | Not verified | Not verified |
| Comments | 0 | 0 |
| Monthly visits | 4.4K | 4.3K |
| Monthly growth | Not verified | Not verified |
| Favorites | 123 | 116 |
| Details | View details | View details |
ChartFast vs Dataslide.ai monthly traffic
Compare ChartFast and Dataslide.ai by monthly reach, traffic trend, visit depth, top regions, and acquisition sources.
How to interpret the traffic data
In the ChartFast vs Dataslide.ai monthly traffic comparison, ChartFast currently shows 4.4K visits and Dataslide.ai shows 4.3K; the two products have similar visible traffic, an absolute difference of about 80 visits. This reflects visible reach, not feature quality or paid users.
Both values come from visits recorded inside ToolMage. They can indicate relative interest on this site, but not total website traffic or global market share.
ChartFast monthly traffic:
Latest traffic
Dataslide.ai monthly traffic:
Latest traffic
Usage comparison
Compare the core capabilities of ChartFast and Dataslide.ai
ChartFast Core features
Dataslide.ai Core features
Use cases
ChartFast Use cases
Dataslide.ai Use cases
ChartFast vs Dataslide.ai:In-depth comparison and selection guidance
First decide whether the products solve the same kind of need
This in-depth ChartFast vs Dataslide.ai comparison uses only the product records, taxonomy, audience, traffic, and community signals available on this page. ChartFast is primarily listed under “Business Intelligence”, while Dataslide.ai is primarily listed under “Business Intelligence”, so the first decision is whether your actual task matches their recorded scope.
The structured fields currently show these decision-relevant differences: Pricing (ChartFast: Paid; Dataslide.ai: Freemium); Monthly visits (ChartFast: 4.4K; Dataslide.ai: 4.3K); Favorites (ChartFast: 123; Dataslide.ai: 116); Website (ChartFast: www.chartfast.io; Dataslide.ai: www.csv-ai.com); Added (ChartFast: 2025-08-14; Dataslide.ai: 2025-08-10). These facts are more useful for selection than brand visibility alone.
What market visibility and monthly traffic mean
In the ChartFast vs Dataslide.ai monthly traffic comparison, ChartFast currently shows 4.4K visits and Dataslide.ai shows 4.3K; the two products have similar visible traffic, an absolute difference of about 80 visits. This reflects visible reach, not feature quality or paid users.
Both values come from visits recorded inside ToolMage. They can indicate relative interest on this site, but not total website traffic or global market share.
The current traffic scope is not sufficient for a reliable product ranking. Treat monthly visits as a market-interest signal, then decide using taxonomy, use cases, pricing, and a like-for-like trial rather than reading exposure as product capability.
Product positioning, use cases, and roles
ChartFast and Dataslide.ai currently overlap in shared categories: Business Intelligence, Visualization, and Data Analysis; shared tags: business intelligence, CSV analysis, data analysis, data visualization, and excel analysis. This can place both on the same shortlist, but it does not prove equal implementation, depth, or cost.
ChartFast's unique categories/tags are AI data analyst, chart generator, data cleaning, gpt-4o, and spreadsheet automation; Dataslide.ai's are Reporting, automatic insights, data science, machine learning, presentation generator, and report automation. These unique fields are the strongest differentiators: validate the product whose recorded scope matches the task instead of following traffic alone.
What ratings, comments, and favorites can tell you
ChartFast has no verified rating, 0 comments, 123 favorites, and 116 likes;Dataslide.ai has no verified rating, 0 comments, 116 favorites, and 116 likes。
Neither product has enough rating or comment samples for a credible reputation ranking.
Selection guidance by actual need
When to evaluate ChartFast first
Put ChartFast on the priority trial list when the task aligns with “Business Intelligence” and especially AI data analyst, chart generator, data cleaning, gpt-4o, and spreadsheet automation. This follows recorded positioning and does not imply unlisted capabilities are absent.
ChartFast also currently records: pricing is paid, product type is website, 4.4K on-site monthly views, no verified user rating. Verify any hard requirement around price, platform, or reach before trial, and do not let sparse review data substitute for testing.
When to evaluate Dataslide.ai first
Put Dataslide.ai on the priority trial list when the task aligns with “Business Intelligence” and especially Reporting, automatic insights, data science, machine learning, presentation generator, and report automation. This follows recorded positioning and does not imply unlisted capabilities are absent.
Dataslide.ai also currently records: pricing is freemium, product type is website, 4.3K on-site monthly views, no verified user rating. Verify any hard requirement around price, platform, or reach before trial, and do not let sparse review data substitute for testing.
How to validate the recommendation before deciding
The available data describes positioning, public visibility, and community signals, but it cannot prove output quality, speed, integration effort, privacy, or long-term cost in your workflow. Before deciding, run the same representative tasks in ChartFast and Dataslide.ai, then record completion time, accuracy, manual corrections, and the real paid threshold. A like-for-like trial turns this comparison into a defensible adoption decision.
Comparison FAQ
How should I choose between ChartFast and Dataslide.ai?
Where does this comparison data come from?
What do unknown fields mean?
Related AI tools

Powerdrill
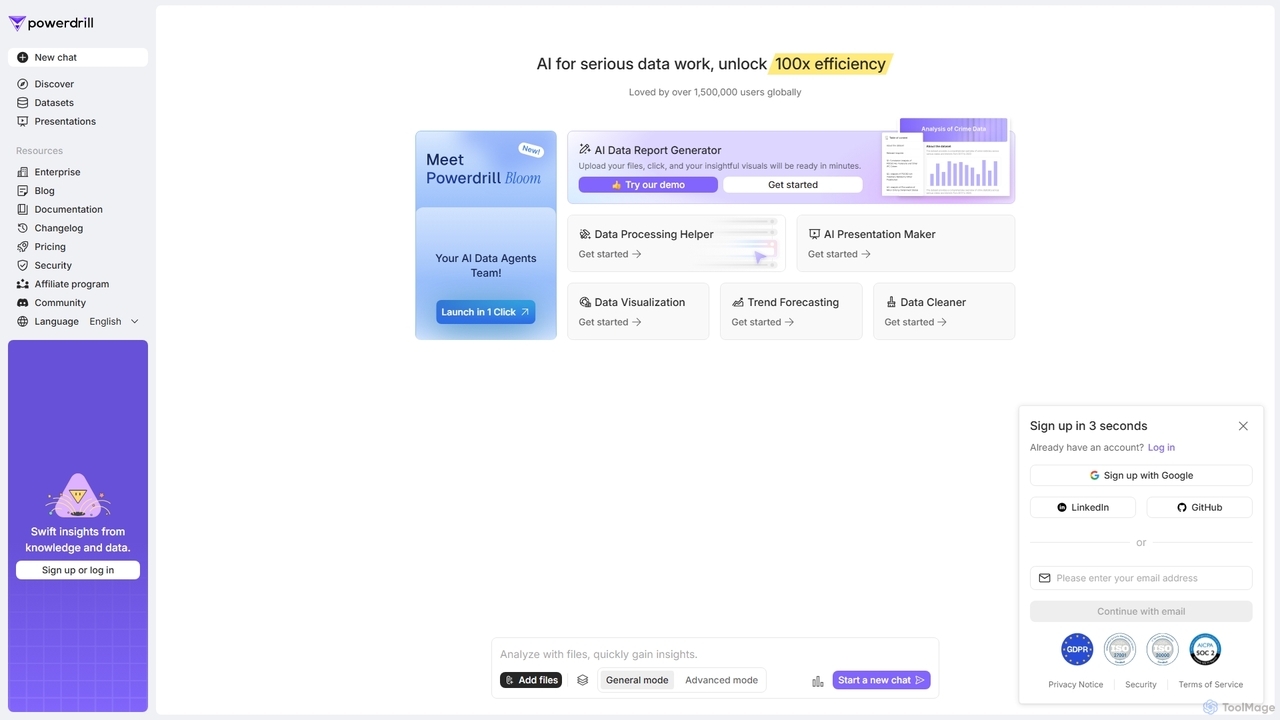
Powerdrill is an AI-powered data analysis platform designed for serious data work, enabling users to unlock 100x efficiency. It automates the entire process from data processing and cleaning to visualization, report generation, and trend forecasting. Simply upload your files (Excel, CSV, PDF) or connect to a database, and let the AI generate actionable insights, interactive charts, and comprehensive presentations in minutes.
Business Intelligence
InsightJini
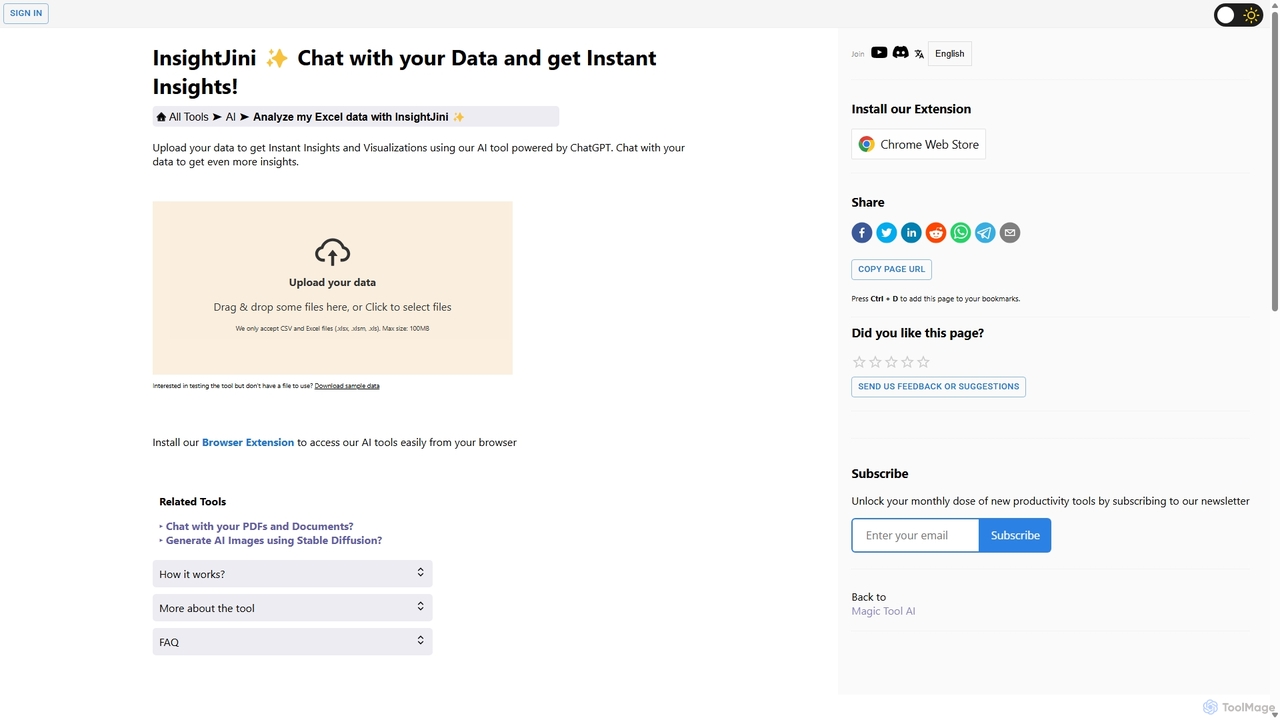
InsightJini is an AI-powered data analysis tool that lets you chat with your Excel and CSV files. Upload your data to instantly generate visualizations and insights without any coding. Its conversational interface, powered by ChatGPT, makes data exploration intuitive and accessible for everyone.
Business Intelligence
Viewit Ai Chatbot
An AI-powered chatbot that transforms your data into insightful visualizations and summaries through simple, natural language conversations. Upload your dataset, ask questions, and instantly receive charts, graphs, and key metrics, making data analysis accessible to everyone without needing complex software or coding skills.
Business Intelligence
Deepnote
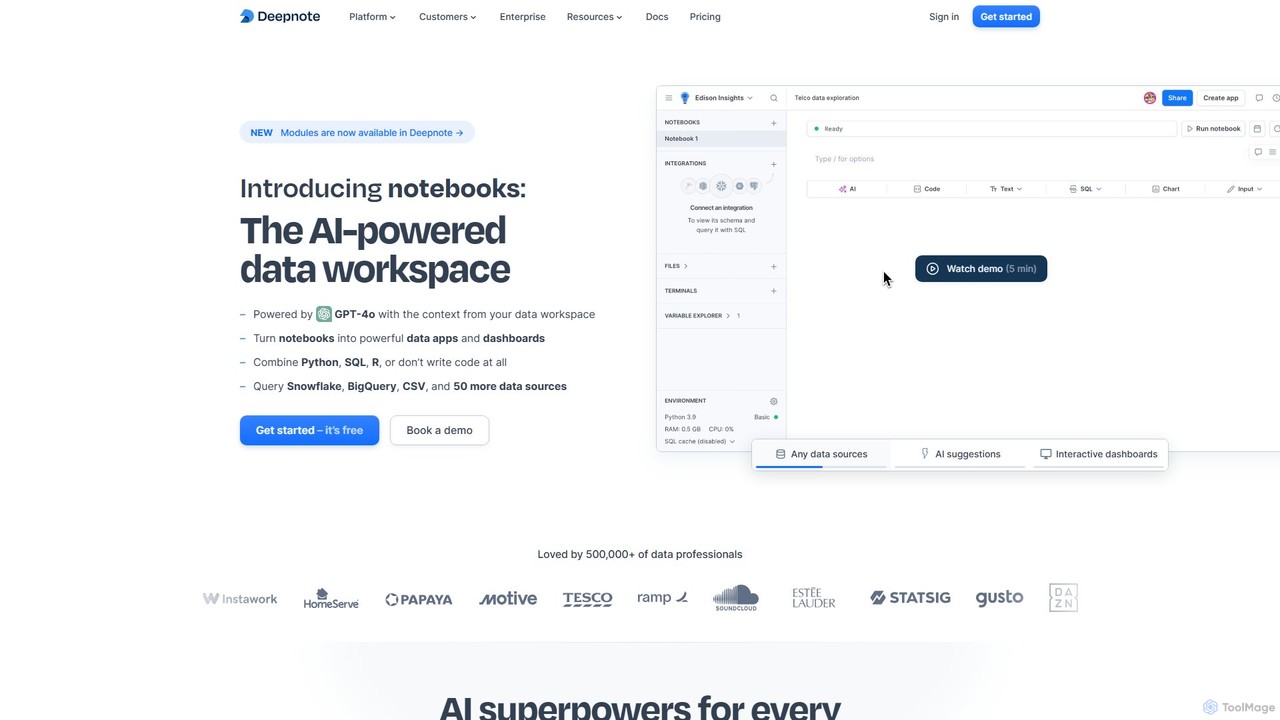
Deepnote is an AI-powered, collaborative data science notebook for teams. It unifies Python, SQL, and R in a single cloud-based workspace, enabling users to explore data, build machine learning models, and create interactive dashboards and apps with ease. Powered by GPT-4o, it automates analysis and code generation, making data science accessible to all skill levels.
Business Intelligence
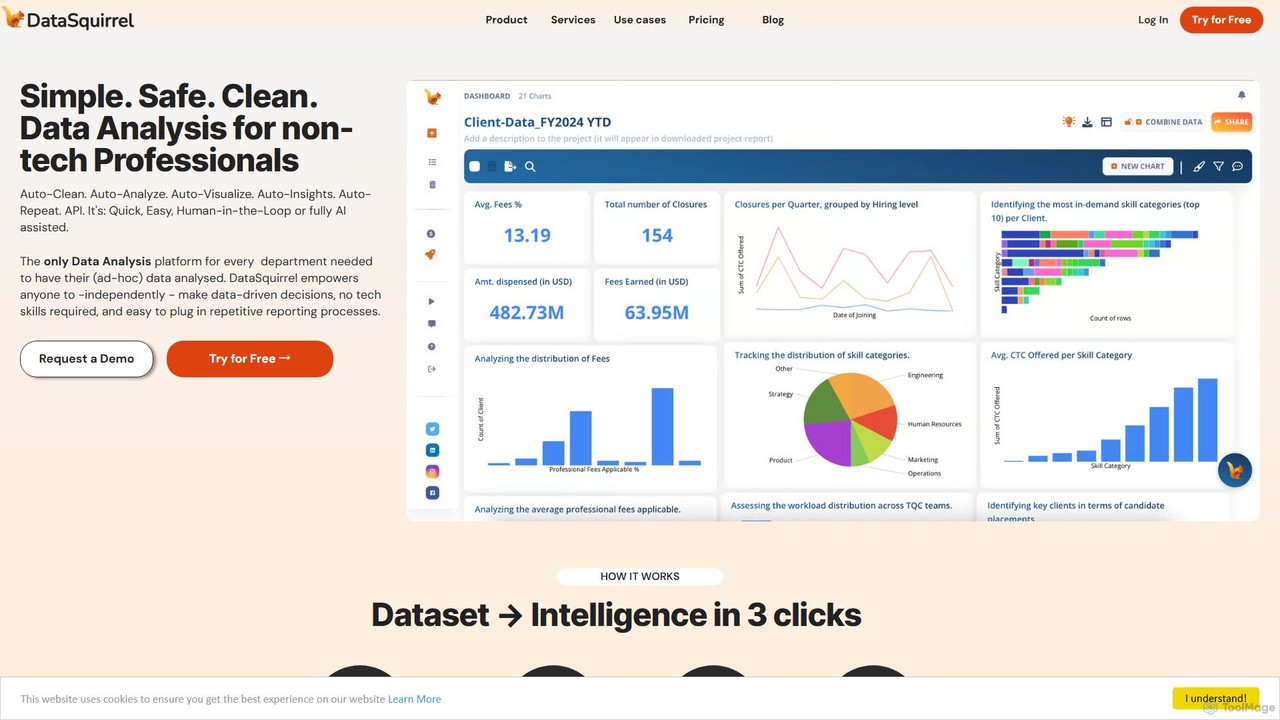
DataSquirrel.ai
DataSquirrel.ai is an AI-powered data analysis platform designed for non-technical business professionals. It automates the entire data workflow, from cleaning and analysis to visualization and reporting. Users can upload data via CSV, Excel, or Google Sheets and receive instant, actionable insights and interactive dashboards without writing any code or formulas, ensuring data security and compliance.
Business Intelligence
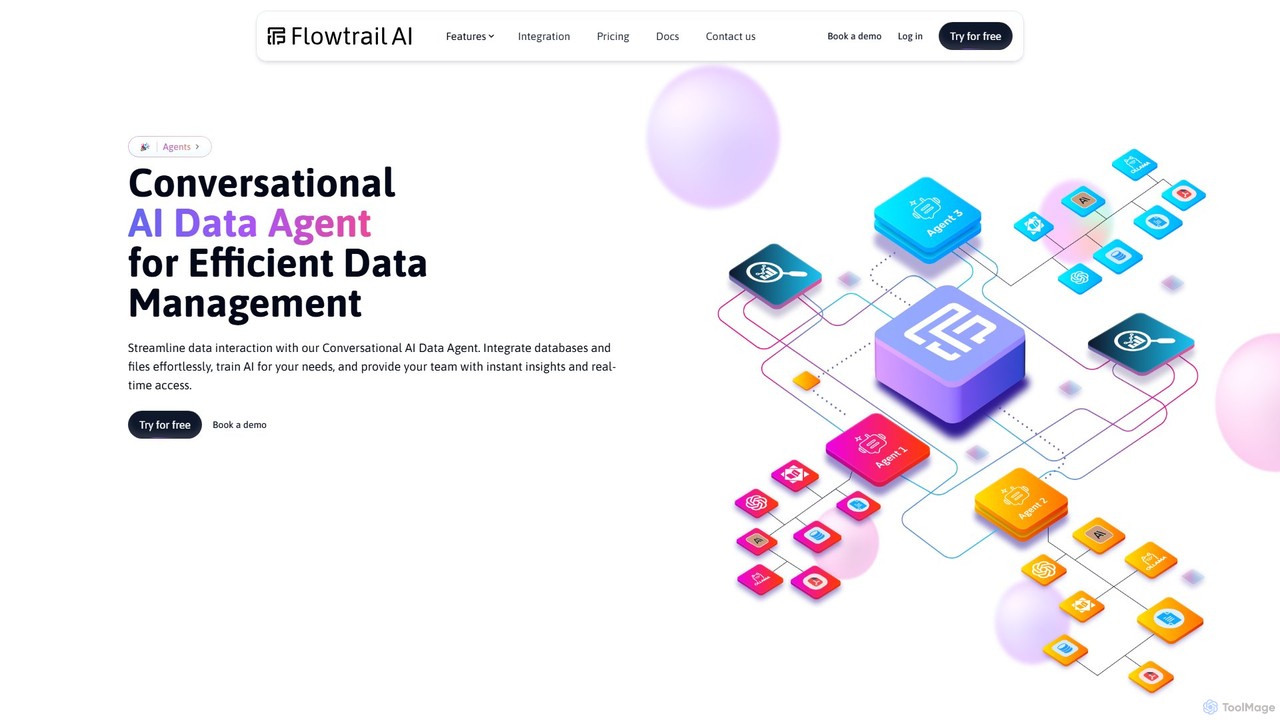
Flowtrail
Flowtrail is a conversational AI data agent that transforms how you interact with your data. Connect databases and files, ask questions in natural language, and receive instant insights, visualizations, and reports. It's a no-code platform designed to make data analysis accessible to everyone, from small businesses to large enterprises, fostering a data-driven culture.
Business Intelligence
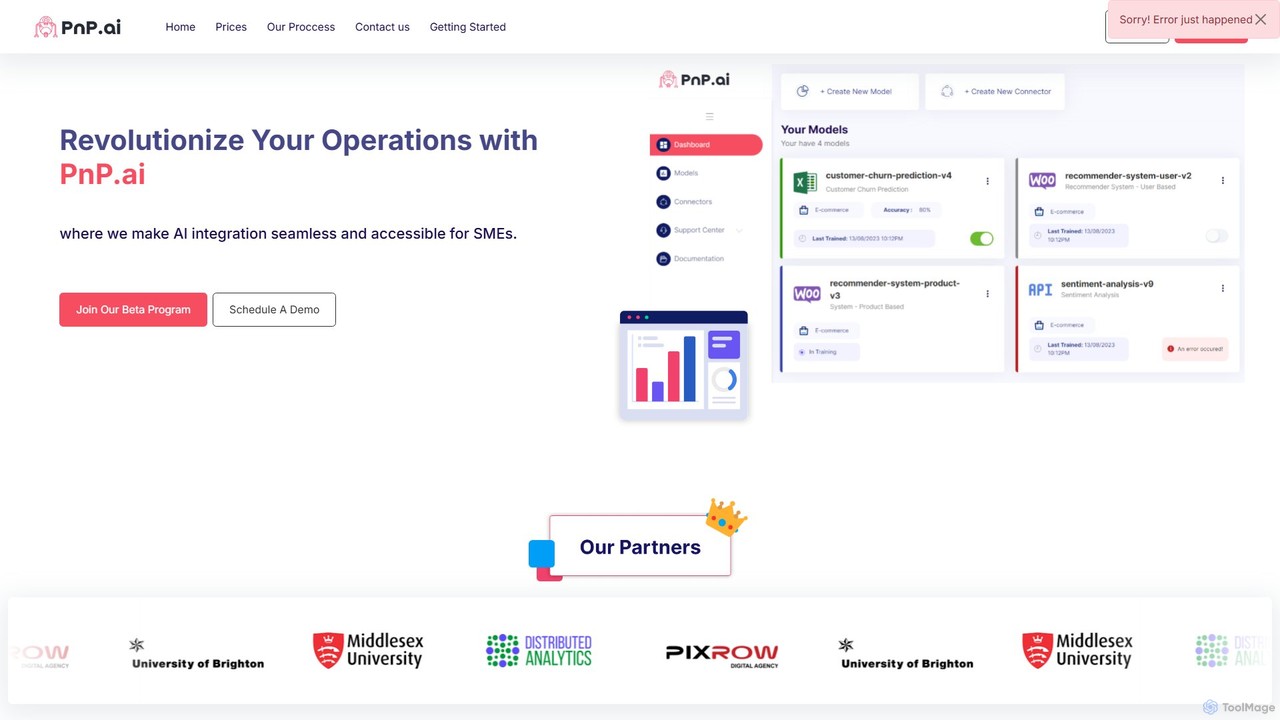
PnP.ai
PnP.ai is an advanced AI platform that enables businesses to transform their data into actionable insights. Upload CSV or PDF files and interact with your data through an intuitive chat interface, 'Data Guru Chat'. It offers customizable AI solutions, advanced data connectors, and robust security features, making it ideal for data analysis, business intelligence, and creating custom AI applications without extensive coding.
Business Intelligence
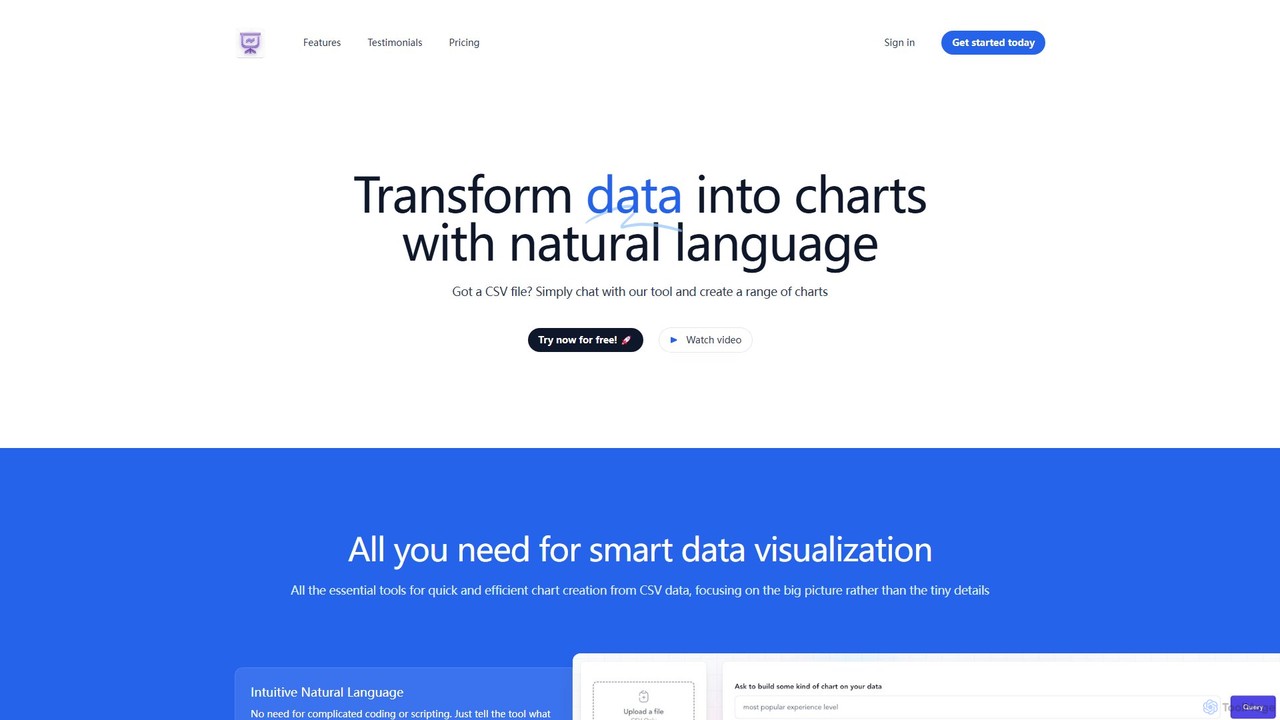
chat2csv
chat2csv is an AI-powered data visualization tool that transforms CSV files into various charts using simple, natural language commands. No coding is required. Just upload your data, chat with the AI, and instantly generate bar charts, pie charts, line graphs, and more. It's designed for quick, intuitive analysis while prioritizing user data privacy.
Business Intelligence
SheetBot
SheetBot is an AI-powered data analysis platform that enables users to analyze, visualize, and transform data without writing any code. Simply upload your dataset or connect a data source, ask questions in plain English, and receive instant insights, trends, and dynamic visualizations. Powered by advanced models like GPT-4o and Claude 3.5 Sonnet, it streamlines complex analyses, turning hours of work into minutes.
Business Intelligence
ANDRE
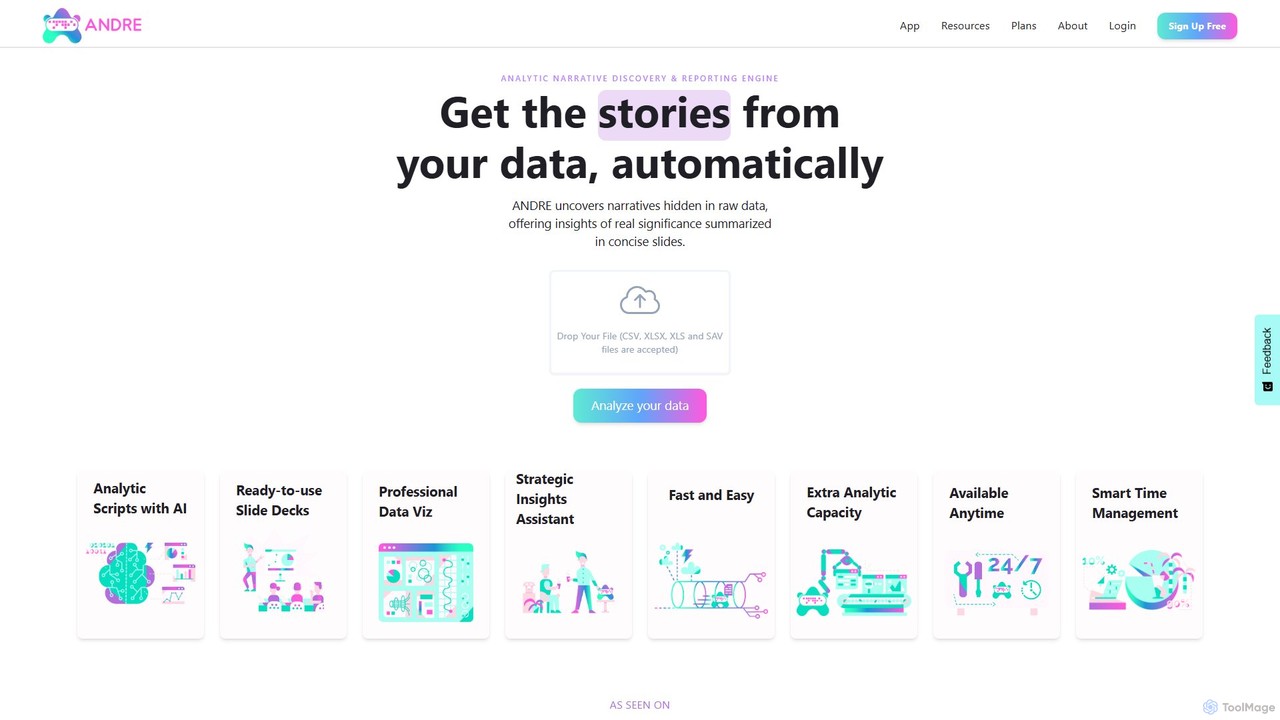
ANDRE is an AI-powered data analyst that transforms raw survey and business data into actionable insights and presentation-ready reports. It automates the process of discovering hidden narratives, generating data visualizations, and summarizing key conclusions. Designed for market researchers, CX managers, and business analysts, ANDRE significantly reduces analysis time, making expert-level data storytelling accessible to everyone.
Business Intelligence
ChatExcel
ChatExcel is an AI-powered data analysis tool that allows users to process spreadsheets and analyze data through a simple chat interface. It automates tasks like data cleaning, merging, and analysis, and generates over 100 types of charts and visualizations from natural language commands. No coding or complex formulas required, boosting productivity by up to 90%.
Business Intelligence
Grapha.ai
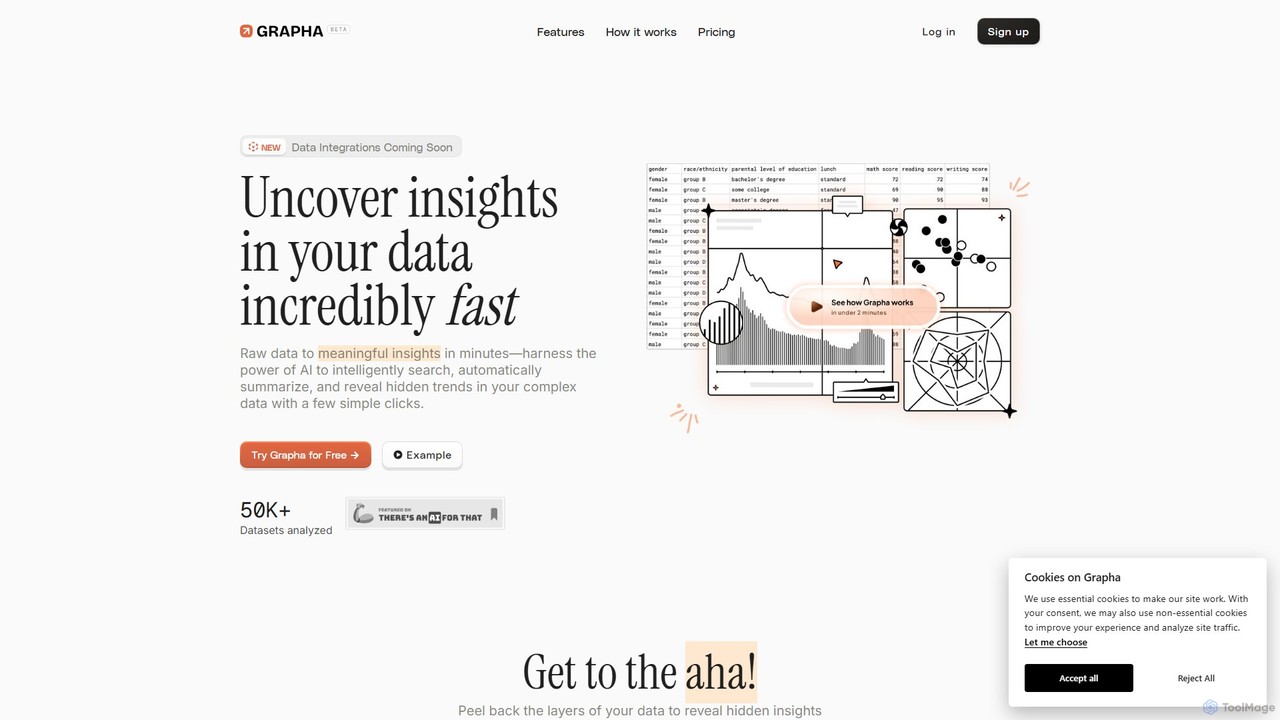
Grapha.ai is an AI-powered data exploration tool that transforms complex datasets into clear, actionable insights. Using a natural language copilot, users can search, summarize, and visualize data without any coding. It's designed for everyone, from business analysts to small business owners, to uncover hidden trends and make data-driven decisions in minutes.
Business Intelligence
BoostKPI
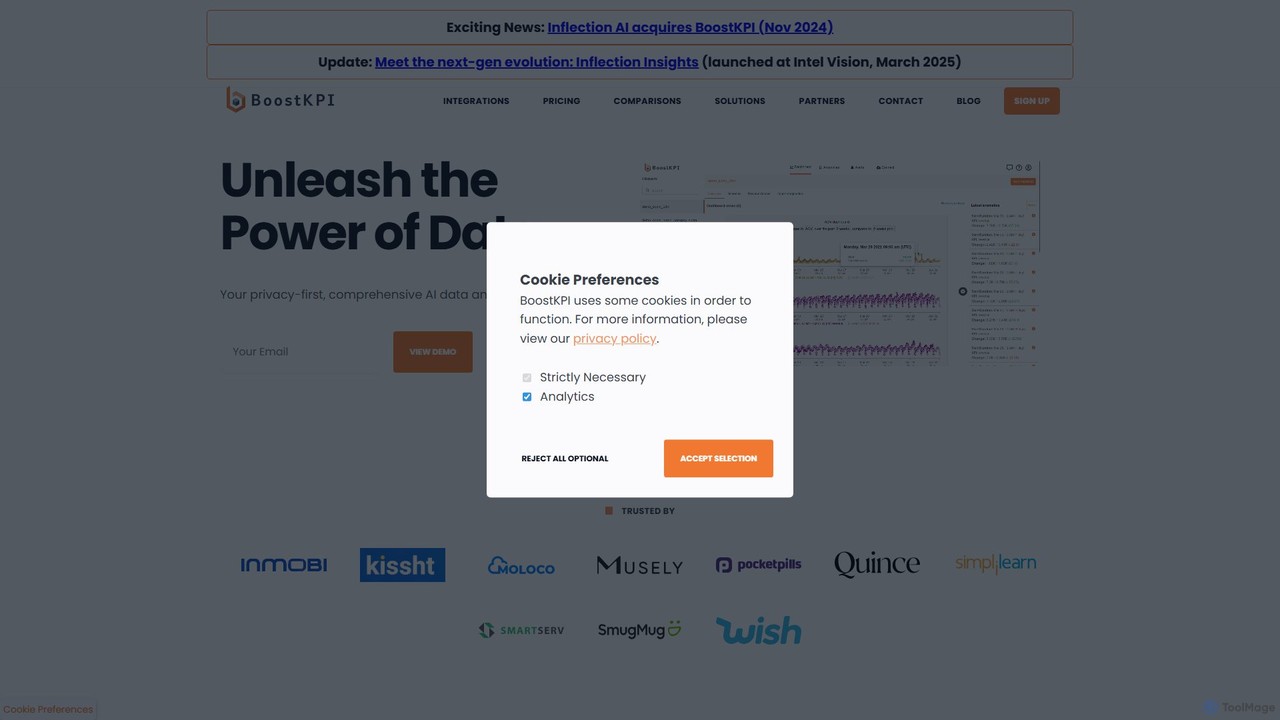
BoostKPI is a privacy-first AI data analyst platform, powered by its AI assistant, ADA. It automates anomaly detection, root cause analysis, and data visualization, enabling businesses to quickly uncover actionable insights from their data. By connecting to various data warehouses or accepting file uploads, BoostKPI transforms complex datasets into clear reports, heatmaps, and drill-down analyses, making data-driven decision-making faster and more accessible for teams of all sizes.
Business Intelligence
Tableau
Tableau is a leading AI-powered business intelligence and analytics platform that helps people see and understand data. It enables users to create interactive dashboards, perform complex data analysis, and share insights across their organization, enhanced by AI features like Tableau Agent for accelerated decision-making.
Business Intelligence
GraphMaker
GraphMaker is an AI-powered data visualization tool that allows you to create various charts and graphs in seconds. Simply upload your data from a CSV file or Google Sheets, and use natural language commands to generate insightful visualizations like bar charts, pie charts, and histograms. It's designed for speed, simplicity, and security, as it never stores your data.
Business Intelligence