

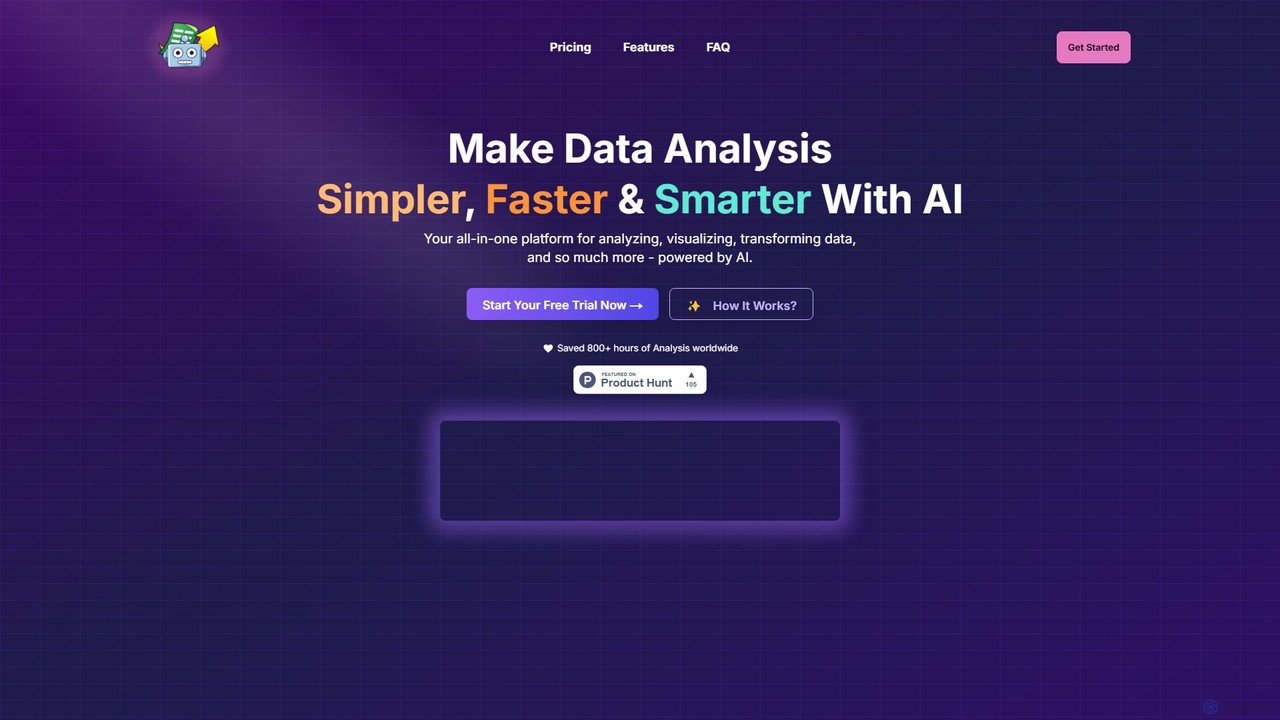
SheetBot Overview
SheetBot is a revolutionary AI-powered platform designed to make data analysis simpler, faster, and more intelligent for everyone, regardless of their technical expertise. It serves as an all-in-one solution for analyzing, visualizing, and transforming data, eliminating the need for complex coding or manual spreadsheet manipulation. By leveraging the power of advanced AI models like GPT-4o and Claude 3.5 Sonnet, SheetBot empowers users to uncover actionable insights from their data through simple, conversational language.
The platform is built to handle various data sources and formats, saving professionals hundreds of hours of repetitive work. Whether you're a business analyst, a marketer, or a researcher, SheetBot transforms the tedious process of data wrestling into an efficient and intuitive experience, allowing you to focus on making informed, data-driven decisions.
How to use SheetBot
Getting started with SheetBot is a straightforward, four-step process designed for maximum efficiency:
- Connect Your Data Source: Begin by uploading your data files directly. SheetBot supports a wide range of formats, including .csv and .json. Alternatively, you can connect directly to your databases like MongoDB or SQL, or link your Google Sheets account for seamless integration.
- Ask Questions in Plain English: Once your data is loaded, you can interact with it as if you were talking to a data analyst. Ask specific questions such as, "What are the top 10 suppliers by total value?" or "How does revenue vary across different product categories?"
- Receive AI-Powered Insights: The AI instantly processes your request, performs the necessary analysis, and provides clear, concise answers. It can conduct various types of analysis, including root cause analysis, statistical analysis, machine learning models, and scenario analysis, to uncover trends, patterns, and correlations.
- Visualize and Modify Results: SheetBot automatically generates dynamic and insightful charts and graphs to represent the findings. If you're not satisfied with the initial visualization, you can simply type a command to modify it in real-time, such as "Change this to a bar chart" or "Group the data by country."
Core Features of SheetBot
- AI-Powered Conversational Analysis: Interact with your data using natural language. No formulas or code required.
- Dynamic Visualizations: Automatically generate insightful and customizable charts and graphs to easily understand complex data.
- Multiple Data Source Connections: Upload files (.csv, .json) or connect directly to live data sources like MongoDB, SQL databases, and Google Sheets.
- Advanced AI Models: Utilizes the most powerful AI models, including GPT-4o and Claude 3.5 Sonnet, for the smartest and most accurate analysis.
- Diverse Analysis Types: Capable of performing a wide range of analyses, from basic statistical summaries to complex methods like ANOVA, root cause analysis, and machine learning scenarios.
- High-Performance Environment: Built with a high-RAM environment to efficiently process large datasets without performance issues.
- Robust Data Privacy and Security: Employs end-to-end encryption, sandboxed environments on Google Cloud Platform, and a strict data privacy policy. User data is never used for model training and is completely erased upon deletion.
Use Cases for SheetBot
SheetBot is versatile and can be applied across various domains:
- Business Intelligence: Quickly analyze sales data, track KPIs, and generate reports to make faster, more informed business decisions.
- Marketing Analysis: Understand customer behavior, segment audiences, and measure campaign performance by analyzing marketing data.
- Financial Analysis: Compare financial metrics, analyze expenses, and identify trends in revenue streams. For example, comparing customs duty, sales tax, and income tax amounts for different importers.
- Operations Management: Optimize supply chains by identifying top suppliers, analyzing inventory levels, and tracking distribution patterns.
- Academic Research: Simplify complex statistical analyses like ANOVA, allowing researchers to focus on interpretation rather than computation.
Advantages of SheetBot
SheetBot stands out by offering significant advantages:
- No-Code Accessibility: Empowers non-technical users to perform sophisticated data analysis without needing to learn programming languages like Python or SQL.
- Speed and Efficiency: Drastically reduces the time spent on data preparation, analysis, and visualization, turning hours or even days of work into minutes.
- Deeper Insights: The AI can identify hidden patterns and correlations that might be missed in manual analysis, leading to more profound discoveries.
- User-Friendly and Intuitive: The conversational interface and real-time modification capabilities make the platform incredibly easy to use.
- Secure and Private: With a strong commitment to data privacy, users can analyze sensitive information with confidence.
Pricing and Plans
SheetBot offers a simple and valuable pricing structure with a free trial to get started.
- Monthly Pass: $15 USD per month (regularly $25). This plan includes 1000 generations per month, unlimited modifications, access to the smartest AI models (GPT-4o, Claude 3.5 Sonnet), use of the high-RAM environment for larger datasets, and unlimited file uploads. You can cancel anytime.
- Yearly Deal (Popular): $9 USD per month, billed annually at $108 (regularly $20/month). This plan offers the best value and includes all the features of the Monthly Pass. You can cancel anytime.
Both plans come with a refund policy in the form of credit reimbursements for any issues encountered.
SheetBot Alternatives
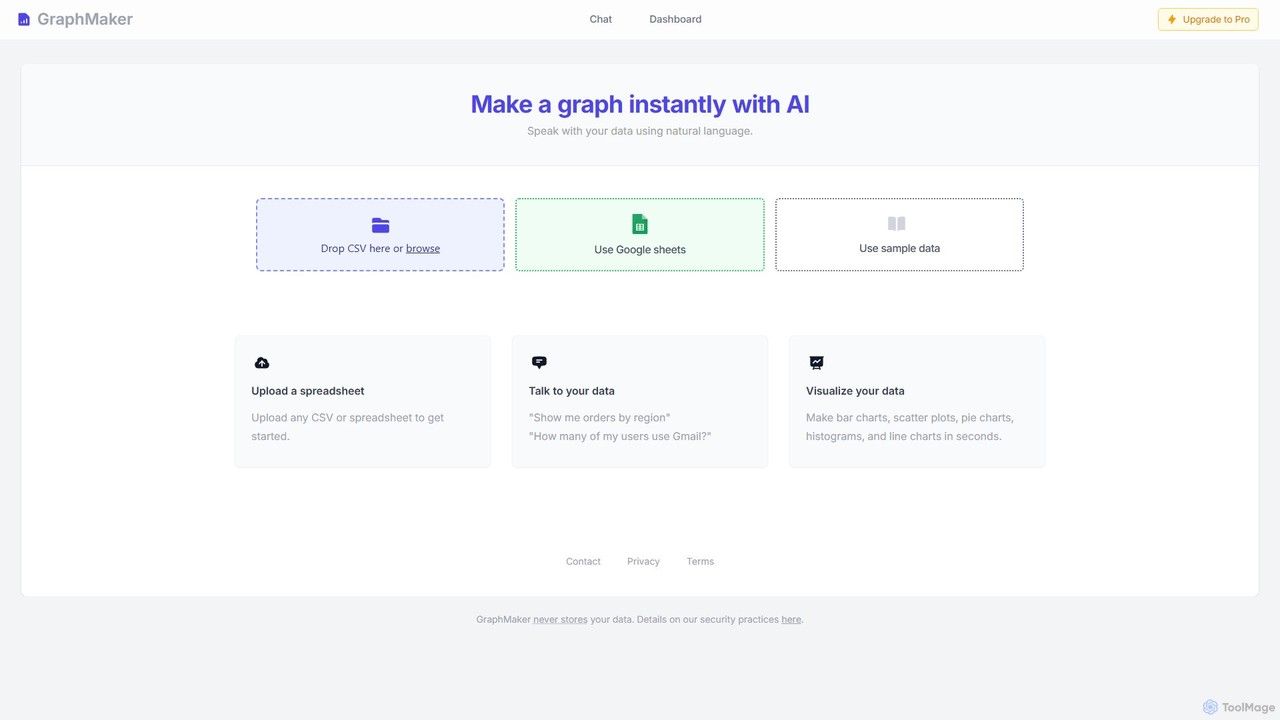
GraphMaker
GraphMaker is an AI-powered data visualization tool that allows you to create various charts and graphs in seconds. Simply upload your data from a CSV file or Google Sheets, and use natural language commands to generate insightful visualizations like bar charts, pie charts, and histograms. It's designed for speed, simplicity, and security, as it never stores your data.
Business Intelligence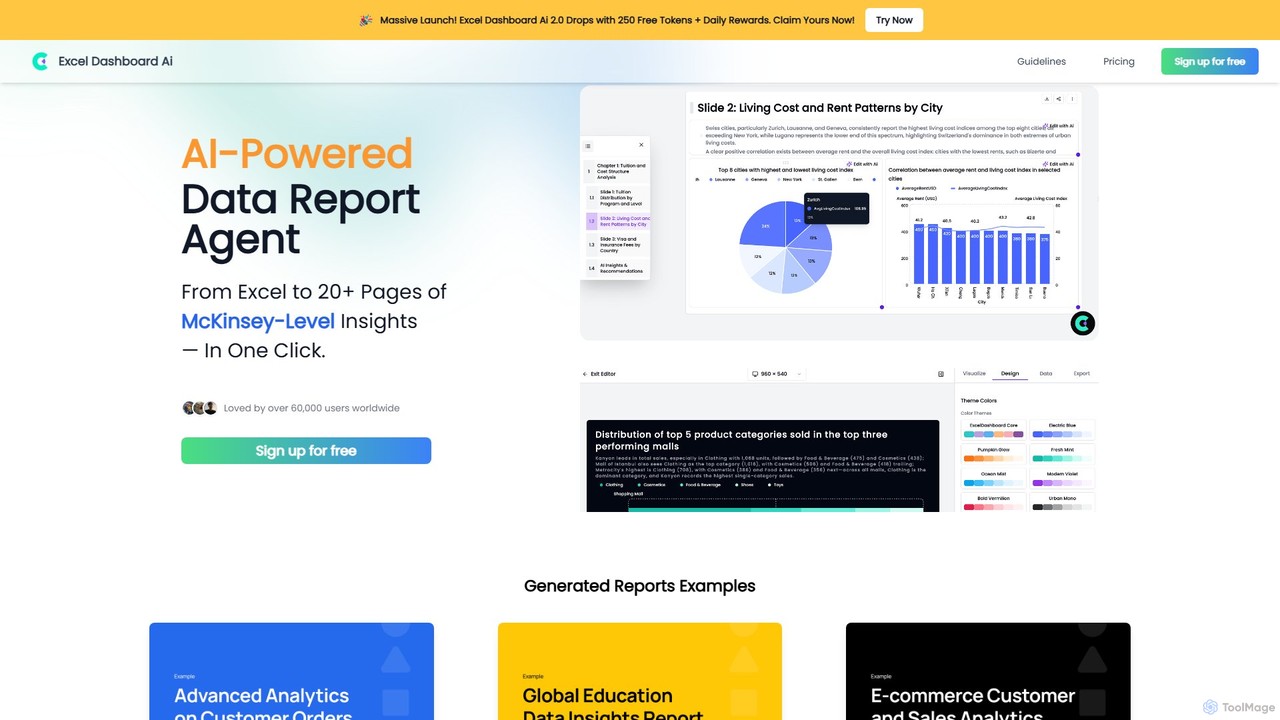
ExcelDashboard.ai
ExcelDashboard.ai is an AI-powered data analysis tool that instantly transforms raw Excel or CSV files into interactive dashboards and comprehensive, multi-page reports. With a single click, it generates deep, McKinsey-level insights, visualizes data, and allows users to explore information using natural language commands. It's designed for users of all skill levels to make data-driven decisions without needing programming expertise.
Business Intelligence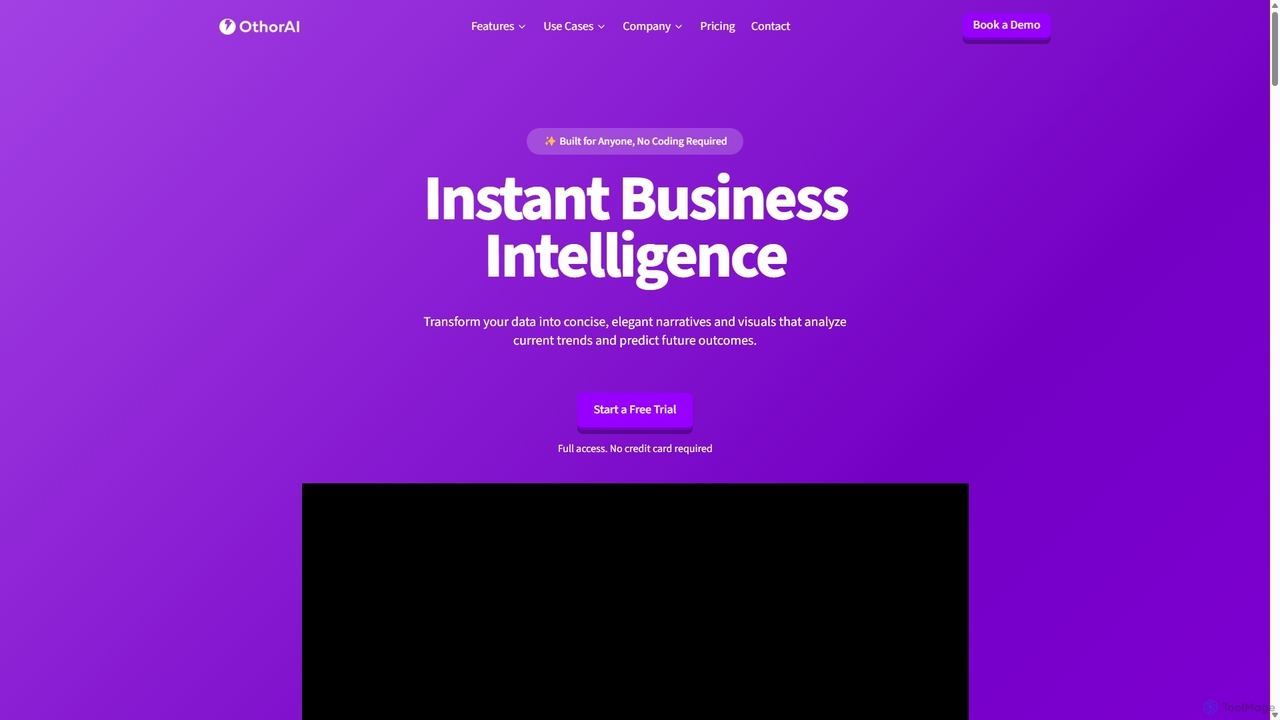
Othor AI
Othor AI is a no-code business intelligence platform that transforms your data into actionable insights in seconds. It automatically generates narrative-driven reports, smart charts, and predictive analytics, enabling anyone in your organization to make faster, data-driven decisions without technical expertise. Connect your data sources and get instant dashboards and executive summaries.
Business Intelligence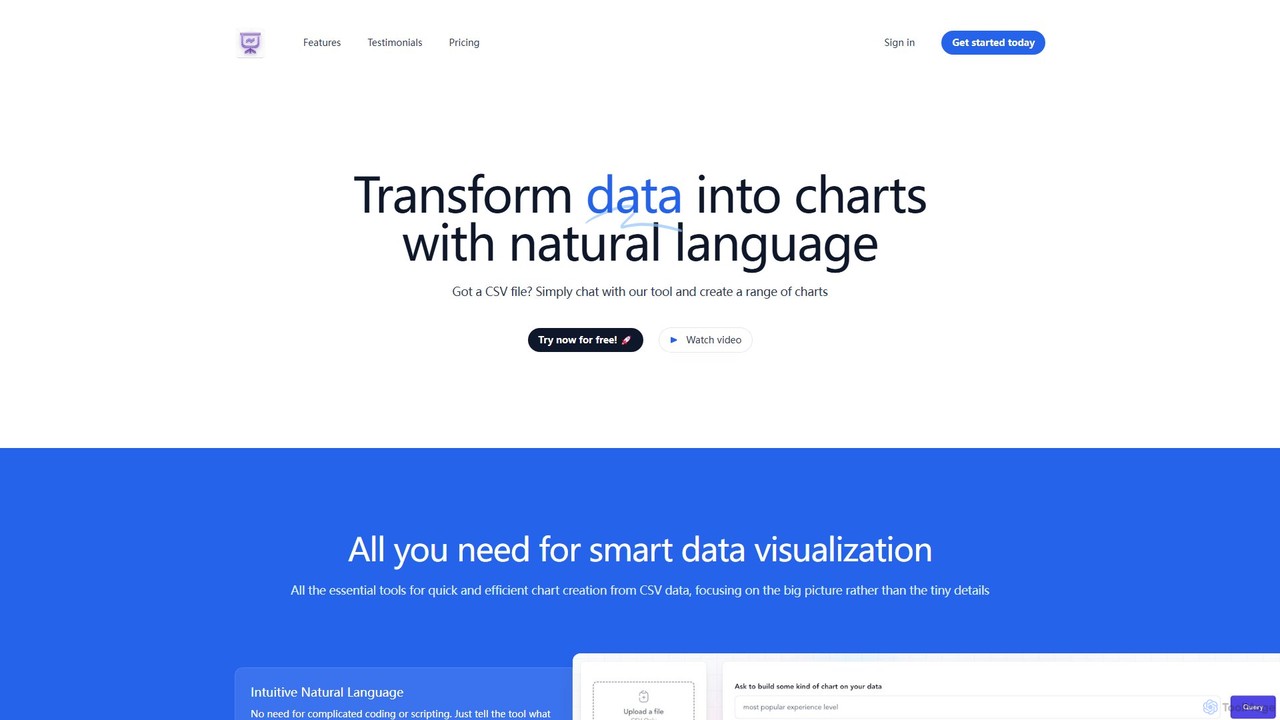
chat2csv
chat2csv is an AI-powered data visualization tool that transforms CSV files into various charts using simple, natural language commands. No coding is required. Just upload your data, chat with the AI, and instantly generate bar charts, pie charts, line graphs, and more. It's designed for quick, intuitive analysis while prioritizing user data privacy.
Business Intelligence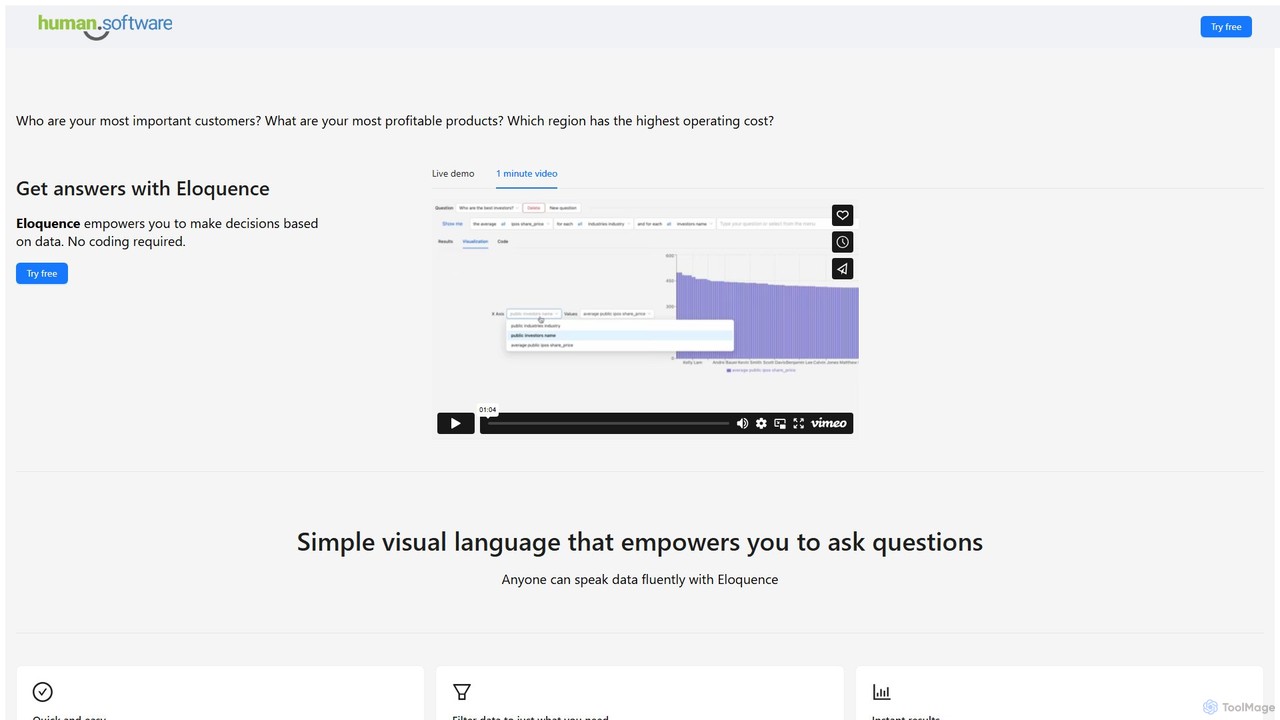
Eloquence
Eloquence is a no-code business intelligence platform that empowers anyone to query databases using structured natural language. Connect your data, ask complex questions without writing code, and get instant answers to make data-driven decisions. It prioritizes security with robust encryption and a strict no-data-saved policy.
Business IntelligenceSheetBot Categories
SheetBot Embed Widget
Copy this embed code to place the badge on your blog, article, or product site and send readers directly to this ToolMage detail page.

Related AI tools
gptagent
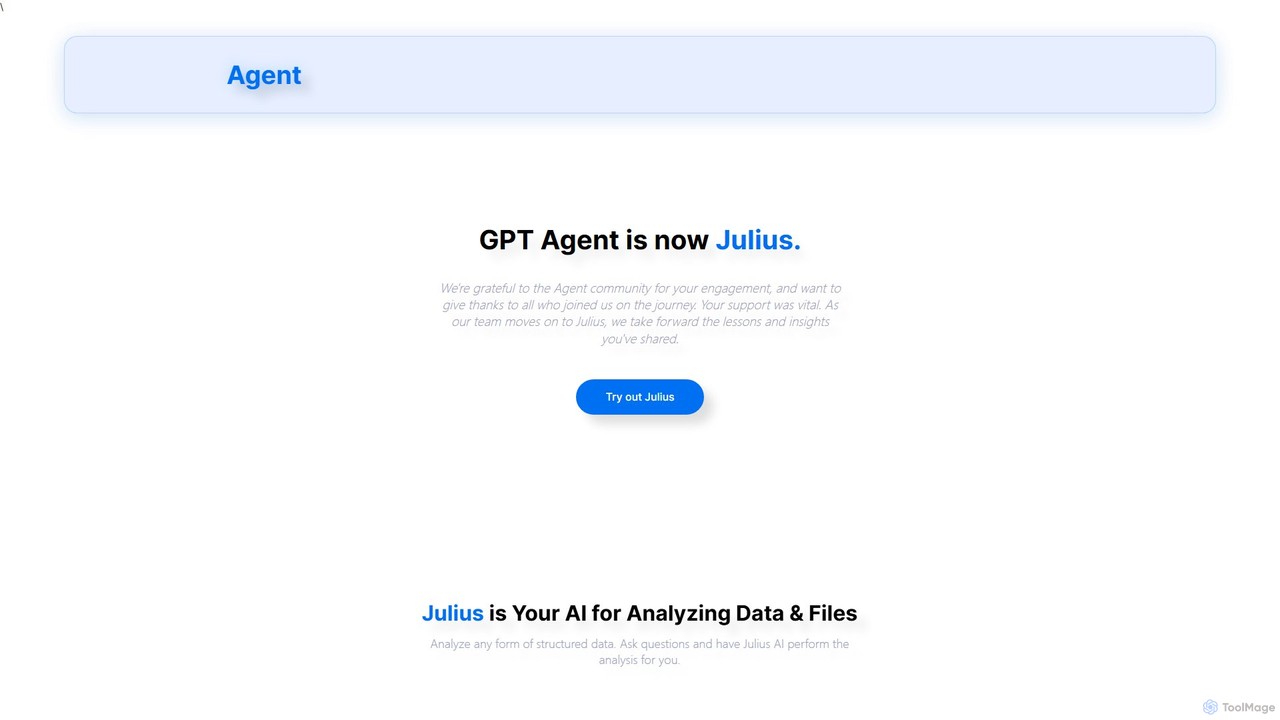
gptagent has rebranded to Julius, an AI data analyst that allows you to analyze data and files using natural language. Upload structured data, ask questions, and instantly generate visualizations, perform statistical analysis, and build models without writing any code. It transforms complex data tasks into simple conversations.
Business Intelligence
Fabi.ai
Fabi.ai is an AI-powered business intelligence and data analysis platform designed for lean teams. It integrates SQL, Python, and AI to help users build dashboards, automate workflows, and explore data 10x faster. The platform offers an all-in-one collaborative environment, reducing context switching and enabling both technical and non-technical users to derive insights from their data sources like data warehouses, Google Sheets, and more.
Business Intelligence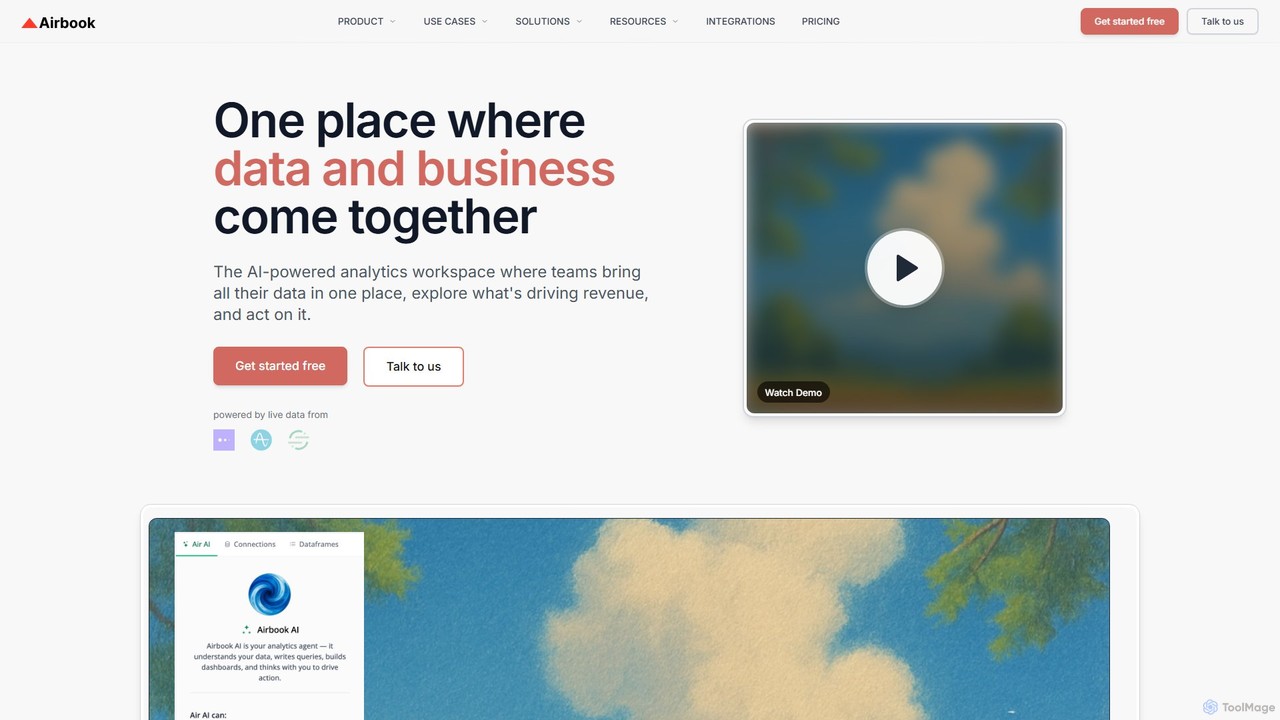
Airbook
Airbook is an AI-powered Go-to-Market (GTM) data platform that unifies data from CRM, marketing, finance, and product tools into a single collaborative workspace. It enables teams to analyze data using natural language, SQL, or a no-code builder, create dashboards, and activate insights to drive revenue growth.
Business Intelligence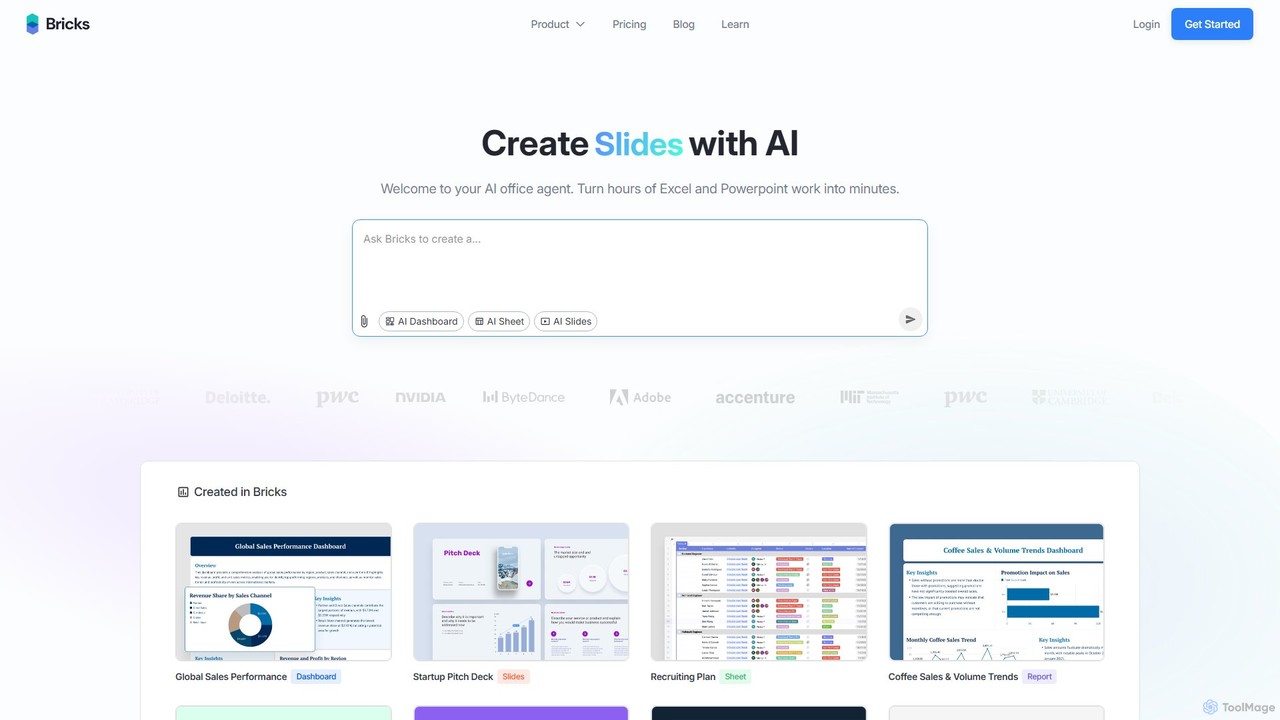
thebricks
thebricks is an AI-powered workspace that transforms data analysis and reporting. It allows users to create interactive dashboards, dynamic spreadsheets, and professional slides using simple natural language prompts. Turn hours of manual work in Excel and PowerPoint into minutes, streamlining your workflow and boosting productivity.
Business Intelligence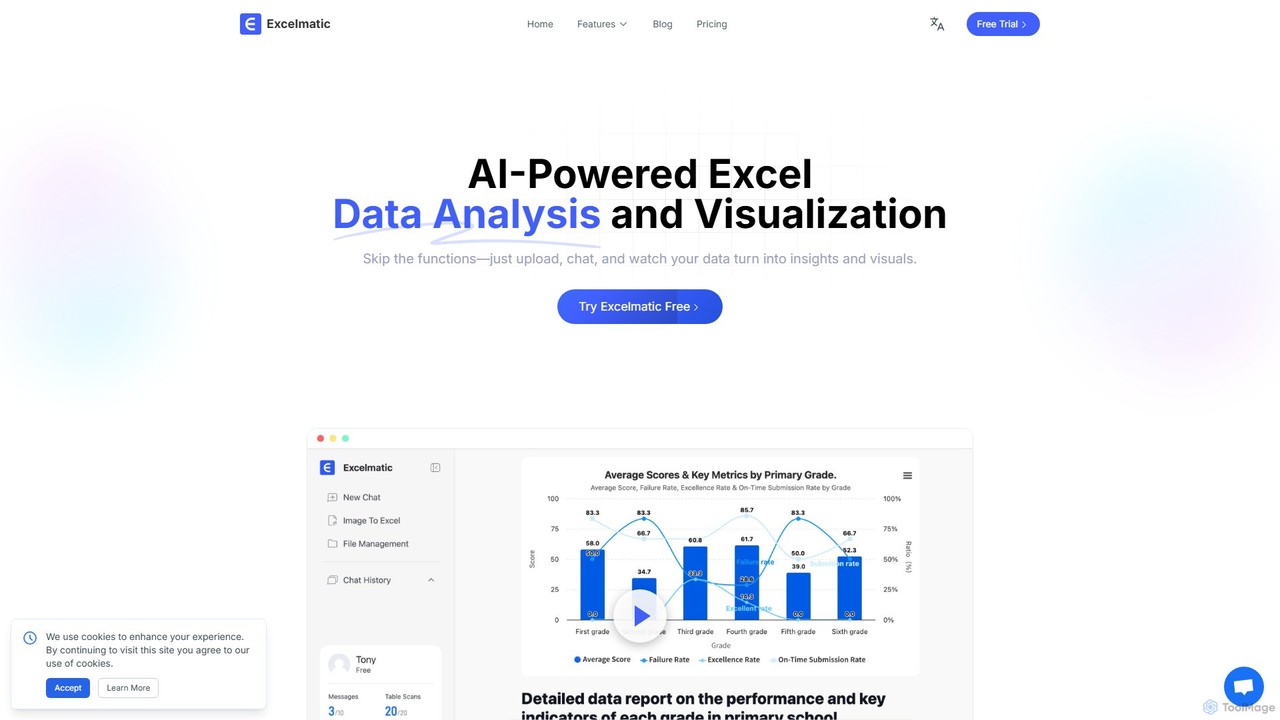
excelmatic
Excelmatic is an AI-powered assistant that transforms your Excel and spreadsheet tasks. Simply upload your data, ask questions in plain English, and instantly get data analysis, visualizations, and generated formulas. It's a no-code solution designed to automate data cleaning, chart creation, and insight discovery, making data accessible to everyone.
Business Intelligence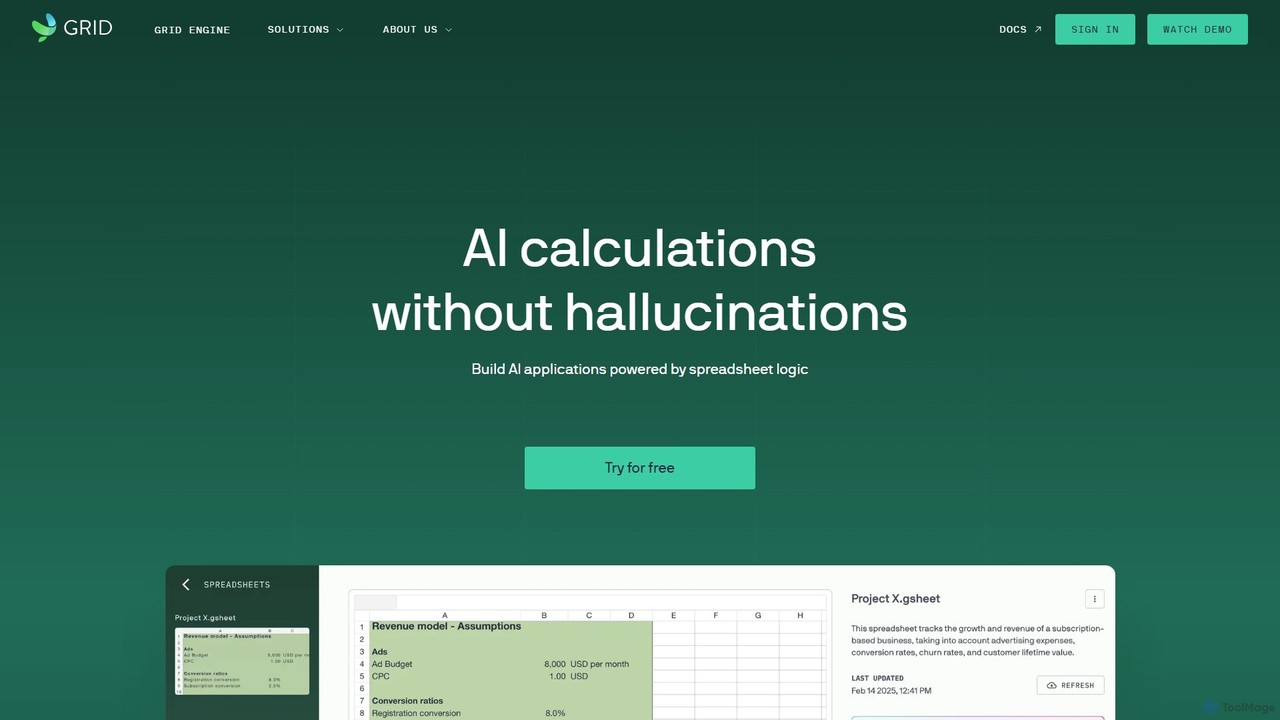
GRID
GRID is an AI-first platform that transforms your existing spreadsheets into powerful, interactive web applications and AI-driven tools. It leverages the logic and data within your Excel and Google Sheets files to build reliable calculators, dashboards, and models that can be queried using natural language, eliminating AI hallucinations.
Business Intelligence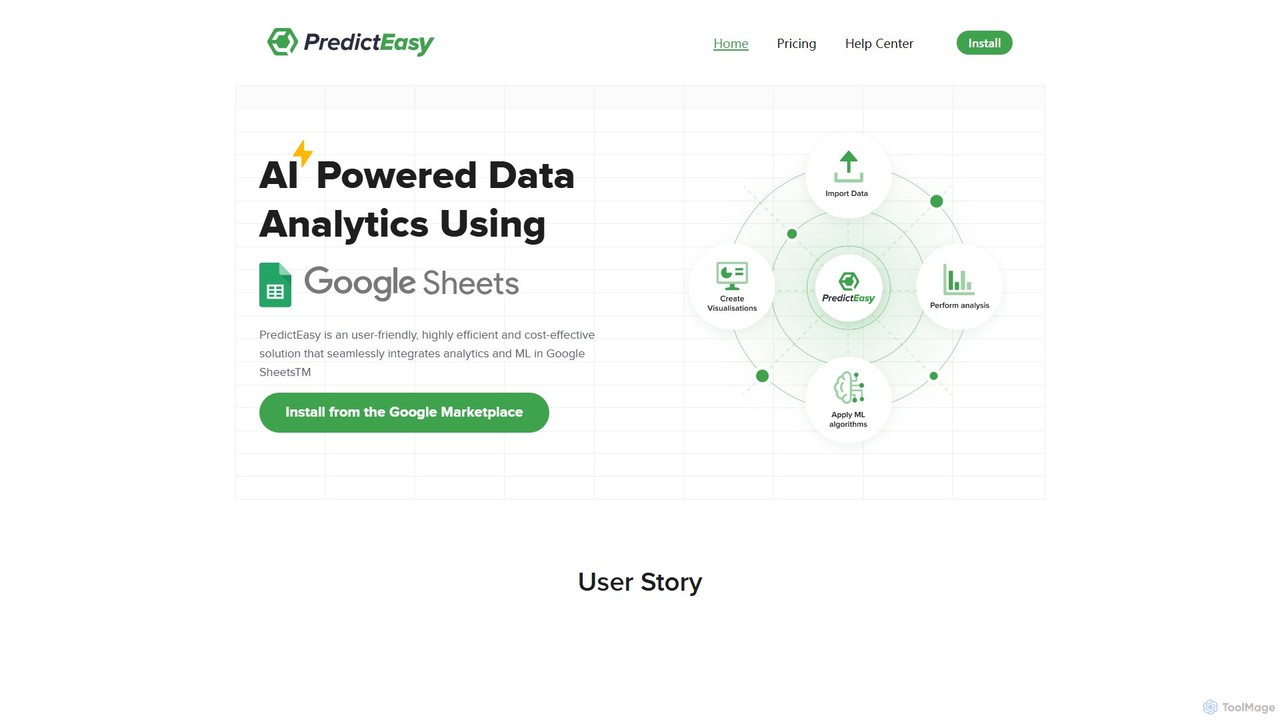
PredictEasy
PredictEasy is a powerful no-code AI add-on for Google Sheets that democratizes data analytics. It allows users to perform advanced tasks like predictive modeling, time-series forecasting, NLP, and statistical analysis with just a few clicks. Ideal for business professionals, researchers, and data analysts, it transforms your spreadsheet into a sophisticated data science tool, enabling data-driven decisions without writing any code.
Business Intelligence
Sourcetable
Sourcetable is an AI-powered spreadsheet that combines the functionality of traditional spreadsheets with an AI data analyst. It allows users to connect to live data sources, ask questions in plain English, generate formulas, create charts, and automate reports. By integrating AI, Python, and SQL capabilities directly into the spreadsheet interface, Sourcetable empowers users of all skill levels to perform complex data analysis, cleaning, and visualization tasks effortlessly, turning raw data into actionable insights in seconds.
No Code
table.studio
table.studio is an AI-powered data workspace that combines the simplicity of a spreadsheet with the power of a database and AI. Use natural language to query, analyze, and visualize your data, automating tedious tasks and uncovering insights instantly. It's designed for teams to collaborate on data projects in real-time.
Database Management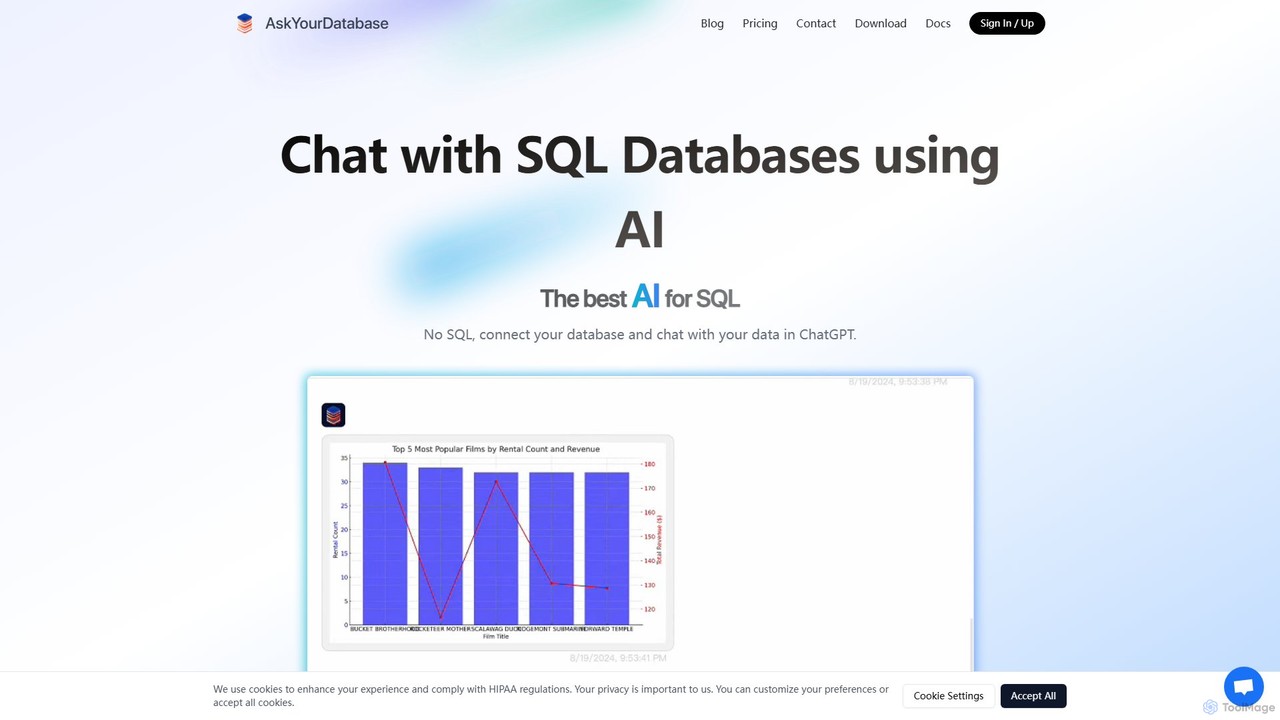
AskYourDatabase
AskYourDatabase is a powerful AI SQL assistant that allows you to interact with your databases using natural language. Query data, create visualizations, and build interactive dashboards without writing a single line of SQL. It supports various databases, offers both desktop and embeddable chatbot versions, and prioritizes data security with on-premise deployment options.
Data Analysis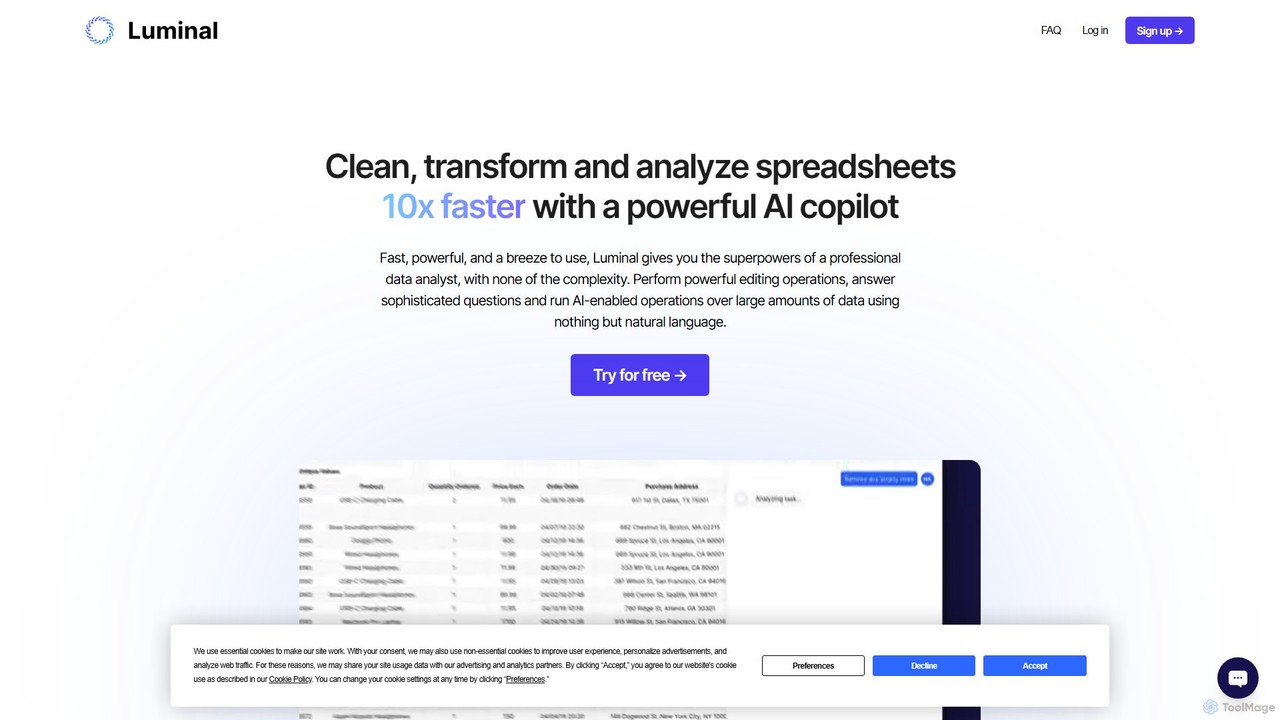
Luminal
Luminal is a powerful AI copilot that revolutionizes spreadsheet management. It allows users to clean, transform, analyze, and visualize data up to 10x faster using simple, natural language commands. Eliminate complex formulas and manual data processing, saving hours of work on large datasets.
Data Management
camelAI
camelAI is an AI-powered data analysis platform that enables users to query their databases using natural language. It eliminates the need for SQL, providing instant answers with interactive charts and tables, making data-driven decision-making accessible to everyone in an organization.
Business Intelligence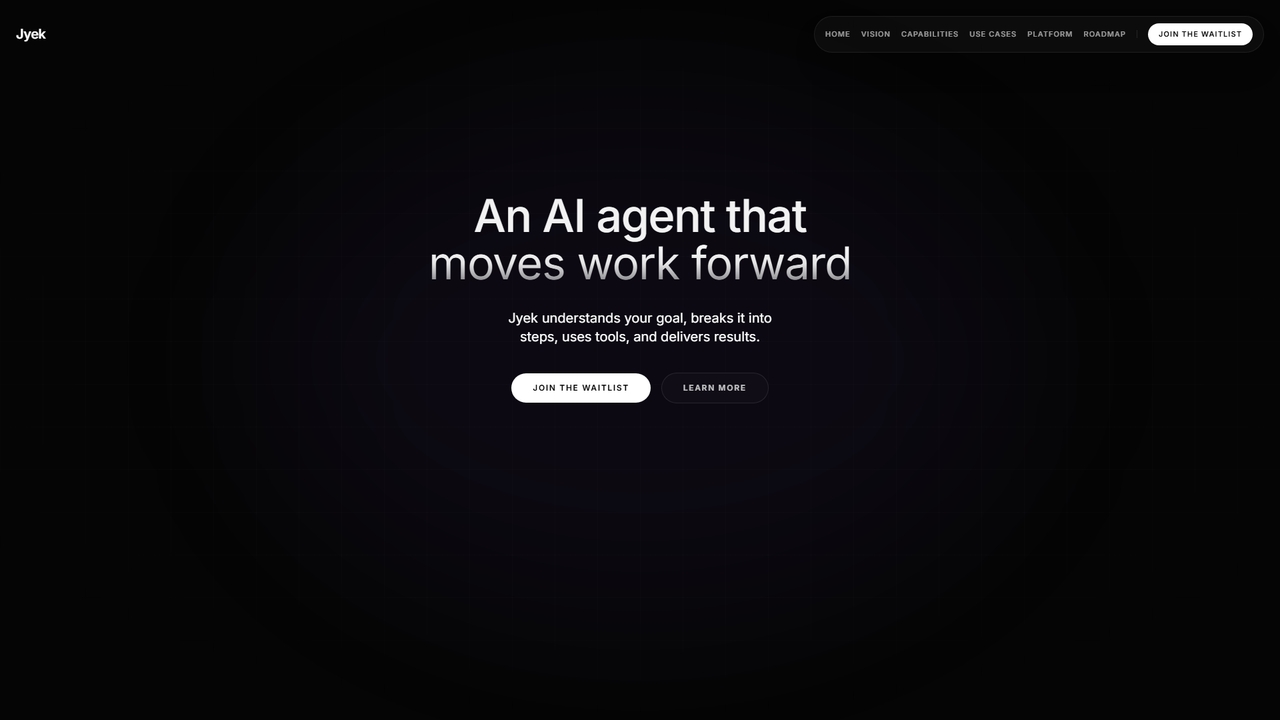
Jyek
Jyek is an AI agent platform that understands objectives, creates execution plans, uses tools, and delivers verifiable results for complex, multi-step tasks.
Automation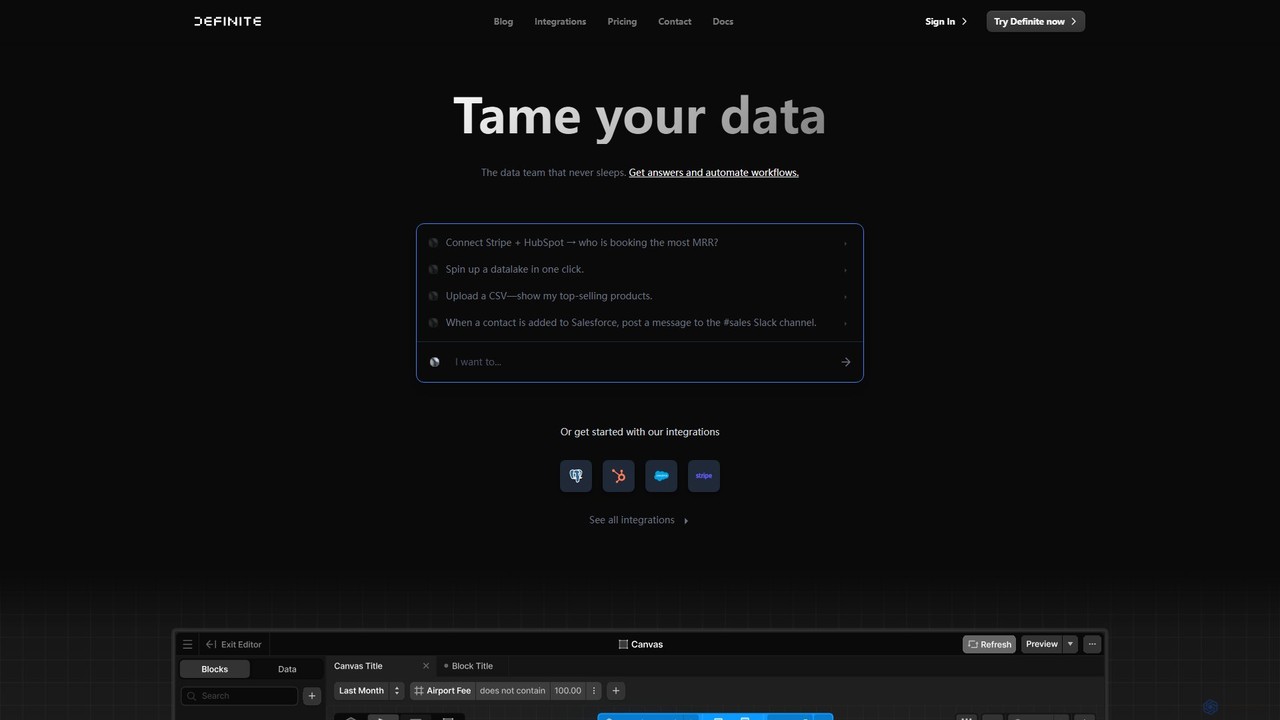
Definite
Definite is an AI-powered, all-in-one data analytics platform that combines data integration, warehousing, and business intelligence. It enables teams to connect hundreds of data sources, ask questions in plain English, and build dashboards without engineering support, turning scattered data into actionable insights in minutes.
Business Intelligence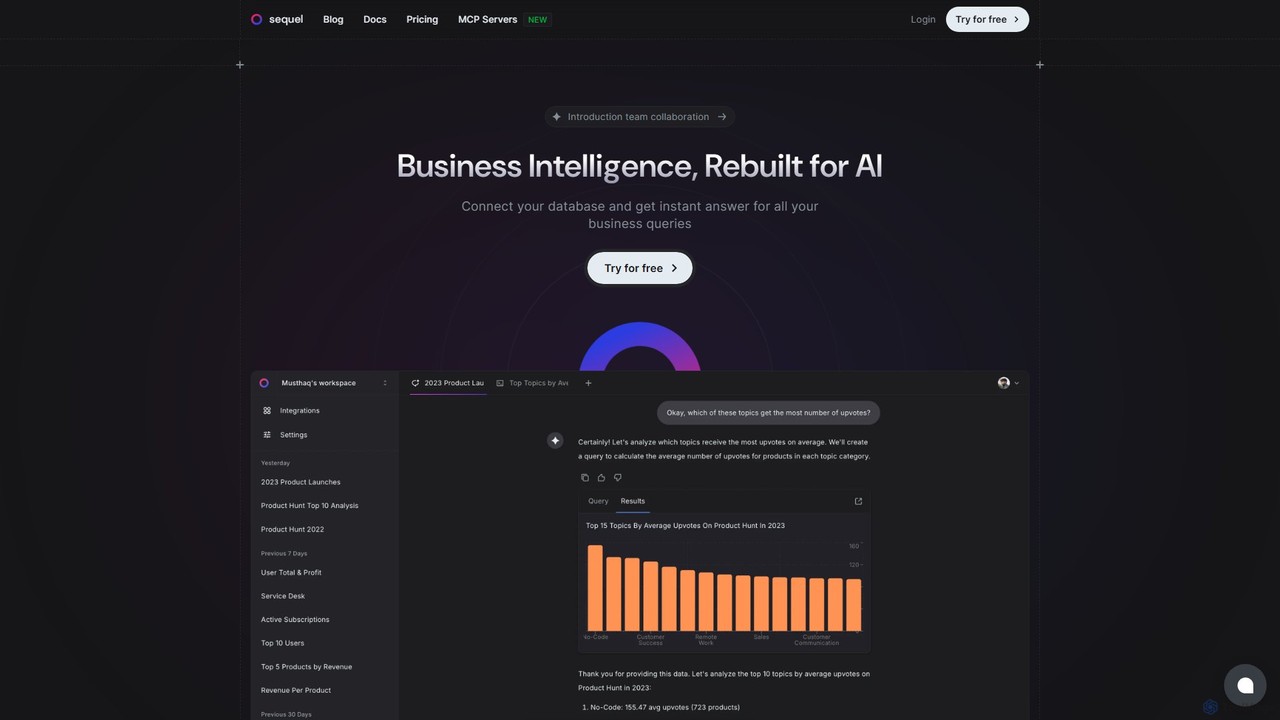
Sequel
Sequel is an AI-powered Business Intelligence platform that allows you to interact with your databases using natural language. Connect your data, ask questions in plain English, and instantly receive reports, visualizations, and insights without writing a single line of SQL.
Business Intelligence
SheetBot Comments (0)
Sign in to comment.
Sign inNo comments yet.