
ToolMage
Sign in

AI TOOL COMPARISON

Hex vs pandalyst

What is the difference, and which fits your workflow? Compare features, usage, pricing models and traffic side by side.

Jump to key differences

Product overview

Hex Product overview

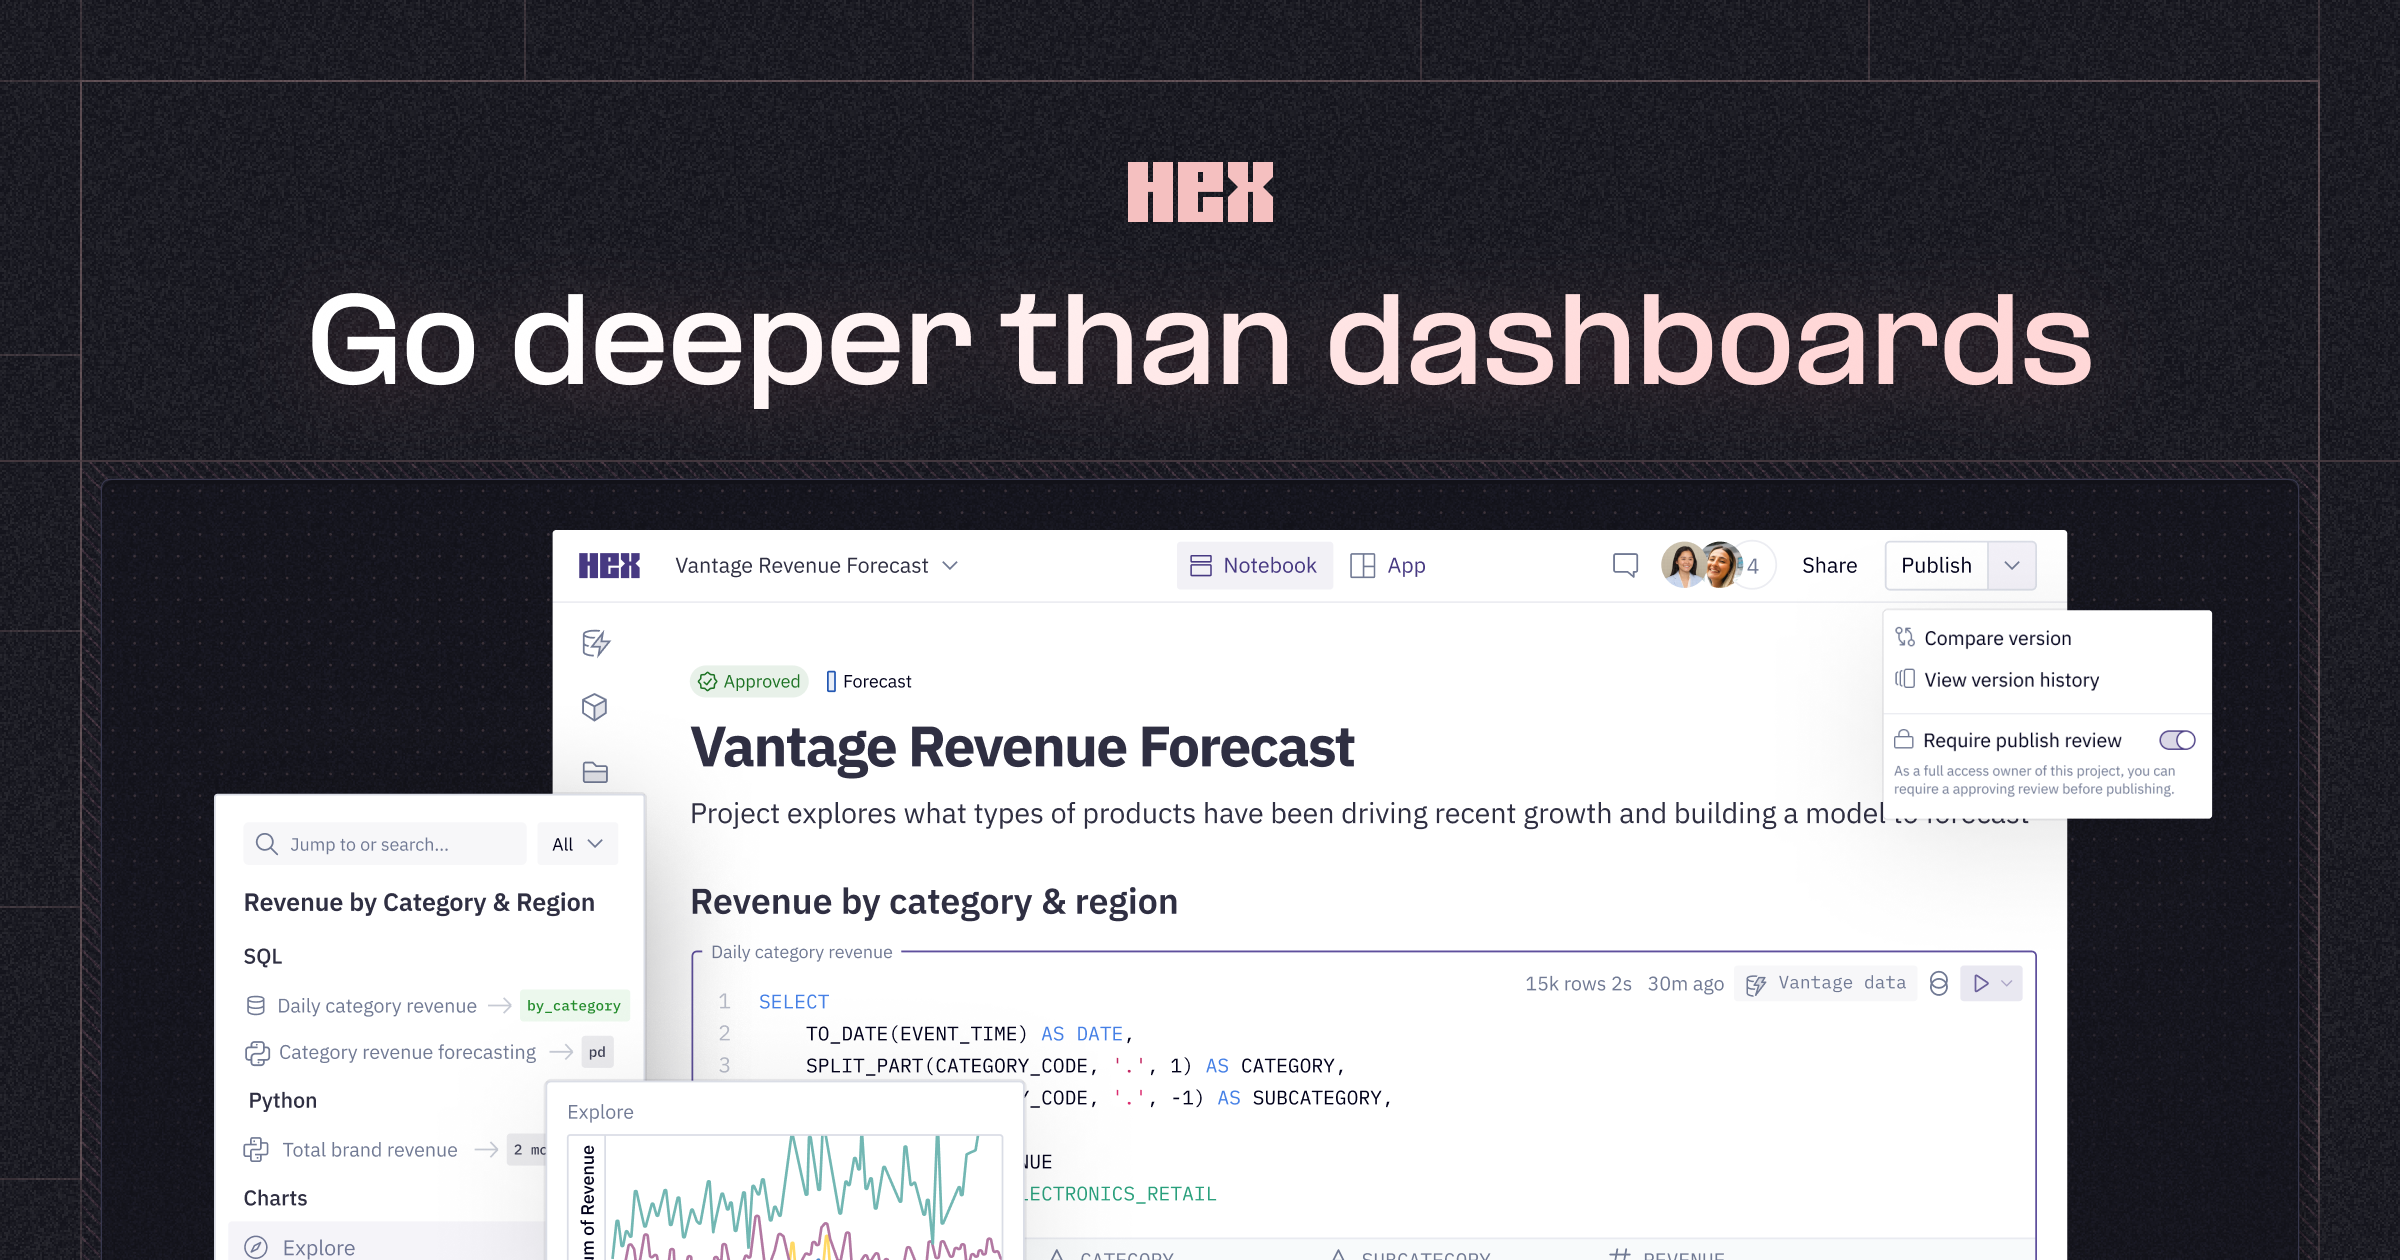
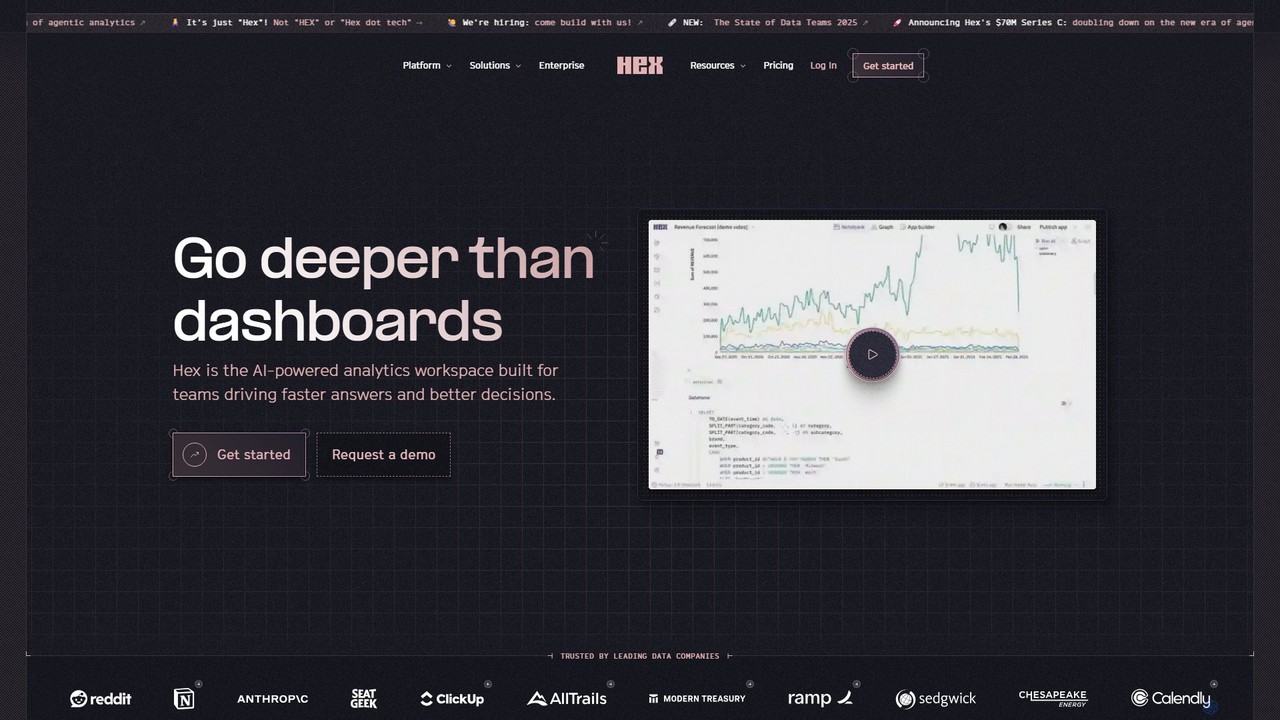
Hex is an AI-powered analytics workspace designed for teams. It integrates notebooks for Python and SQL, interactive data apps, and self-serve exploration into a single collaborative platform, enabling faster, data-driven decision-making.

Preview

pandalyst Product overview

Pandalyst is an AI-powered data analysis platform that transforms how you interact with data. Ask questions in natural language and receive instant visualizations, insights, and reports. It automates complex data tasks, making business intelligence accessible to everyone, from analysts to business leaders, without writing a single line of code.

Preview

Quick facts

Compare product focus, pricing models and audiences. Highlighted rows indicate different listed information; unknown pricing does not mean free.

Hex VS pandalyst — Quick facts
Quick factsHexpandalyst
Pricing modelFreemiumFreemium
Product typeWebWeb
Primary focusData ScienceLow Code No Code
Audience and rolesNo data availableNo data available
CategoriesData Science · Low Code No Code · CollaborationLow Code No Code · Analytics · Automation
AddedAug 11, 2025Aug 8, 2025
UpdatedNov 19, 2026Nov 19, 2026

Features, usage and use cases

Explore the listed product descriptions, features and workflows. Taxonomy labels alone are not feature evaluations.

Hex

Hex is a comprehensive, AI-powered analytics workspace built for teams to drive faster answers and better decisions. It provides a unified platform that goes beyond traditional dashboards, integrating deep-dive analysis, interactive data applications, and self-service exploration. Hex is trusted by leading data companies like Notion, ClickUp, and StubHub to foster a data-driven culture where anyone, regardless of technical proficiency, can comfortably use data to answer their own questions.

The platform's core is a collaborative notebook environment where Python, SQL, and no-code elements coexist harmoniously. This eliminates the need to switch between different tools for querying, transforming, predicting, and visualizing data. With its integrated AI assistant, users can get intelligent help anywhere in their workflow, from generating code with a simple prompt to creating charts and explaining complex logic.

How to use Hex

Using Hex involves a streamlined workflow designed for both data professionals and business users. First, you connect Hex to your data sources, with built-in connections for popular data warehouses like Snowflake, BigQuery, and databases. Once connected, you can begin your analysis in a Hex notebook. You can write SQL queries to fetch data, use Python for advanced analysis and machine learning, or leverage no-code cells with point-and-click tools to filter and pivot data. The platform's AI assistant can be prompted in natural language to generate queries, write code, or build visualizations. As you work, you can collaborate with teammates in real-time through multiplayer editing and comments. Once your analysis is complete, you can transform it into a polished, interactive data app using a drag-and-drop builder. These apps can be shared with stakeholders, who can then explore the data, adjust parameters, and even write data back to your database, turning insights directly into action.

Core Features of Hex

  • AI-Powered Notebooks: A multiplayer notebook environment that seamlessly integrates Python, SQL, and no-code cells, allowing for flexible and powerful analysis.
  • Magical AI: A conversational AI interface that assists with generating code, creating charts, answering questions, and debugging, all through natural language prompts.
  • Interactive Data Apps: Build and publish beautiful, interactive data applications from your analyses using a drag-and-drop interface, enabling stakeholders to explore insights on their own.
  • Self-Serve Exploration: An intuitive, point-and-click experience for business users to explore governed data and semantic models without writing any code.
  • Real-time Collaboration: Features like multiplayer editing, commenting, and version control make data analysis a team sport.
  • Seamless Integrations: Native connections to popular data warehouses (Snowflake, etc.), dbt for semantic models, Git for version control (GitHub/GitLab), and orchestration tools like Airflow.
  • Reusable Components: Save and reuse logic, charts, and groups of cells across different projects to scale your work efficiently.
  • Enterprise-Grade Security: SOC 2 and HIPAA compliant, offering flexible deployment models (multi-tenant, single-tenant, private cloud) and robust security features.

Use Cases for Hex

Hex is versatile and supports a wide range of analytics needs. For example, ClickUp used Hex to operationalize a data science churn model, turning it into a cross-functional program that saved millions in customer churn. Notion leverages Hex to empower everyone in the company, from data science to sales, to make decisions with data. Other common use cases include:

  • Exploratory Analysis: Performing deep dives and ad-hoc explorations to uncover novel insights.
  • Business Intelligence & Reporting: Creating and sharing dynamic KPI dashboards to monitor sales performance, customer satisfaction, and operational efficiency.
  • Data Modeling: Transforming raw data into analysis-ready datasets for predictive models or company-wide reporting.
  • Advanced Data Science: Implementing complex techniques like sentiment analysis, time series forecasting, and data clustering within the platform.

Advantages of Hex

The primary advantage of Hex is its ability to unify the entire analytics workflow in one place. This eliminates tool-hopping and increases efficiency. Its AI-powered features significantly accelerate productivity for data teams. By providing both code-based and no-code interfaces, Hex democratizes data access, enabling both technical and non-technical users to collaborate effectively. This breaks down silos and fosters a stronger data culture. Finally, by allowing users to build interactive apps instead of static reports, Hex makes insights more actionable and shortens the feedback loop between analysis and decision-making.

Pricing and Plans

Hex offers several plans to fit different needs:

  • Community: A free plan designed for individuals to explore data and showcase their work. It includes unlimited queries and up to 5 projects.
  • Professional: Priced at $36 per Editor/month, this plan is for practitioners and small teams. It offers unlimited projects, unlimited AI actions, and 30-day version history.
  • Team: At $75 per Editor/month, this plan is built for scaling data collaboration and governance. It adds features like visual exploration for data apps, review workflows, user groups, and key integrations. A 14-day free trial is available.
  • Enterprise: This plan offers custom pricing for organizations requiring advanced security (SSO, HIPAA), dedicated support, custom deployment options, and embedded analytics.
Hex also offers pay-as-you-go compute profiles for advanced data science use cases on paid plans.

pandalyst

Pandalyst is a cutting-edge, AI-driven data analysis and business intelligence platform designed to democratize data insights. It empowers users to converse with their data using simple, natural language queries. By eliminating the need for complex coding skills in languages like Python or SQL for routine analysis, Pandalyst bridges the gap between raw data and actionable intelligence. This makes it an indispensable tool for modern teams who need to make data-driven decisions quickly and efficiently. The platform is built to handle the entire analysis workflow, from data connection and cleaning to visualization and reporting, all within an intuitive, user-friendly interface.

How to use pandalyst

Using Pandalyst is a straightforward, three-step process designed for maximum efficiency:

  1. Connect Your Data: Start by securely connecting your data sources. Pandalyst supports a wide range of integrations, including uploading files like CSV and Excel, or connecting directly to databases (e.g., PostgreSQL, MySQL) and cloud services (e.g., Google Sheets, AWS S3).
  2. Ask Questions in Natural Language: Once your data is connected, simply type your questions into the search bar as if you were talking to a human analyst. For example, you could ask, "Show me the monthly revenue trend for the last year," or "Which marketing channel had the highest conversion rate in Q3?"
  3. Receive Instant Insights and Visualizations: The AI engine instantly processes your request, performs the necessary analysis, and presents the findings in the most appropriate format. This can be a chart, a graph, a table, or a textual summary. You can then ask follow-up questions to drill down further, refine the analysis, or export the results to share with your team.

Core Features of pandalyst

  • Natural Language Querying (NLQ): The core of the platform. Translate plain English questions into complex data queries and analyses automatically.
  • Automated Data Visualization: Intelligently selects and generates the best visualizations (bar charts, line graphs, heatmaps, etc.) to represent your data and answer your questions.
  • AI-Powered Insight Generation: Goes beyond visualization to proactively identify and highlight key trends, anomalies, correlations, and actionable insights within your dataset.
  • Data Cleaning and Preparation Assistant: The AI helps identify and suggest fixes for common data quality issues, such as missing values, duplicates, and formatting inconsistencies.
  • Code Generation (Python & SQL): For transparency and advanced use cases, Pandalyst can generate the underlying Python (Pandas) or SQL code used for the analysis. This is perfect for data scientists who want to validate results or integrate them into custom workflows.
  • Interactive Dashboards: Create and customize dynamic dashboards to monitor key metrics in real-time. Share these dashboards with stakeholders to foster a data-centric culture.
  • Broad Data Source Integration: Seamlessly connect to a variety of data sources, from simple spreadsheets to complex cloud databases.

Use Cases for pandalyst

Pandalyst is versatile and can be applied across various departments:

  • Marketing Teams: Analyze campaign ROI, track customer acquisition costs, segment audiences, and measure website traffic performance without technical assistance.
  • Sales Departments: Monitor sales pipelines, forecast revenue, identify top-performing products or regions, and track team performance against quotas.
  • Business Operations: Optimize supply chains, analyze operational efficiency, identify bottlenecks, and monitor key performance indicators (KPIs).
  • Financial Analysts: Speed up financial reporting, analyze profit and loss statements, and conduct variance analysis with simple language queries.
  • Product Managers: Understand user behavior, track feature adoption rates, and analyze user feedback to inform product roadmap decisions.

Advantages of pandalyst

Pandalyst offers a significant competitive edge:

  • Democratization of Data: Empowers non-technical team members to self-serve their data needs, freeing up data analysts for more strategic work.
  • Speed and Efficiency: Reduces the time from question to insight from hours or days to mere seconds.
  • No-Code Platform: Eliminates the steep learning curve associated with data analysis tools and programming languages.
  • Trust and Transparency: The optional code generation feature allows technical users to audit and trust the AI's output.
  • Cost-Effective: Reduces the need for a large, dedicated data science team for routine analytical tasks, lowering operational costs.

Pricing and Plans

Pandalyst offers a flexible pricing structure to suit different needs (inferred model):

  • Free Plan: Ideal for individuals or small projects, offering basic features, a limited number of queries per month, and support for 1-2 data sources.
  • Pro Plan: Designed for professionals and small teams, this plan includes unlimited queries, more data source integrations, advanced features like dashboard sharing, and priority support. Typically priced on a per-user, per-month basis.
  • Enterprise Plan: A custom solution for large organizations, offering advanced security features (like SSO), API access, dedicated support, and potential on-premise deployment options. Pricing is available upon request.

Positioning

Their taxonomy shows where the products overlap and where each one has a more distinct focus. Unknown fields are shown explicitly and are never filled with assumptions.

Categories

Shared
Low Code No Code
Only Hex
Data ScienceCollaboration
Only pandalyst
AnalyticsAutomation

Tags

Shared
business intelligencedashboarddata analysisdata visualizationpythonreportingSQL
Only Hex
AI assistantcollaborationdata sciencemachine learningnotebook
Only pandalyst
AI analystnatural language processingno-codepandas

Audience and roles

Shared
No listed items
Only Hex
No listed items
Only pandalyst
No listed items

Traffic comparison

Traffic is shown on the same scale so differences in market visibility are not visually understated.

How to interpret the traffic data

Both charts share the same months and vertical scale. Each tool identifies its latest reporting month; missing months are left blank, not counted as zero. Regional and source visit counts are estimates calculated from the reported shares.

Hex monthly traffic:

Latest traffic · 2026-05

Monthly visits
600.6K
Avg. visit duration
4:51
Pages per visit
4.23
Bounce rate
37.2%
Data updated 2026-06-15

Monthly traffic trend

  • 2025-09: 522K
  • 2026-01: 602.8K
  • 2026-02: 579.1K
  • 2026-03: 660.6K
  • 2026-04: 585.6K
  • 2026-05: 600.6K

Top regions

Top 5 countries/regions
Country/regionPercentageEstimated visits
🇺🇸United States77.44%465.1K
🇨🇦Canada8.61%51.7K
🇬🇧United Kingdom6.11%36.7K
🇪🇸Spain4.14%24.9K
🇲🇽Mexico3.7%22.2K

Traffic sources

Source typePercentageEstimated visits
Direct88.79%533.3K
Referral8.56%51.4K
Email2.65%15.9K

Search keywords

hexhex aihex analyticshex careershex tech

pandalyst

No data available

Community signals

Ratings, comments, favorites, and likes are community signals—not a substitute for product fit.

Hex

Rating
No data available
Comments
0
Favorites
189
Likes
205

pandalyst

Rating
No data available
Comments
0
Favorites
215
Likes
224

Hex vs pandalyst · Comparison FAQ

What do Hex and pandalyst have in common?
Both tools are listed under Low Code No Code. These categories indicate overlapping use cases; compare their detailed descriptions for workflows, capabilities and limitations.
Are Hex and pandalyst free?
Listed pricing models: Hex — Freemium; pandalyst — Freemium. Missing pricing is not proof of a free plan, and freemium does not mean every feature is free. Check official sites for current plans, limits and trials.
How should I choose between Hex and pandalyst?
The primary listed category is Data Science for Hex, and Low Code No Code for pandalyst. Compare features, steps and use cases, then verify pricing, data permissions and deployment needs. This page does not include hands-on testing and does not declare a winner from traffic or tags.

Sources and comparison methodology

This page is assembled from ToolMage product listings, taxonomy, traffic statistics and on-site user feedback. It is not a hands-on test or an independent review.

  • Feature and plan descriptions reflect information in the listings, not real-time guarantees. Verify pricing, quotas, availability and privacy terms on the official sites.
  • Traffic uses the reporting months shown. Missing statistics do not mean zero visits, and different periods do not establish growth or superiority. Regional and source visit counts are estimates based on shares.
  • Different tags indicate differences in the listings, not proof that the other product lacks a capability. Ratings, favorites and visits are not used to declare a winner.

Related comparisons