Deepnote
Business Intelligence
AI TOOL COMPARISON
What is the difference, and which fits your workflow? Compare features, usage, pricing models and traffic side by side.
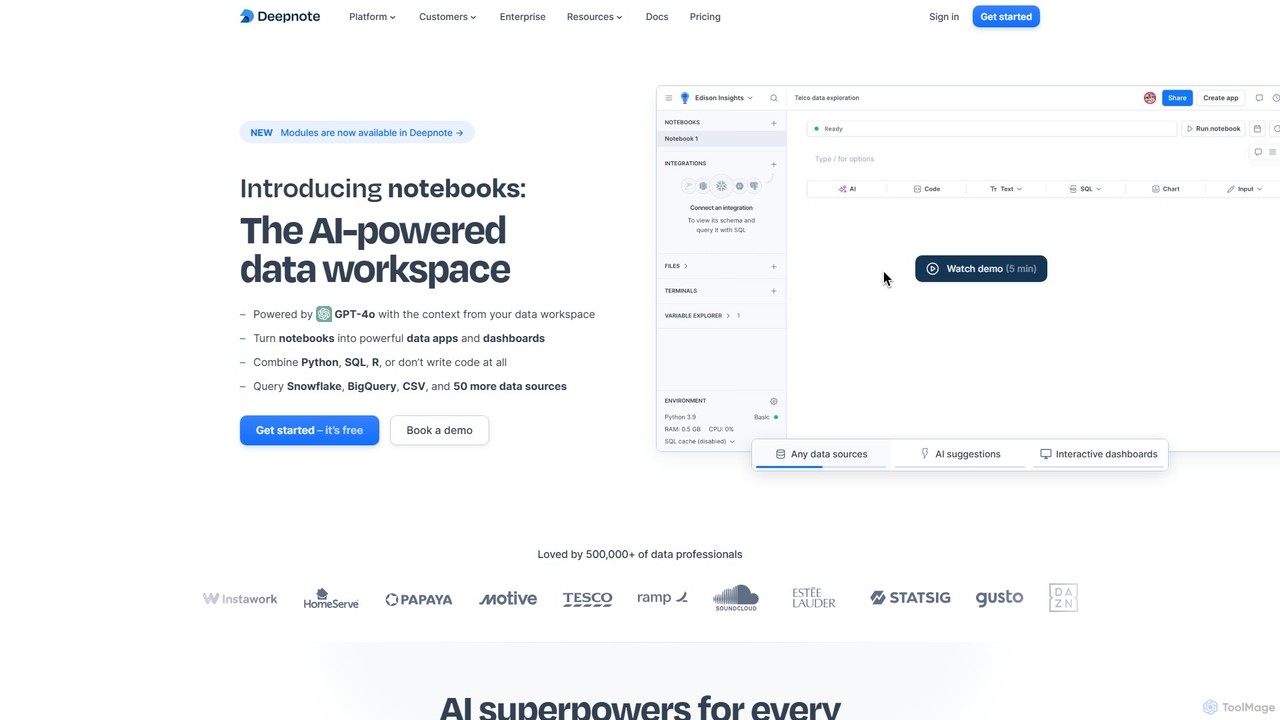
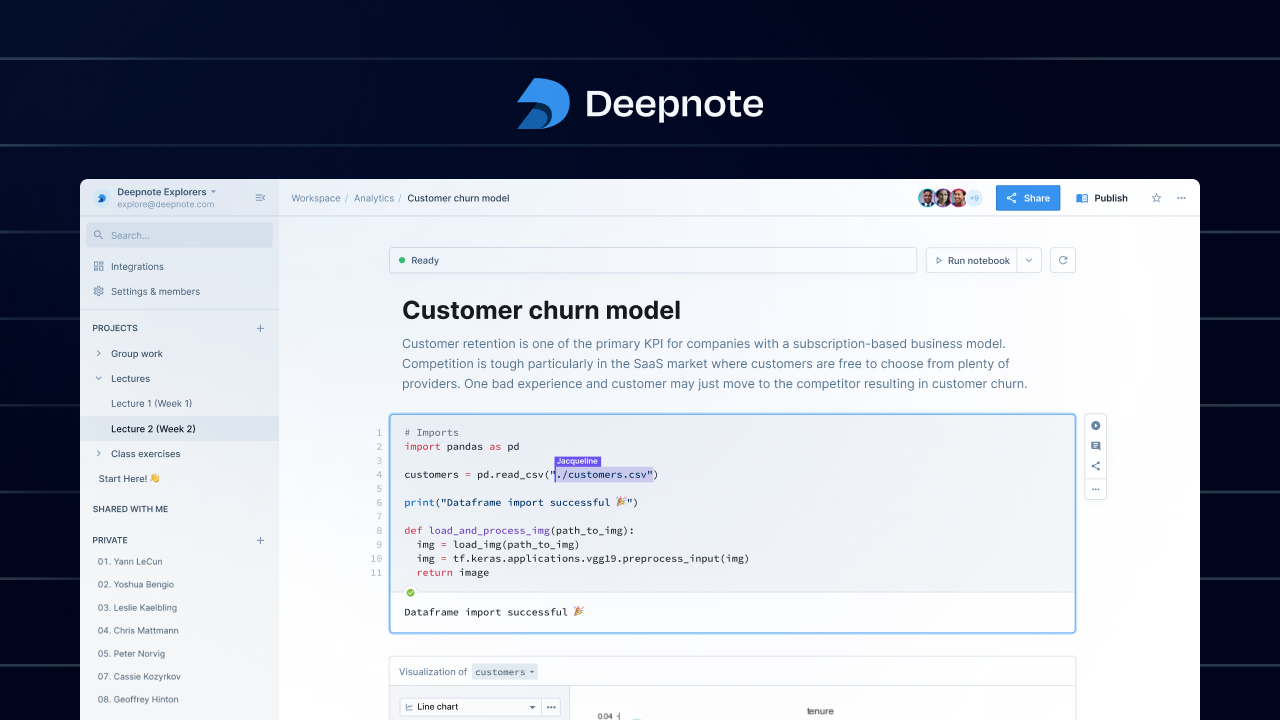
Deepnote is an AI-powered, collaborative data science notebook for teams. It unifies Python, SQL, and R in a single cloud-based workspace, enabling users to explore data, build machine learning models, and create interactive dashboards and apps with ease. Powered by GPT-4o, it automates analysis and code generation, making data science accessible to all skill levels.
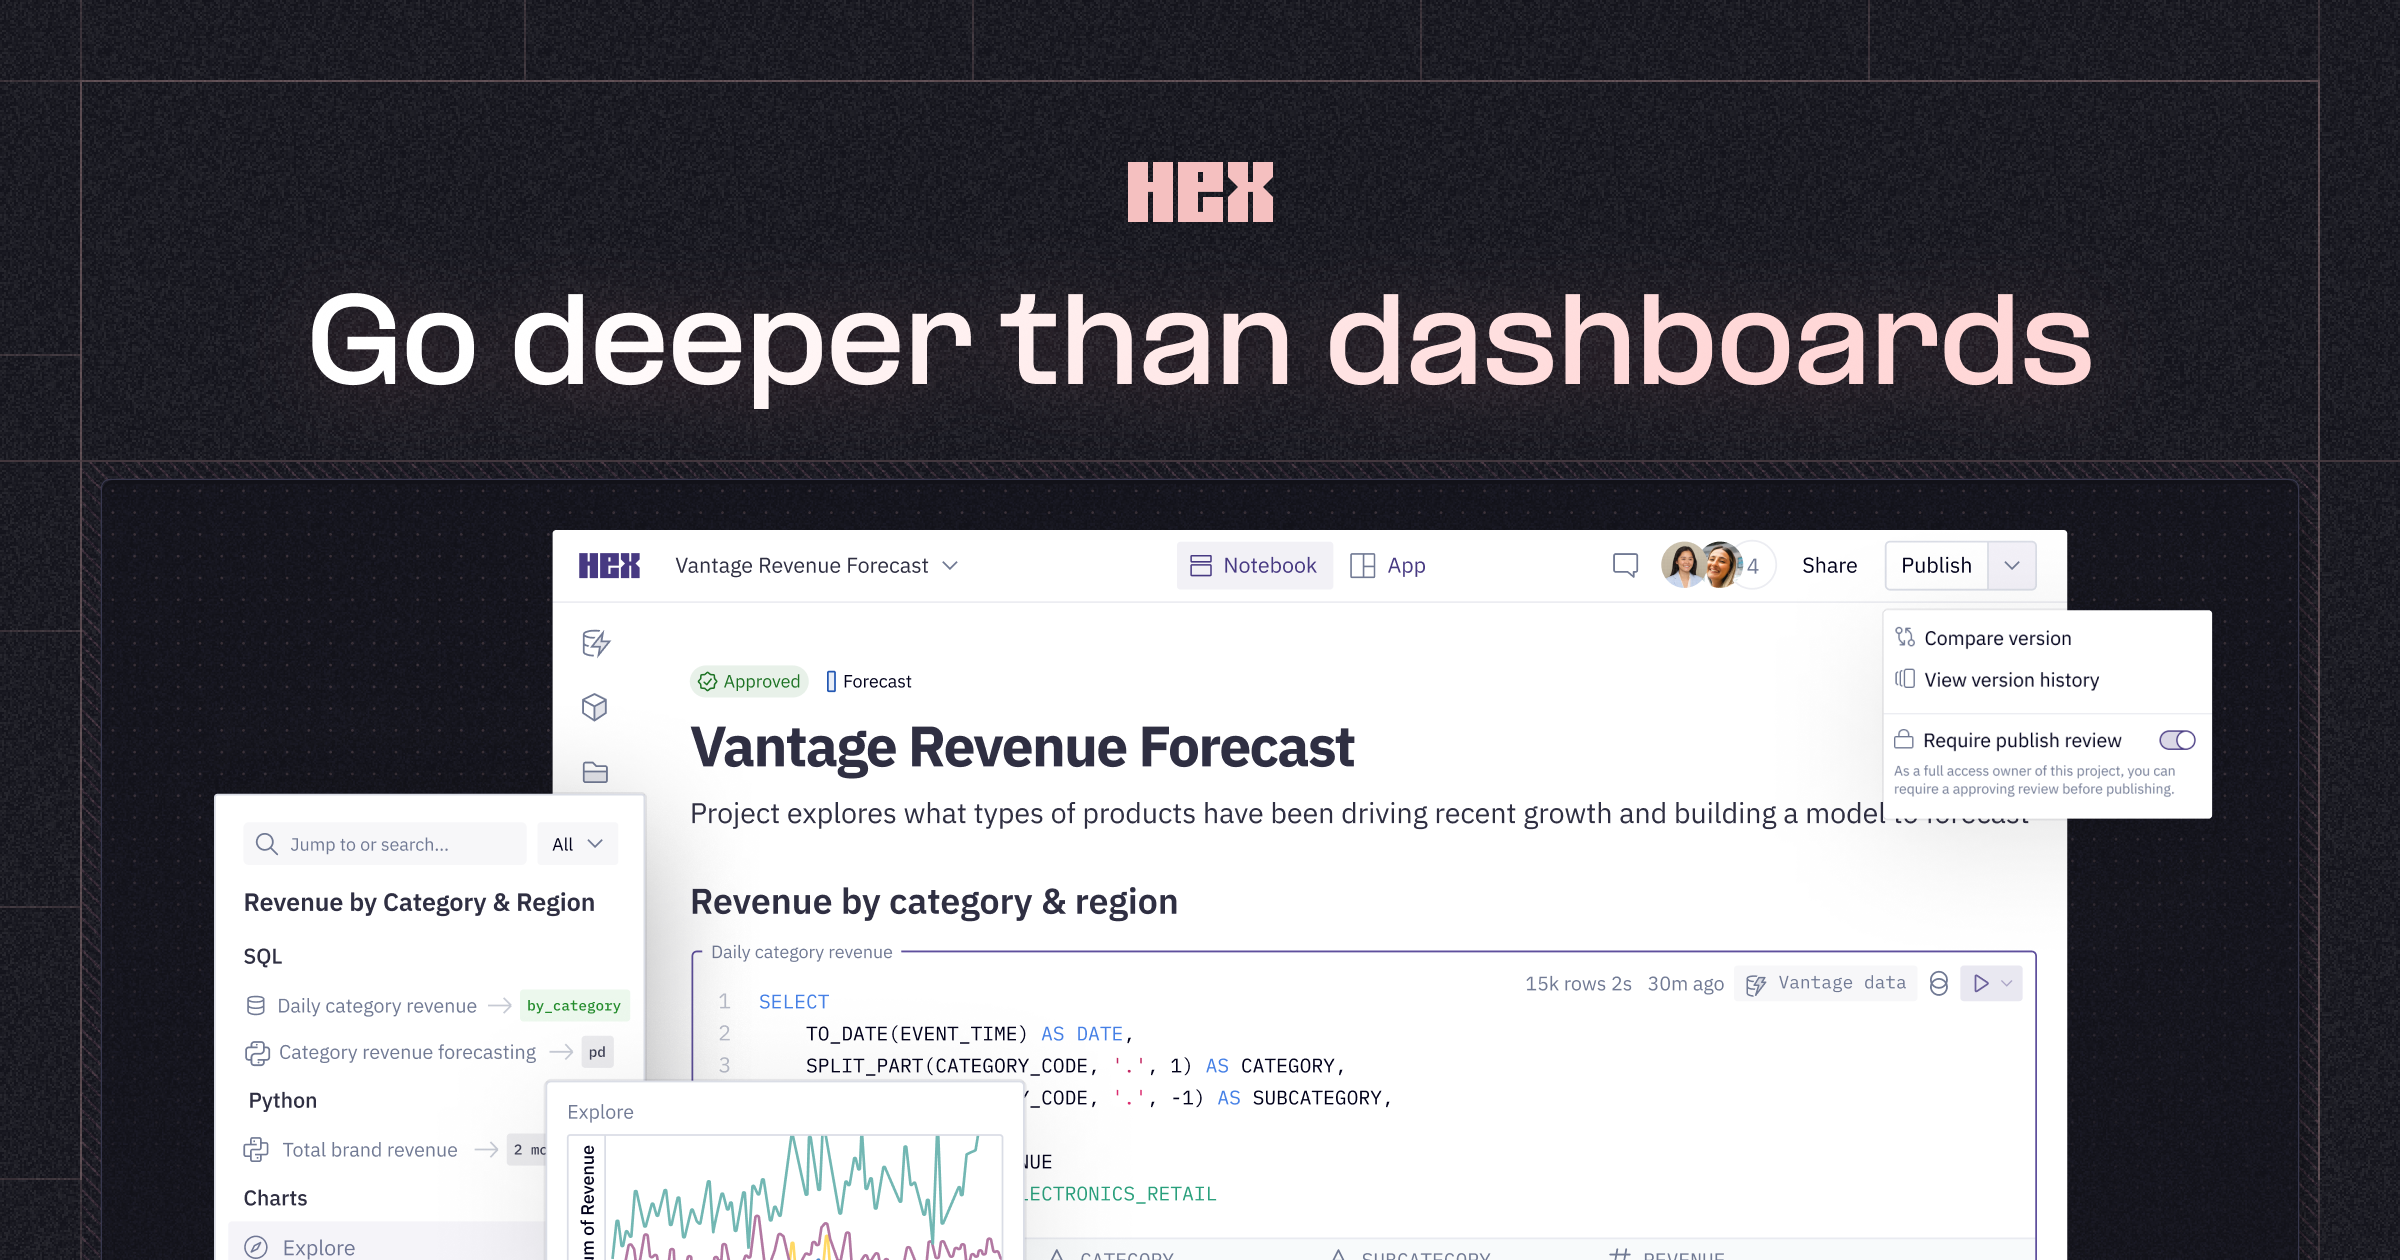
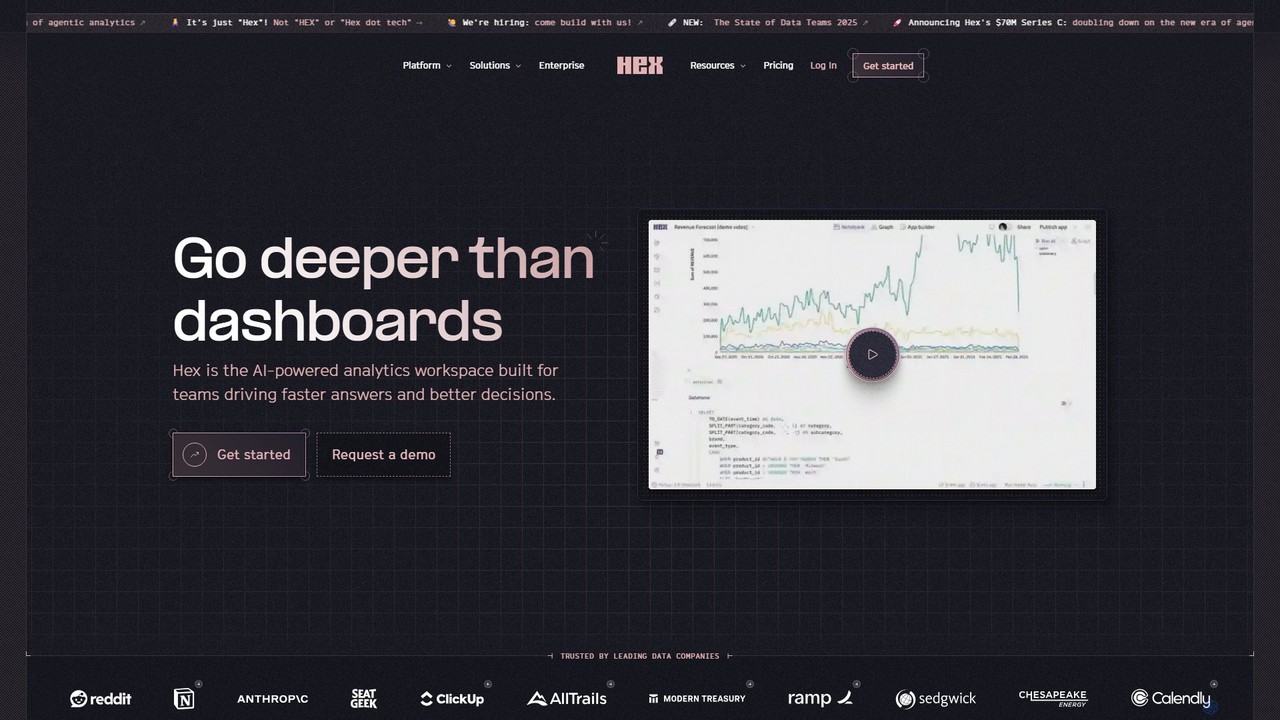
Hex is an AI-powered analytics workspace designed for teams. It integrates notebooks for Python and SQL, interactive data apps, and self-serve exploration into a single collaborative platform, enabling faster, data-driven decision-making.
Compare product focus, pricing models and audiences. Highlighted rows indicate different listed information; unknown pricing does not mean free.
| Quick facts | Deepnote | Hex |
|---|---|---|
| Pricing model | Freemium | Freemium |
| Product type | Web | Web |
| Primary focus | Business Intelligence | Data Science |
| Audience and roles | No data available | No data available |
| Categories | Business Intelligence · Analytics · Data Science · Collaboration | Data Science · Low Code No Code · Collaboration |
| Added | Aug 11, 2025 | Aug 11, 2025 |
| Updated | Nov 19, 2026 | Nov 19, 2026 |
Explore the listed product descriptions, features and workflows. Taxonomy labels alone are not feature evaluations.
Deepnote is a next-generation data workspace designed for analytics and data science teams. It revolutionizes the traditional notebook experience by integrating powerful AI capabilities, real-time collaboration, and a seamless multi-language environment. Unlike legacy tools like Jupyter, Deepnote is a cloud-native platform that eliminates setup hassles and fosters teamwork. It allows users to connect to over 50 data sources, write and execute Python, SQL, and R code in the same notebook, and instantly visualize results. With its AI copilot, powered by GPT-4o, users can generate, debug, and explain code, or even perform entire analyses by simply describing their goals in natural language. This makes complex data tasks faster for experts and more accessible for beginners. Deepnote transforms static analyses into dynamic, shareable data apps and dashboards, complete with interactive inputs and scheduled updates, making it an end-to-end solution for moving from raw data to actionable insights.
Getting started with Deepnote is straightforward and requires no local installation. 1. **Sign Up:** Create a free account on the Deepnote website. Since it's browser-based, you can start immediately. 2. **Create a Workspace:** Organize your work by creating a workspace for your team or project. You can create folders to manage different analyses. 3. **Connect Your Data:** Integrate with your data sources in seconds. Deepnote supports over 50 connectors, including Snowflake, BigQuery, PostgreSQL, Amazon S3, and you can also upload CSV files directly. 4. **Start a Notebook:** Create a new notebook. You can use a combination of code blocks (Python, SQL, R), text blocks (Markdown), and no-code chart blocks. 5. **Leverage AI:** Use the AI assistant to accelerate your workflow. Type a prompt to generate SQL queries, write Python code for analysis, create visualizations, or debug errors. The AI is context-aware of your data schema and existing code. 6. **Collaborate in Real-Time:** Invite teammates to your notebook by sharing a link. Work together simultaneously, leave comments on specific cells, and review changes with version history, just like in Google Docs. 7. **Build and Share:** Turn your notebook into an interactive data app or dashboard. Arrange your cells, hide code blocks, and add input widgets like sliders and dropdowns. Share your live, interactive report with stakeholders with a single click.
Deepnote is versatile and supports a wide range of data-related tasks: Business Intelligence: Building interactive sales reports, customer 360 dashboards, and analyzing NPS data. Data Science & Machine Learning: Developing churn prediction models, implementing lead scoring algorithms, fine-tuning LLMs like LLaMA 7B, and performing protein visualizations. Data Analytics: Conducting A/B test evaluations, analyzing AWS costs, and performing quick data explorations. ETL & Automation: Creating pipelines to sync data between services (e.g., Salesforce to Notion) and scheduling regular data processing jobs. Education & Research: Providing a zero-setup, collaborative environment for teaching data science courses and conducting research projects.
Deepnote offers significant advantages over traditional tools. Its **AI-first approach** dramatically increases productivity for all users, from analysts to scientists. The **cloud-native, collaborative environment** removes friction in teamwork, eliminating environment setup and version control issues. By **unifying the entire data workflow**—from data connection and exploration to building and sharing interactive apps—it creates a single source of truth and accelerates the path to insight. Its **security and scalability** make it suitable for both small startups and large enterprises, ensuring data is protected and compute resources are always available. Finally, its **freemium model and free Education plan** make powerful data tools accessible to everyone.
Deepnote offers a tiered pricing structure to suit different needs:
Hex is a comprehensive, AI-powered analytics workspace built for teams to drive faster answers and better decisions. It provides a unified platform that goes beyond traditional dashboards, integrating deep-dive analysis, interactive data applications, and self-service exploration. Hex is trusted by leading data companies like Notion, ClickUp, and StubHub to foster a data-driven culture where anyone, regardless of technical proficiency, can comfortably use data to answer their own questions.
The platform's core is a collaborative notebook environment where Python, SQL, and no-code elements coexist harmoniously. This eliminates the need to switch between different tools for querying, transforming, predicting, and visualizing data. With its integrated AI assistant, users can get intelligent help anywhere in their workflow, from generating code with a simple prompt to creating charts and explaining complex logic.
Using Hex involves a streamlined workflow designed for both data professionals and business users. First, you connect Hex to your data sources, with built-in connections for popular data warehouses like Snowflake, BigQuery, and databases. Once connected, you can begin your analysis in a Hex notebook. You can write SQL queries to fetch data, use Python for advanced analysis and machine learning, or leverage no-code cells with point-and-click tools to filter and pivot data. The platform's AI assistant can be prompted in natural language to generate queries, write code, or build visualizations. As you work, you can collaborate with teammates in real-time through multiplayer editing and comments. Once your analysis is complete, you can transform it into a polished, interactive data app using a drag-and-drop builder. These apps can be shared with stakeholders, who can then explore the data, adjust parameters, and even write data back to your database, turning insights directly into action.
Hex is versatile and supports a wide range of analytics needs. For example, ClickUp used Hex to operationalize a data science churn model, turning it into a cross-functional program that saved millions in customer churn. Notion leverages Hex to empower everyone in the company, from data science to sales, to make decisions with data. Other common use cases include:
The primary advantage of Hex is its ability to unify the entire analytics workflow in one place. This eliminates tool-hopping and increases efficiency. Its AI-powered features significantly accelerate productivity for data teams. By providing both code-based and no-code interfaces, Hex democratizes data access, enabling both technical and non-technical users to collaborate effectively. This breaks down silos and fosters a stronger data culture. Finally, by allowing users to build interactive apps instead of static reports, Hex makes insights more actionable and shortens the feedback loop between analysis and decision-making.
Hex offers several plans to fit different needs:
Their taxonomy shows where the products overlap and where each one has a more distinct focus. Unknown fields are shown explicitly and are never filled with assumptions.
Traffic is shown on the same scale so differences in market visibility are not visually understated.
Both charts share the same months and vertical scale. Each tool identifies its latest reporting month; missing months are left blank, not counted as zero. Regional and source visit counts are estimates calculated from the reported shares.
| Country/region | Percentage | Estimated visits |
|---|---|---|
| 🇺🇸United States | 33.17% | 64K |
| 🇧🇷Brazil | 24.76% | 47.8K |
| 🇨🇴Colombia | 14.24% | 27.5K |
| 🇮🇳India | 13.94% | 26.9K |
| 🇮🇹Italy | 13.89% | 26.8K |
| Source type | Percentage | Estimated visits |
|---|---|---|
| Direct | 80.96% | 156.2K |
| Referral | 13.45% | 25.9K |
| 5.59% | 10.8K |
| Country/region | Percentage | Estimated visits |
|---|---|---|
| 🇺🇸United States | 77.44% | 465.1K |
| 🇨🇦Canada | 8.61% | 51.7K |
| 🇬🇧United Kingdom | 6.11% | 36.7K |
| 🇪🇸Spain | 4.14% | 24.9K |
| 🇲🇽Mexico | 3.7% | 22.2K |
| Source type | Percentage | Estimated visits |
|---|---|---|
| Direct | 88.79% | 533.3K |
| Referral | 8.56% | 51.4K |
| 2.65% | 15.9K |
Ratings, comments, favorites, and likes are community signals—not a substitute for product fit.
This page is assembled from ToolMage product listings, taxonomy, traffic statistics and on-site user feedback. It is not a hands-on test or an independent review.