Openlayer
分析 · 24.3K 月間訪問数
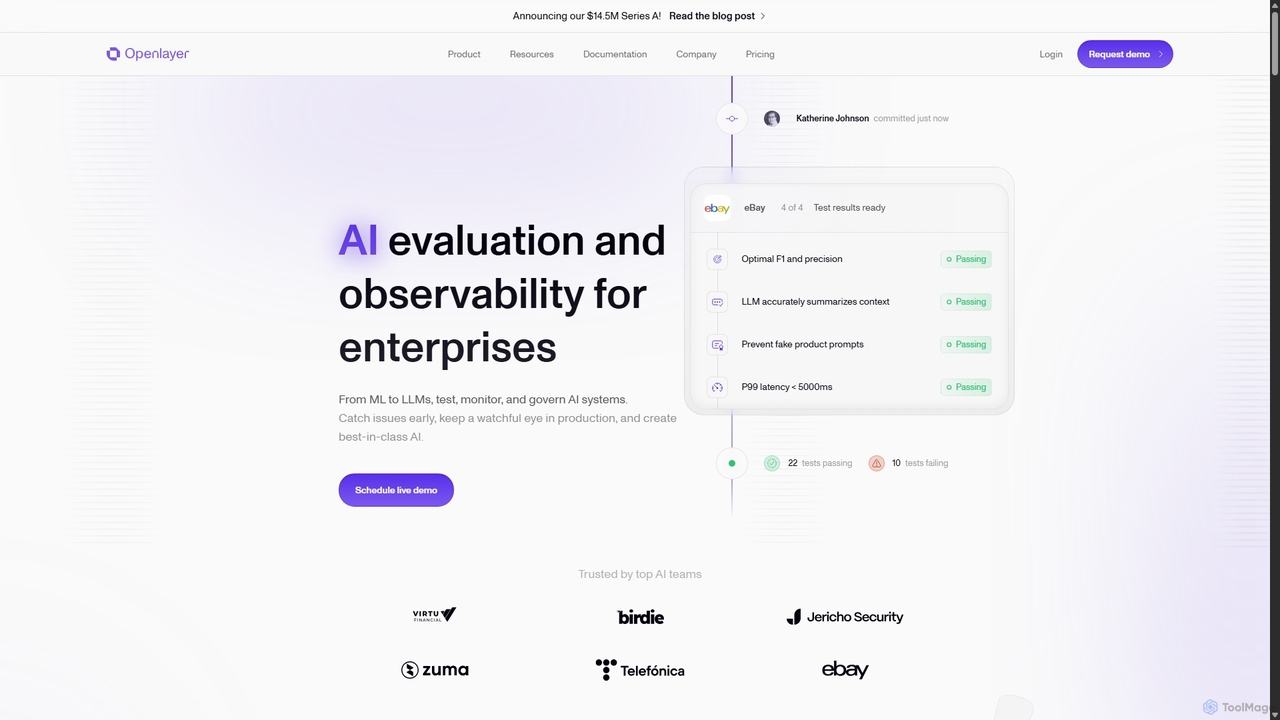
Openlayerは、エンタープライズ向けのAI評価およびオブザーバビリティプラットフォームです。開発から本番までのライフサイクル全体を通じて、従来の機械学習モデルと大規模言語モデル(LLM)のテスト、監視、ガバナンスをチームが実行できるよう支援し、信頼性とコンプライアンスを確保します。
Openlayerは、エンタープライズ向けのAI評価およびオブザーバビリティプラットフォームです。開発から本番までのライフサイクル全体を通じて、従来の機械学習モデルと大規模言語モデル(LLM)のテスト、監視、ガバナンスをチームが実行できるよう支援し、信頼性とコンプライアンスを確保します。
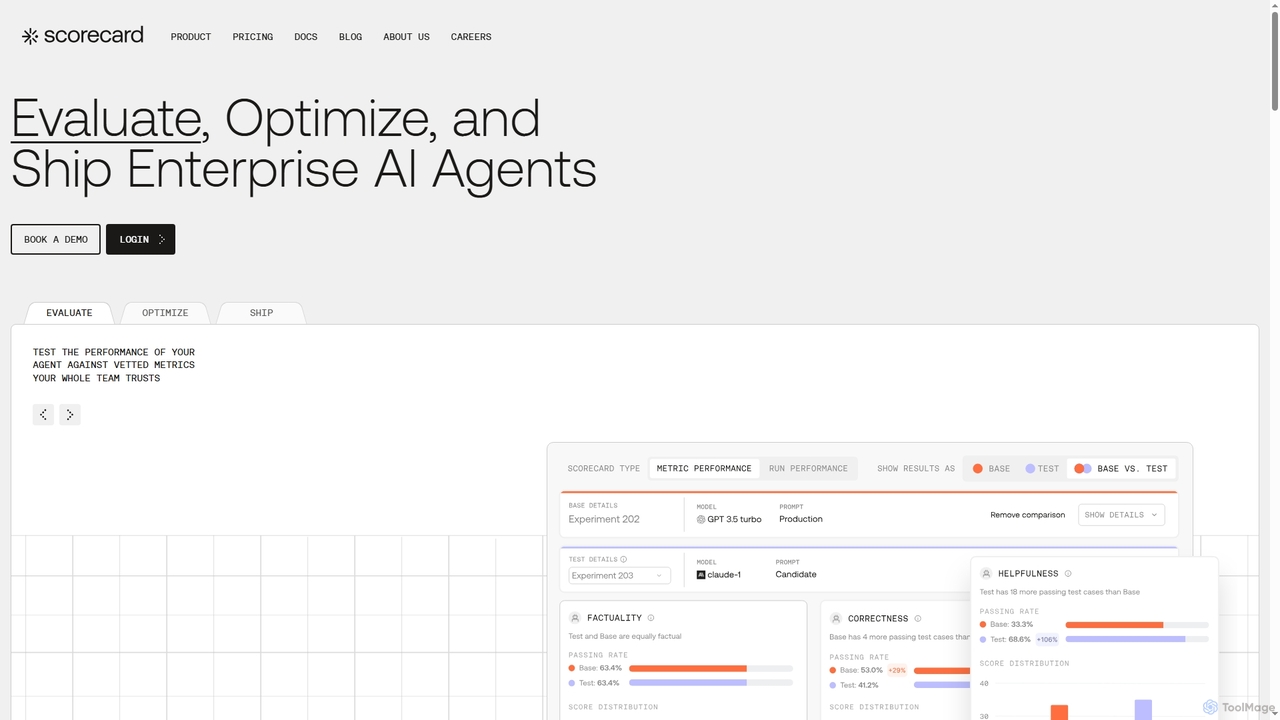
Scorecardは、エンタープライズAIエージェントを評価、最適化、展開するためのエンドツーエンドのプラットフォームです。主観的なテストを構造化された評価に置き換え、継続的な監視、プロンプト管理、パフォーマンスメトリクスのツールを提供し、信頼性の高いAIアプリケーションを自信を持って構築するのに役立ちます。
Openlayerは、エンタープライズ向けのAI評価およびオブザーバビリティプラットフォームです。開発から本番までのライフサイクル全体を通じて、従来の機械学習モデルと大規模言語モデル(LLM)のテスト、監視、ガバナンスをチームが実行できるよう支援し、信頼性とコンプライアンスを確保します。
Scorecardは、エンタープライズAIエージェントを評価、最適化、展開するためのエンドツーエンドのプラットフォームです。主観的なテストを構造化された評価に置き換え、継続的な監視、プロンプト管理、パフォーマンスメトリクスのツールを提供し、信頼性の高いAIアプリケーションを自信を持って構築するのに役立ちます。
| Feature | Openlayer | Scorecard |
|---|---|---|
| 主要カテゴリー | 分析 | 評価 |
| 追加日 | 2025-09-14 | 2025-10-18 |
| 価格 | フリーミアム | フリーミアム |
| 公式サイト | openlayer.com | www.scorecard.io |
| 製品タイプ | ウェブサイト | ウェブサイト |
| Performance data | ||
| ユーザー評価 | 未確認 | 未確認 |
| コメント | 0 | 0 |
| 月間訪問数 | 24.3K | 8.7K |
| 月間成長率 | -0.4% | -25.4% |
| お気に入り | 165 | 128 |
| Details | 詳細を見る | 詳細を見る |
Compare Openlayer and Scorecard by monthly reach, traffic trend, visit depth, top regions, and acquisition sources.
In the Openlayer vs Scorecard monthly traffic comparison, Openlayer currently shows 24.3K visits and Scorecard shows 8.7K; Openlayer has about 2.8 times the visible traffic of Scorecard, an absolute difference of about 15.6K visits. This reflects visible reach, not feature quality or paid users.
Both tools provide verified traffic details, so monthly trends, visit depth, regions, and acquisition sources can be compared on the same basis.
| Country/region | Percentage | Traffic |
|---|---|---|
| 🇺🇸United States | 38.9% | 9.4K |
| 🇳🇬Nigeria | 22.13% | 5.4K |
| 🇮🇳India | 20.93% | 5.1K |
| 🇩🇪Germany | 9.78% | 2.4K |
| 🇧🇷Brazil | 8.26% | 2K |
| Country/region | Percentage | Traffic |
|---|---|---|
| 🇺🇸United States | 51.77% | 4.5K |
| 🇻🇳Vietnam | 22.02% | 1.9K |
| 🇳🇬Nigeria | 11.92% | 1K |
| 🇬🇧United Kingdom | 8.33% | 722 |
| 🇵🇭Philippines | 5.96% | 517 |
This in-depth Openlayer vs Scorecard comparison uses only the product records, taxonomy, audience, traffic, and community signals available on this page. Openlayer is primarily listed under “分析”, while Scorecard is primarily listed under “評価”, so the first decision is whether your actual task matches their recorded scope.
The structured fields currently show these decision-relevant differences: Primary category (Openlayer: 分析; Scorecard: 評価); Monthly visits (Openlayer: 24.3K; Scorecard: 8.7K); Monthly growth (Openlayer: -0.4%; Scorecard: -25.4%); Favorites (Openlayer: 165; Scorecard: 128); Website (Openlayer: openlayer.com; Scorecard: www.scorecard.io). These facts are more useful for selection than brand visibility alone.
In the Openlayer vs Scorecard monthly traffic comparison, Openlayer currently shows 24.3K visits and Scorecard shows 8.7K; Openlayer has about 2.8 times the visible traffic of Scorecard, an absolute difference of about 15.6K visits. This reflects visible reach, not feature quality or paid users.
Both tools provide verified traffic details, so monthly trends, visit depth, regions, and acquisition sources can be compared on the same basis.
If public market visibility is an important first-pass criterion, investigate Openlayer first. The final choice should still follow taxonomy, use case, and a real trial because higher traffic does not prove broader capabilities or better workflow fit.
Openlayer and Scorecard currently overlap in shared categories: テスト; shared tags: AI評価、MLOps、モデル性能; shared roles: AI研究者、データサイエンティスト、機械学習エンジニア、プロダクトマネージャー. This can place both on the same shortlist, but it does not prove equal implementation, depth, or cost.
Openlayer's unique categories/tags are 分析、機械学習、モニタリング、AIガバナンス、AIオブザーバビリティ、AI テスト、コンプライアンス、データドリフト; Scorecard's are 評価、開発、A/Bテスト、AIエージェント、AI開発、AIモニタリング、継続的インテグレーション、LLMテスト. These unique fields are the strongest differentiators: validate the product whose recorded scope matches the task instead of following traffic alone.
Openlayer has no verified rating, 0 comments, 165 favorites, and 168 likes;Scorecard has no verified rating, 0 comments, 128 favorites, and 118 likes。
Neither product has enough rating or comment samples for a credible reputation ranking.
Put Openlayer on the priority trial list when the task aligns with “分析” and especially 分析、機械学習、モニタリング、AIガバナンス、AIオブザーバビリティ、AI テスト, or the users include AI開発者、最高技術責任者、DevOpsエンジニア、MLOpsエンジニア. This follows recorded positioning and does not imply unlisted capabilities are absent.
Openlayer also currently records: pricing is freemium, product type is website, 24.3K verified monthly visits, no verified user rating. Verify any hard requirement around price, platform, or reach before trial, and do not let sparse review data substitute for testing.
Put Scorecard on the priority trial list when the task aligns with “評価” and especially 評価、開発、A/Bテスト、AIエージェント、AI開発、AIモニタリング, or the users include QAエンジニア、ソフトウェア開発者. This follows recorded positioning and does not imply unlisted capabilities are absent.
Scorecard also currently records: pricing is freemium, product type is website, 8.7K verified monthly visits, no verified user rating. Verify any hard requirement around price, platform, or reach before trial, and do not let sparse review data substitute for testing.
The available data describes positioning, public visibility, and community signals, but it cannot prove output quality, speed, integration effort, privacy, or long-term cost in your workflow. Before deciding, run the same representative tasks in Openlayer and Scorecard, then record completion time, accuracy, manual corrections, and the real paid threshold. A like-for-like trial turns this comparison into a defensible adoption decision.
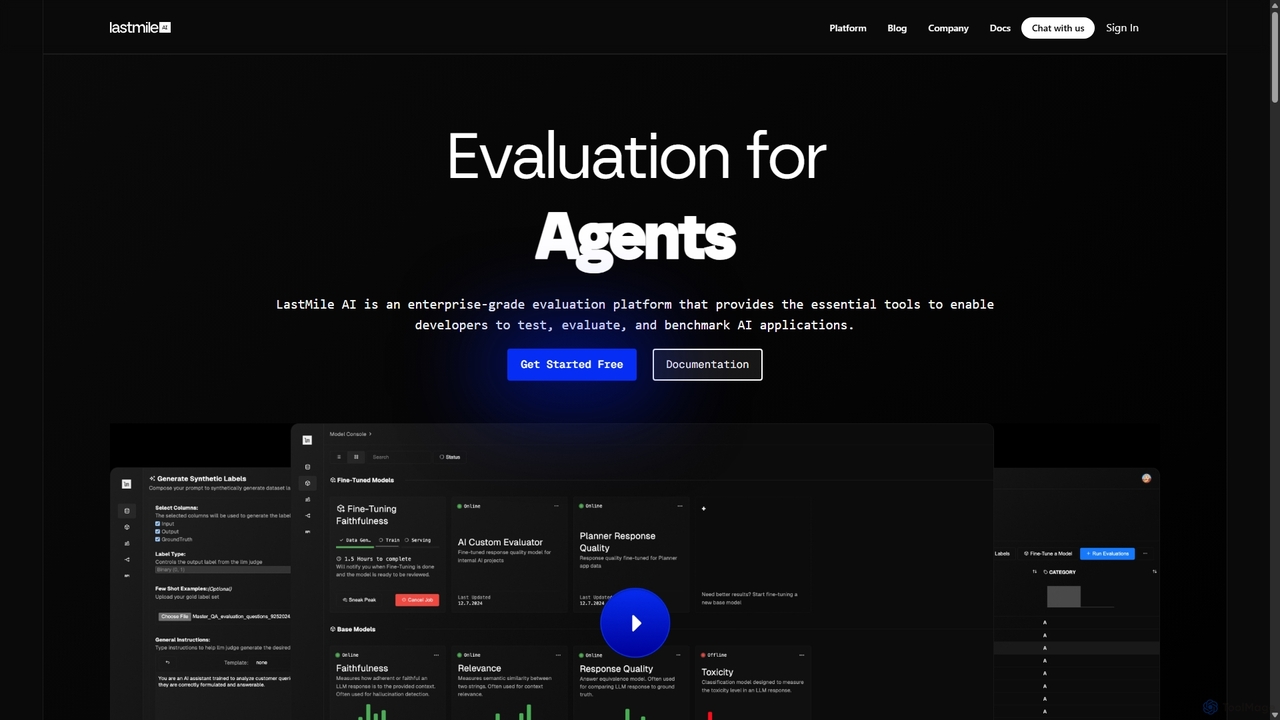
LastMile AIは、生成AIアプリケーションをテスト、評価、監視するためのエンタープライズグレードの開発者プラットフォームです。カスタム評価器のファインチューニング、合成データ生成、リアルタイム監視のためのAutoEvalなどのツールを提供し、AIシステムの信頼性と本番環境への準備を確実にします。
モデル評価
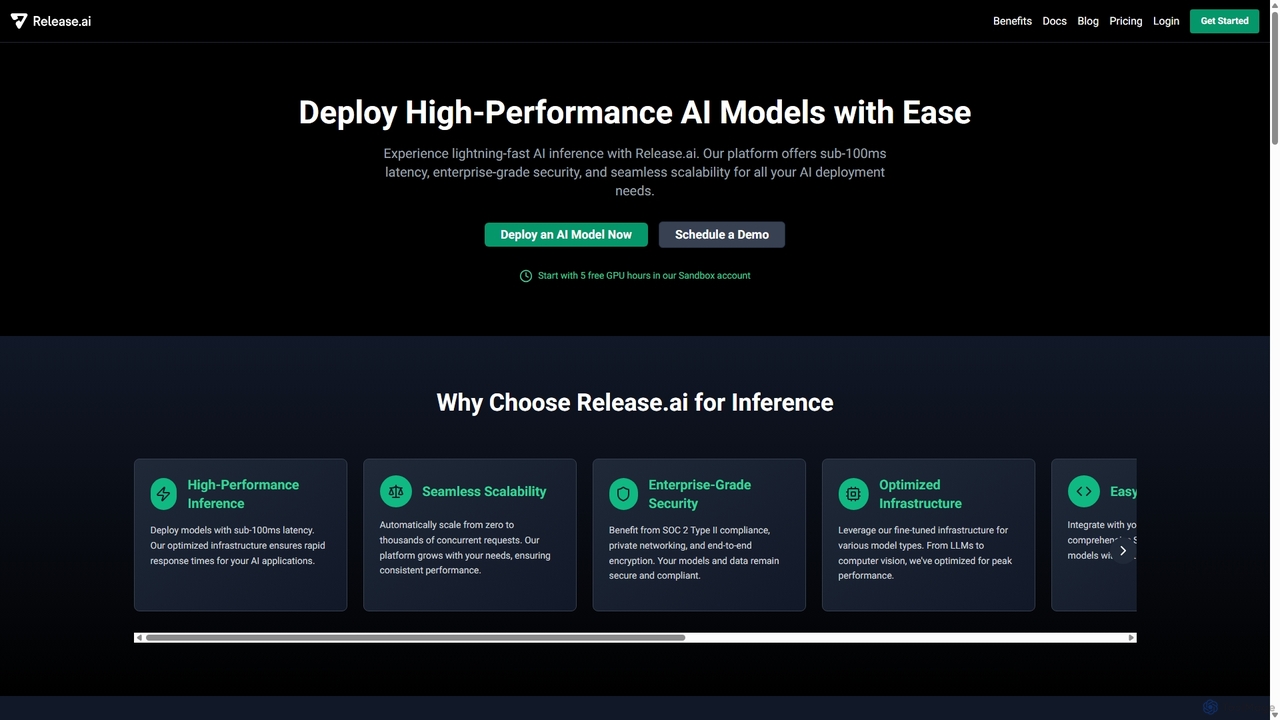
Release.aiは、開発者が高性能AIモデルを容易にデプロイ、管理、スケールさせるためのエンタープライズグレードのプラットフォームです。100ms未満の推論レイテンシ、シームレスな自動スケーリング、堅牢なセキュリティ、および事前最適化されたモデルの広範なライブラリを提供し、わずか数行のコードで任何の開発ワークフローに迅速に統合できます。
サービスとしてのプラットフォーム (PaaS)
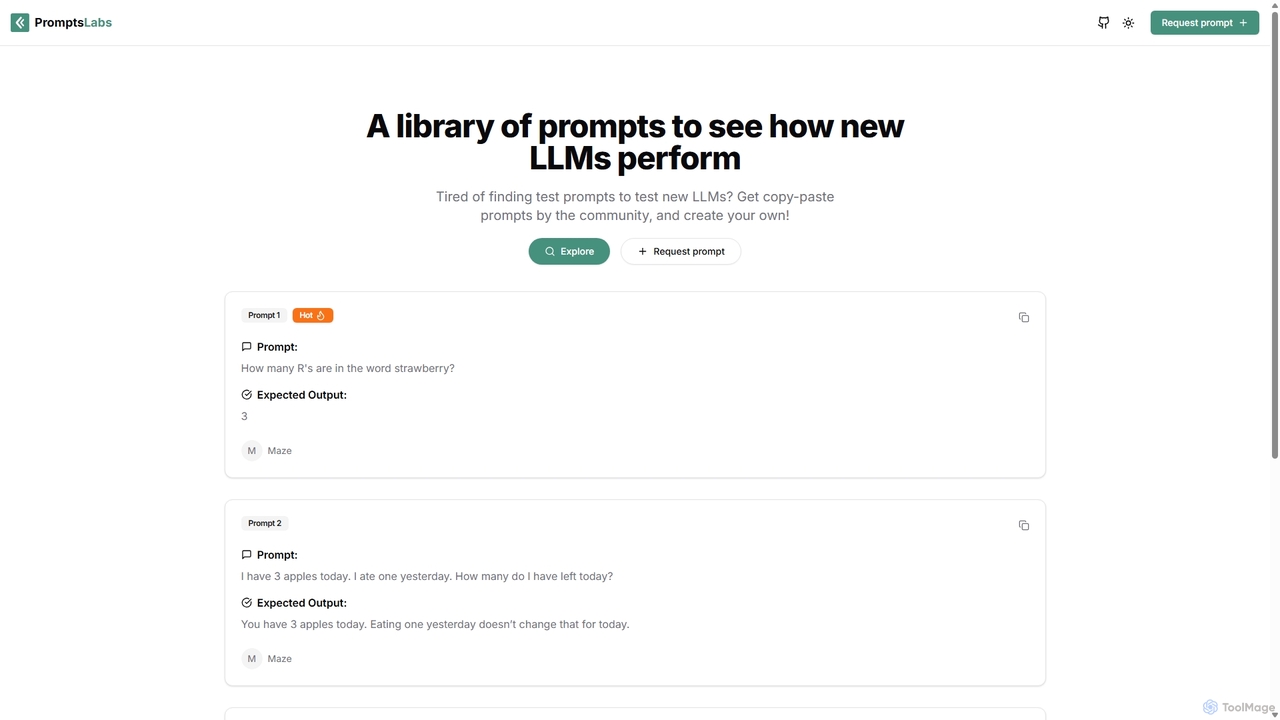
PromptsLabsは、新しい大規模言語モデル(LLM)の性能をテスト・評価するために設計された、コミュニティ主導のプロンプトライブラリです。論理、推論、数学などのタスクでモデルをベンチマークするのに役立つ、期待される出力付きの標準化されたコピー&ペースト用プロンプトを提供します。
プロンプトエンジニアリング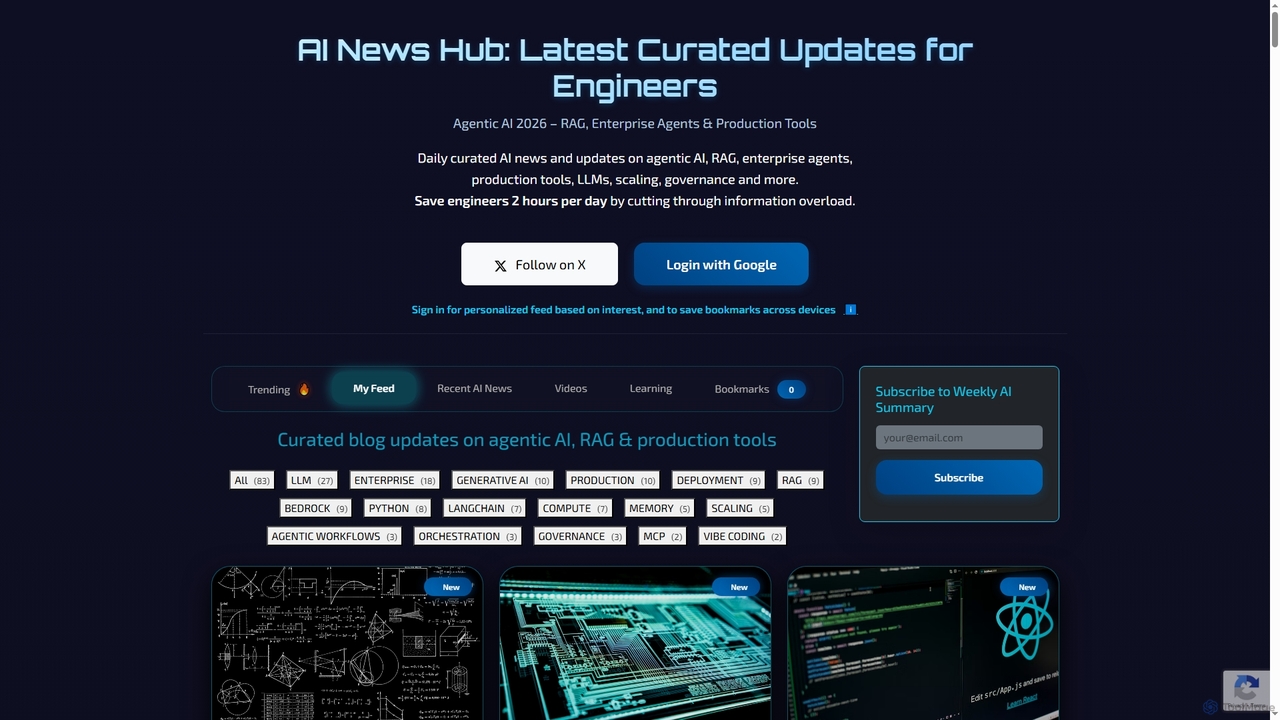
AI News Hubは、エージェントAI、RAG、およびプロダクションツールに関するリアルタイムのAI発表と厳選されたブログ更新を提供する包括的なプラットフォームです。パーソナライズされたフィード、ブックマーク機能、そしてロードマップ、コース、ビデオなどの豊富な学習リソースを提供し、開発者や愛好家が急速に進化するAI分野で情報とスキルを維持できるよう支援します。
Aggregation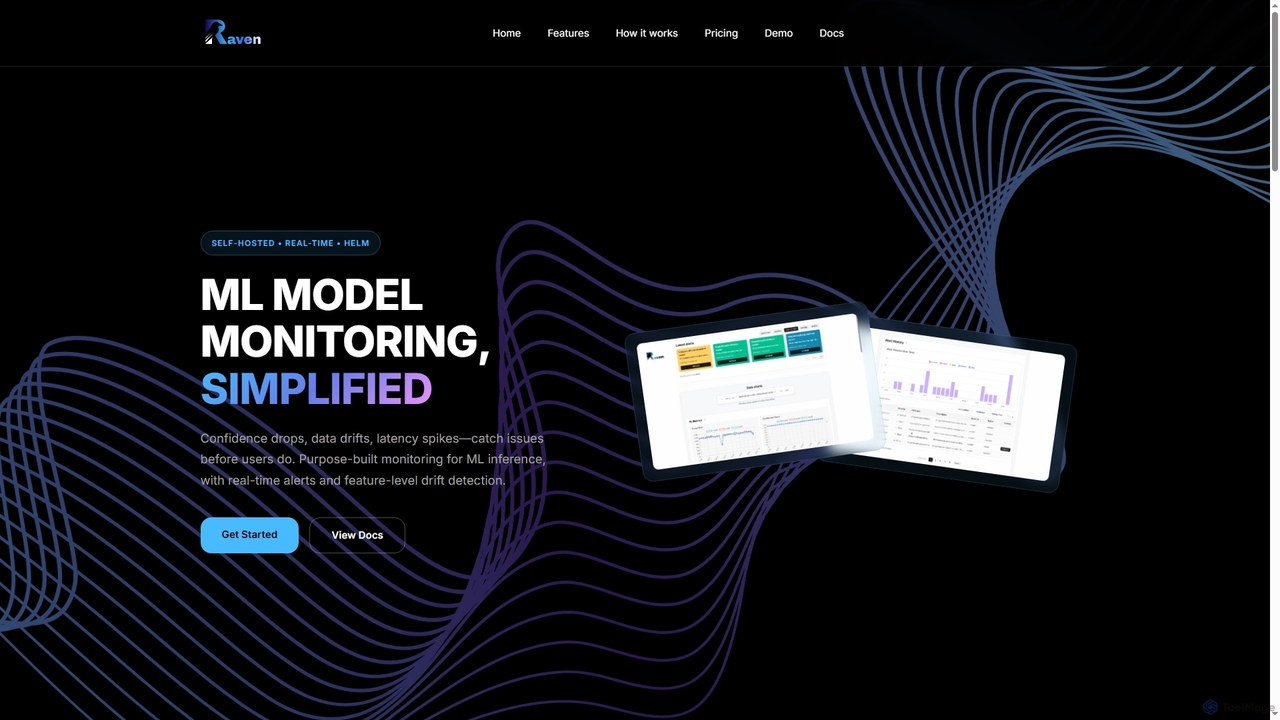
Ravenは、AIパイプラインの可観測性を簡素化するために設計された、自己ホスト型のリアルタイムMLモデル監視プラットフォームです。データドリフト、レイテンシースパイク、信頼度低下を検出し、即座にアラートを送信して、本番環境でのモデルの信頼性とパフォーマンスを保証します。
Kubernetesツール
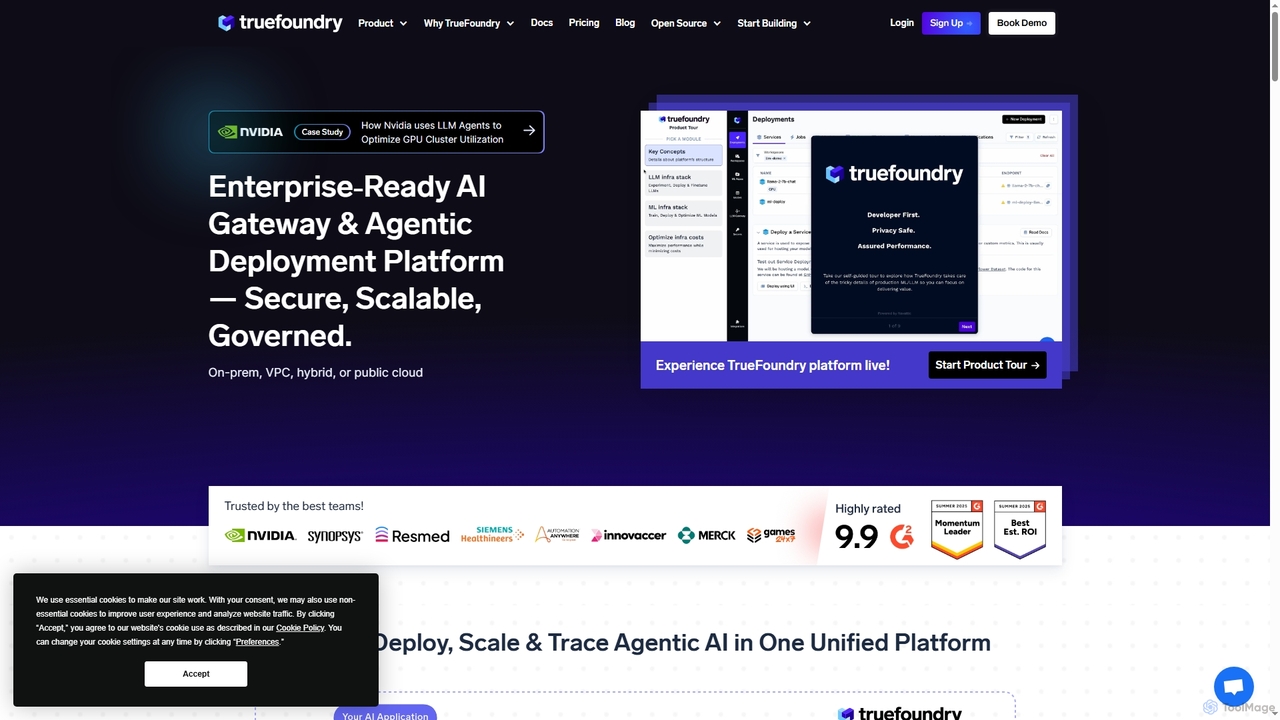
Truefoundryは、エージェント型AIアプリケーションをデプロイ、管理、スケーリングするためのエンタープライズ対応プラットフォームです。統一されたAIゲートウェイを提供し、複雑なAIワークフローをオーケストレーションし、モデルを管理し、セキュリティ、ガバナンス、可観測性を確保します。開発者やMLOpsチーム向けに設計されており、オンプレミス、クラウド、ハイブリッド展開をサポートし、GPU使用率を最適化し、市場投入までの時間を短縮します。
クラウドコンピューティング
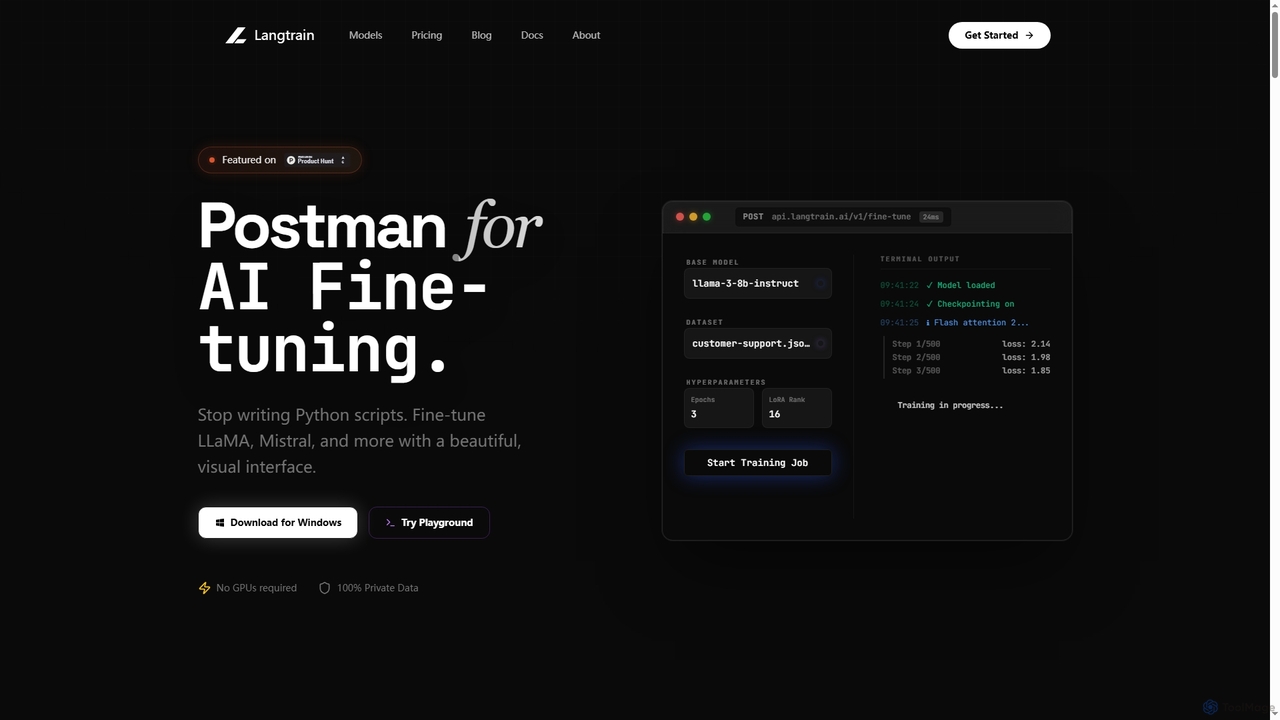
Langtrain は、開発者やエンジニアリングチームが最小限のコードで大規模言語モデル(LLM)をファインチューニング、デプロイ、管理するための強力なプラットフォームです。視覚的なインターフェースを提供し、LLaMA や Mistral などの人気のあるオープンソースモデルをサポートし、ローカルまたは安全なクラウドトレーニングを通じてデータプライバシーを保証します。
Modeldeployment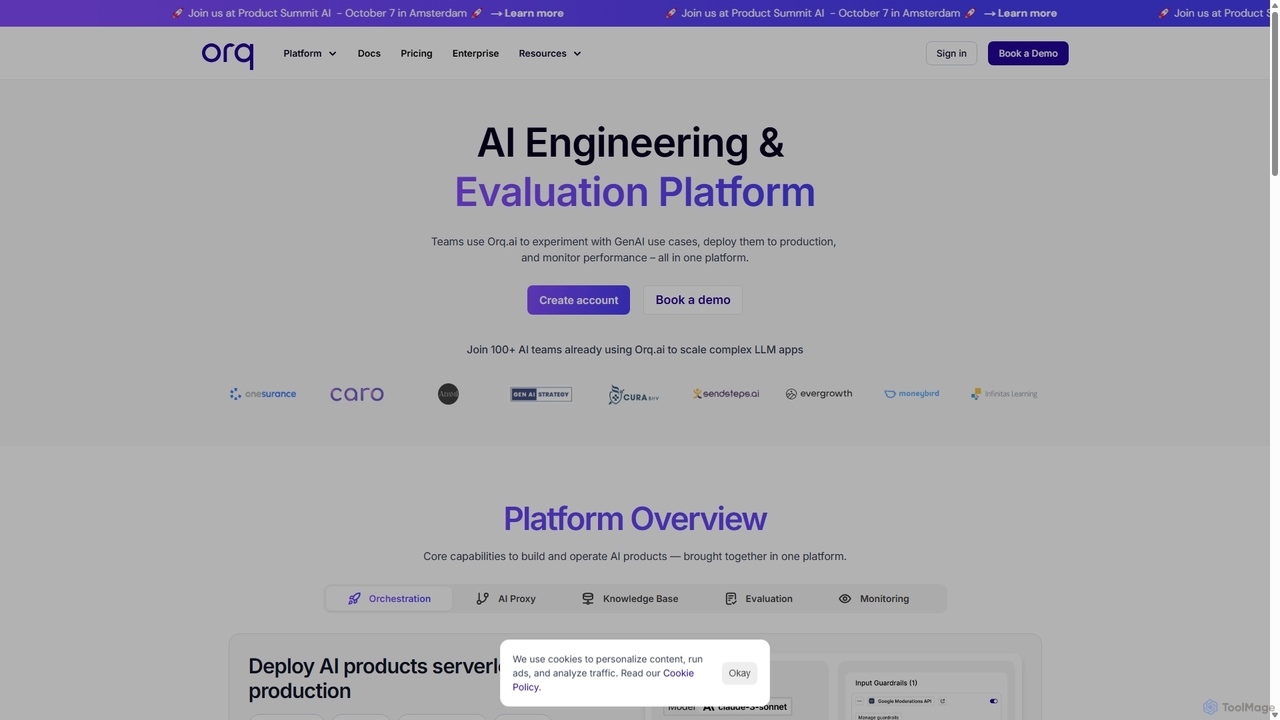
Orq.aiは、エンジニアリングチームとプロダクトチームのためのエンドツーエンドの生成AIコラボレーションプラットフォームです。単一の統合環境内で、GenAIのユースケースを実験し、本番環境にデプロイし、パフォーマンスを監視することで、LLMアプリケーションのライフサイクル全体をサポートします。
モデルデプロイメント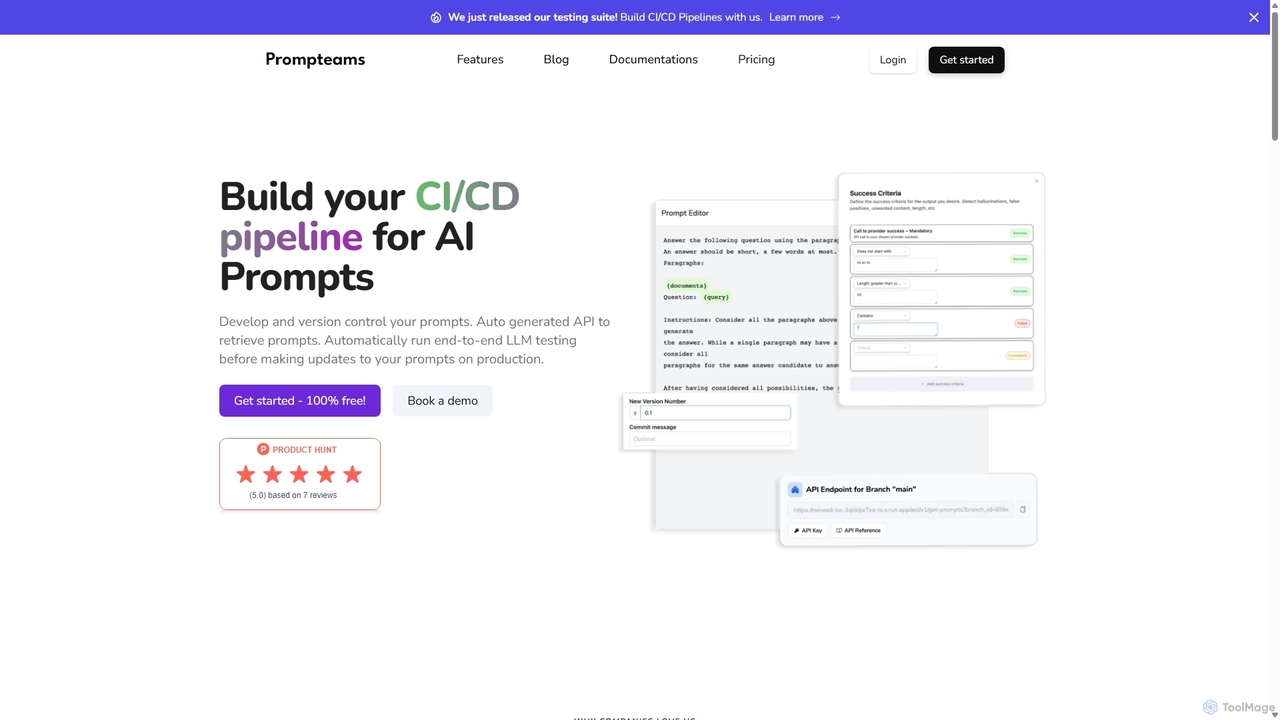
Prompteamsは、チーム向けに設計された包括的なAIプロンプト管理システムです。Gitのようなワークフローを提供し、バージョン管理、ブランチ、コミットを通じてLLMプロンプトを管理・反復します。このプラットフォームは、品質保証のための堅牢なテストスイート、即時展開のためのリアルタイムAPI、エンジニアと業界専門家の間のギャップを埋めるコラボレーションツールを備えています。AIプロンプトのCI/CDパイプラインを構築し、品質、一貫性、迅速な開発を保証するワンストップソリューションです。
モデル管理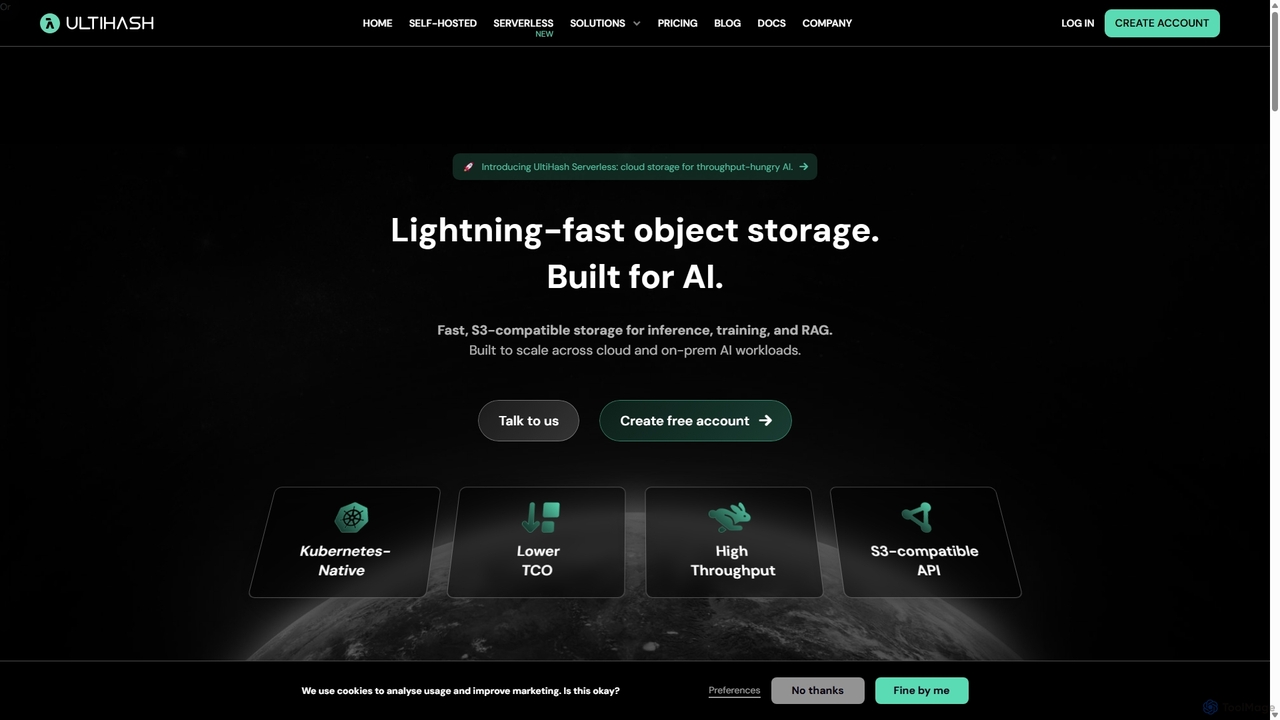
UltiHashは、AIおよびビッグデータワークロード向けに特別に構築された、高性能なKubernetesネイティブのオブジェクトストレージプラットフォームです。高度なバイトレベルの重複排除により、超高速のデータアクセスと大幅なコスト削減を実現し、クラウド、オンプレミス、ハイブリッド環境での柔軟なデプロイをサポートします。S3互換APIにより、既存のデータスタックやAIワークフローとのシームレスな統合が保証されます。
機械学習オペレーション