BaoBrain
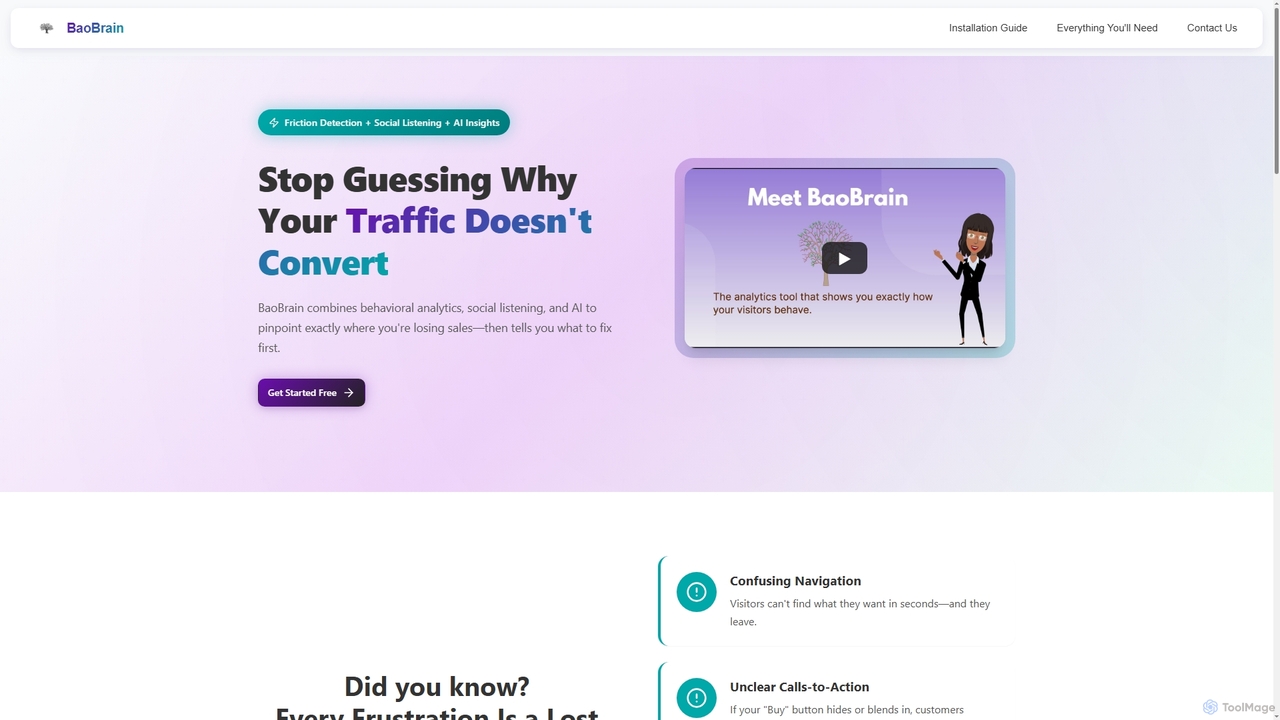
BaoBrain is an AI-powered analytics platform that combines behavioral analytics and social listening to identify friction points on …
BaoBrain is an AI-powered analytics platform that combines behavioral analytics and social listening to identify friction points on e-commerce websites. It pinpoints where visitors get stuck and lose sales, then provides prioritized, actionable recommendations to improve conversion rates and user experience.
Session AI
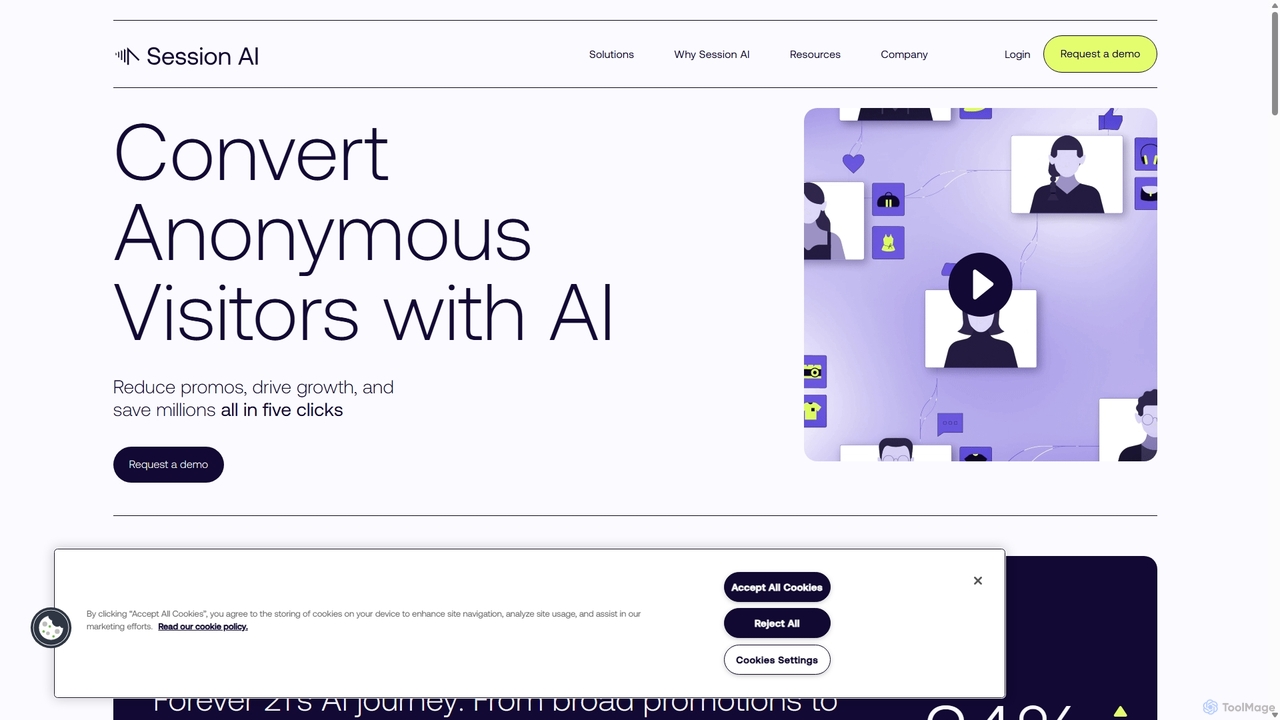
Session AI is a behavioral AI platform designed for e-commerce businesses to convert anonymous website visitors. It predicts …
Session AI is a behavioral AI platform designed for e-commerce businesses to convert anonymous website visitors. It predicts purchase intent in real-time based on visitor behavior within five clicks, delivering personalized actions to increase conversions, boost revenue, and reduce reliance on sitewide promotions, all without using personal data or third-party cookies.
TAWNY
TAWNY is a privacy-first Vision AI platform specializing in human analytics. It uses patented AI algorithms to analyze …
TAWNY is a privacy-first Vision AI platform specializing in human analytics. It uses patented AI algorithms to analyze video feeds from any camera, providing deep insights into crowd behavior, emotions, and attention. The technology is tailored for industries like market research, retail, transportation, and automotive, offering GDPR-compliant solutions to understand and decode complex human behavior in real-time.
riyo.ai
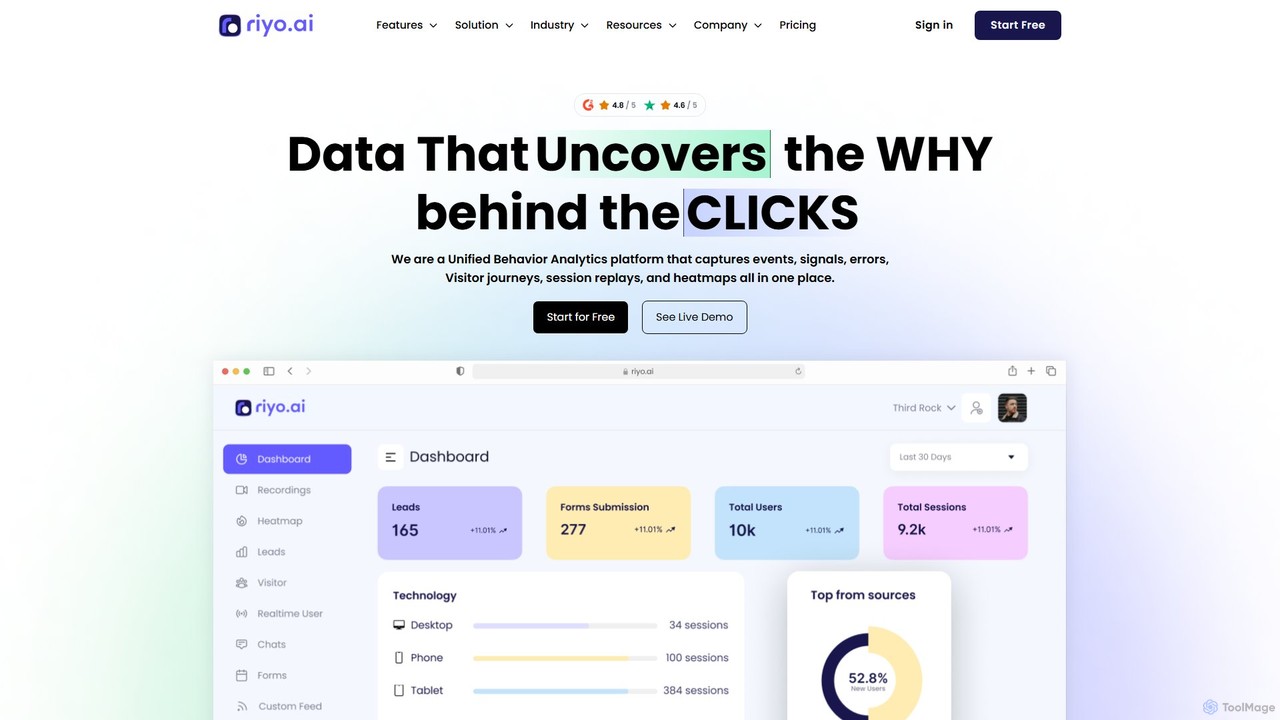
riyo.ai is a unified behavior analytics platform that combines session replays, heatmaps, error tracking, and product analytics. It …
riyo.ai is a unified behavior analytics platform that combines session replays, heatmaps, error tracking, and product analytics. It helps businesses understand user behavior, optimize the customer journey, and increase conversion rates by revealing the 'why' behind every click.
About Behavioral Analytics
Behavioral Analytics tools are a specialized category of analytics platforms designed to capture and analyze the 'why' behind user actions on websites and applications. They go beyond traditional metrics like page views by using techniques such as session recordings, heatmaps, and user journey mapping to provide deep insights into user engagement and friction points. This allows product teams, marketers, and UX designers to understand user intent, optimize conversion funnels, and improve the overall user experience. These tools transform raw interaction data into visual, actionable intelligence.
Core Features
- Session Replays: Watch video-like recordings of individual user sessions to see exactly how they interact with your site or app.
- Heatmaps: Visualize user behavior with maps showing where users click, move their mouse, and scroll on a page.
- Funnel Analysis: Track user progression through key steps (e.g., signup, checkout) to identify where they drop off.
- User Journey Mapping: Visualize the complete, often non-linear, paths users take across your platform over time.
- Cohort Analysis: Group users based on shared characteristics or behaviors to understand retention and long-term engagement.
Use Cases
These tools are widely used by SaaS companies, e-commerce businesses, and digital agencies. Product managers use them to validate new features and identify usability issues. UX/UI designers rely on them to test design hypotheses and improve navigation. Marketers analyze user paths to optimize landing pages and campaign performance.
How to Choose
When selecting a Behavioral Analytics tool, consider the scope of data collection—does it support both web and mobile? Evaluate its integration capabilities with other analytics or CRM systems. Assess the user interface for ease of use and data visualization clarity. Finally, consider the pricing model, which is often based on traffic volume or the number of recorded sessions, and ensure it aligns with your budget and growth projections.
Behavioral AnalyticsUse Cases
Optimizing E-commerce Checkout Funnel
An e-commerce product manager notices a high cart abandonment rate. Using a behavioral analytics tool, they set up a funnel to track users from 'Add to Cart' to 'Purchase Complete'. By watching session replays of users who drop off, they discover a confusing shipping address form is causing frustration. Heatmaps confirm that users are repeatedly clicking on a non-interactive element. Based on this visual evidence, the team redesigns the form, leading to a measurable decrease in abandonment and an increase in conversions.
Improving SaaS Feature Adoption
A SaaS product team launches a new, powerful feature but sees low adoption rates. Using a behavioral analytics tool, they analyze the user journeys of both power users and those who haven't engaged with the feature. They discover that most users miss the entry point for the new feature. By creating a cohort of new users, they also see that the in-app onboarding tour doesn't effectively highlight it. The team then implements a more prominent call-to-action and updates the onboarding, leading to a significant lift in feature discovery and usage.
Validating UX Design Changes
A UX designer proposes a redesign of a mobile app's main navigation to simplify the user experience. Before committing development resources, the team wants to validate the hypothesis. They use a behavioral analytics tool to analyze how users currently interact with the navigation. After launching the new design to a small segment of users, they compare heatmaps and user flow data between the old and new versions. The data clearly shows that the new design reduces the number of taps to reach key features and decreases user confusion, providing quantitative evidence to roll out the change to all users.
Analyzing Landing Page Performance
A digital marketer creates a new landing page for a major campaign but is unsure about its effectiveness. They use a behavioral analytics tool to monitor user interactions. Scroll maps reveal that 70% of visitors don't scroll past the fold to see the primary call-to-action. Click maps show that users are clicking on an image that isn't hyperlinked. By watching session replays, the marketer observes users appearing lost and quickly leaving. Armed with these insights, they move the CTA above the fold and link the popular image, resulting in a significant increase in lead generation from the page.
Identifying and Fixing Rage Clicks
A support team notices a recurring complaint about a specific workflow in their application. To investigate, a product analyst filters for 'rage clicks'—instances where users rapidly click on an element out of frustration. The behavioral analytics tool quickly surfaces dozens of session replays showing users repeatedly clicking a disabled button. The analyst realizes the UI doesn't clearly communicate why the button is disabled. They share a video clip of a session replay with the development team, who then adds a tooltip explaining the requirement to activate the button, resolving the user friction and reducing support tickets.
Understanding User Retention with Cohorts
A mobile game developer wants to understand what keeps players coming back. They use cohort analysis to group players by their sign-up week and track their retention over time. They notice that players who signed up during 'Week 3', when a special event was running, have a 15% higher retention rate after 30 days. By analyzing the behavior of this specific cohort, they identify that engagement with the event's daily challenges was a key factor. This insight allows them to incorporate similar mechanics into the core game loop to improve long-term retention for all new players.