ga4sql
ga4sql is a free, user-friendly tool that empowers marketers and analysts to generate Google Analytics 4 (GA4) BigQuery …
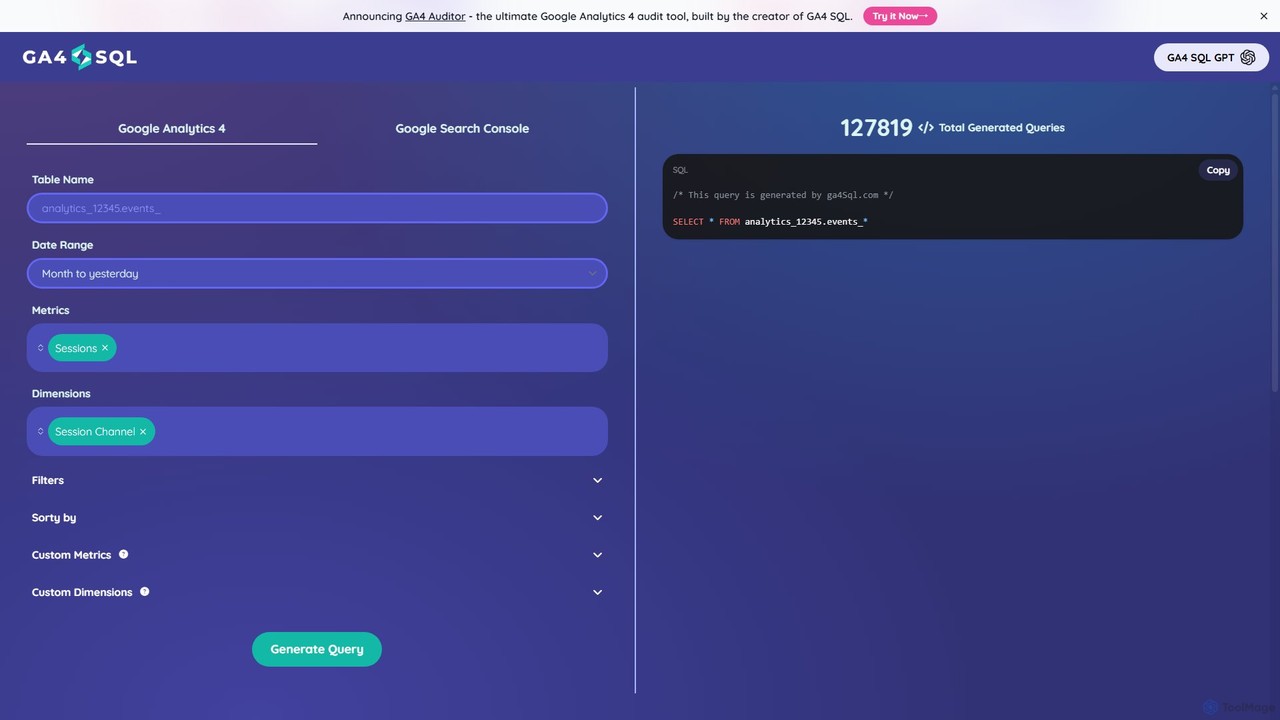
ga4sql is a free, user-friendly tool that empowers marketers and analysts to generate Google Analytics 4 (GA4) BigQuery queries without any SQL knowledge. Simply select your desired metrics, dimensions, and date range through an intuitive interface, and the tool instantly creates the correct SQL query. It's the fastest way to unlock deep insights from your GA4 data in BigQuery, saving time and eliminating coding errors.
About Business Intelligence
Business Intelligence (BI) tools are a class of AI-powered software that transform raw data into actionable insights for strategic decision-making. They connect to various data sources, process large datasets, and present findings through interactive dashboards, reports, and visualizations. This enables organizations to monitor key performance indicators (KPIs), identify trends, and understand business performance in real-time. Unlike broader data analytics platforms, BI tools focus specifically on descriptive analytics—what happened and what is happening now—making complex data accessible to non-technical users.
Core Features
- Interactive Dashboards: Create customizable, real-time visualizations of key business metrics.
- Automated Reporting: Schedule and automatically generate regular reports on business performance.
- Data Source Integration: Connect seamlessly with databases, cloud services, spreadsheets, and APIs.
- Natural Language Querying (NLQ): Ask questions in plain language and receive visualized answers without writing code.
- Ad-Hoc Analysis: Explore data freely to answer specific, unplanned business questions on the fly.
Use Cases
BI tools are widely used by business analysts, marketing managers, sales teams, and executives across industries like retail, finance, and healthcare. For example, a marketing team uses a BI dashboard to track campaign ROI in real-time, while an operations manager monitors supply chain efficiency to identify bottlenecks.
How to Choose
When selecting a BI tool, consider its data connectivity options to ensure it supports your existing systems. Evaluate the user interface for ease of use, especially for non-technical team members. Assess its scalability to handle growing data volumes and user numbers, and check the variety and quality of its visualization capabilities.
Business IntelligenceUse Cases
Real-Time Sales Performance Tracking
A sales manager connects a BI tool to their CRM (like Salesforce) and internal sales databases. They create a centralized dashboard displaying key metrics such as sales by region, revenue per representative, and progress towards quarterly quotas. This provides an immediate, visual overview of performance, allowing the manager to identify top-performing strategies and pinpoint underperforming areas for targeted coaching, all without waiting for weekly static reports.
Marketing Campaign ROI Analysis
A marketing team integrates data from Google Ads, Facebook Ads, and their web analytics platform into a BI tool. They build a dashboard to visualize campaign spend versus conversions, customer acquisition cost (CAC) by channel, and lead source effectiveness. This allows them to move beyond simple metrics and understand the true ROI of their efforts, enabling data-driven decisions on budget allocation and optimizing future campaigns for better performance.
Operational Efficiency Monitoring
An operations manager in a manufacturing plant uses a BI tool to pull data from production line sensors, inventory systems, and logistics software. The resulting dashboard tracks metrics like production uptime, defect rates, and order fulfillment times. By visualizing this data in real-time, the manager can quickly spot anomalies, such as a machine underperforming or a bottleneck in the supply chain, and take corrective action to minimize downtime and reduce costs.
Executive Financial Health Dashboard
A CFO or CEO uses a BI tool to create a high-level financial dashboard. It consolidates data from accounting software, ERP systems, and sales platforms to display key financial health indicators like revenue trends, profit margins, and cash flow in one place. This allows executives to get an at-a-glance understanding of the company's performance without sifting through multiple complex spreadsheets, facilitating faster, more informed strategic planning and board meetings.
Analyzing Customer Behavior Patterns
An e-commerce product manager uses a BI tool to analyze customer interaction data from their website and mobile app. By visualizing user journeys, purchase funnels, and feature adoption rates, they can identify where customers drop off in the buying process or which features are most popular. These insights directly inform product development priorities, UI/UX improvements, and targeted marketing efforts to enhance customer retention and increase conversion rates.
Human Resources Workforce Analytics
An HR department uses a BI tool to connect to their HRIS (Human Resource Information System) and recruitment platforms. They create dashboards to monitor key workforce metrics like employee turnover rates by department, time-to-hire for open positions, and employee satisfaction scores from surveys. This data-driven approach helps HR identify trends in workforce management, improve retention strategies, and make more informed decisions about talent acquisition and development.