Raven
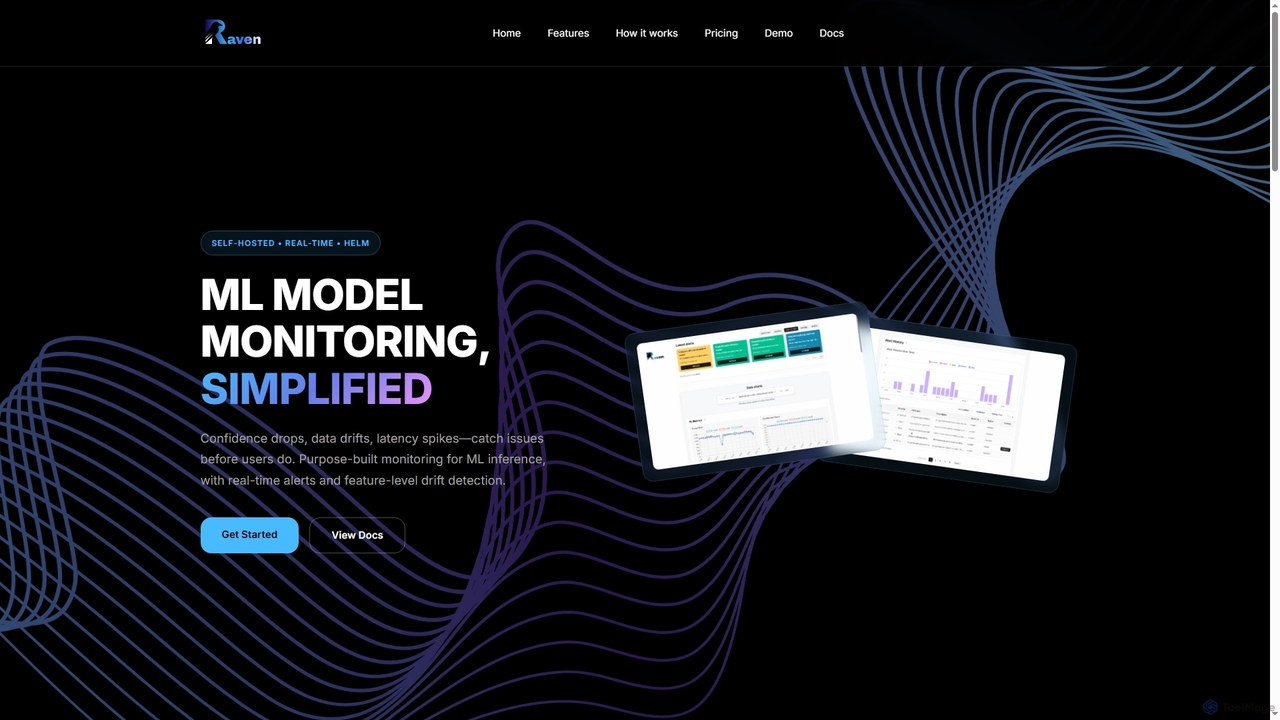
Raven is a self-hosted, real-time ML model monitoring platform designed to simplify observability for AI pipelines. It detects …
Raven is a self-hosted, real-time ML model monitoring platform designed to simplify observability for AI pipelines. It detects data drift, latency spikes, and confidence drops, providing instant alerts to ensure model reliability and performance in production environments.
Observo AI
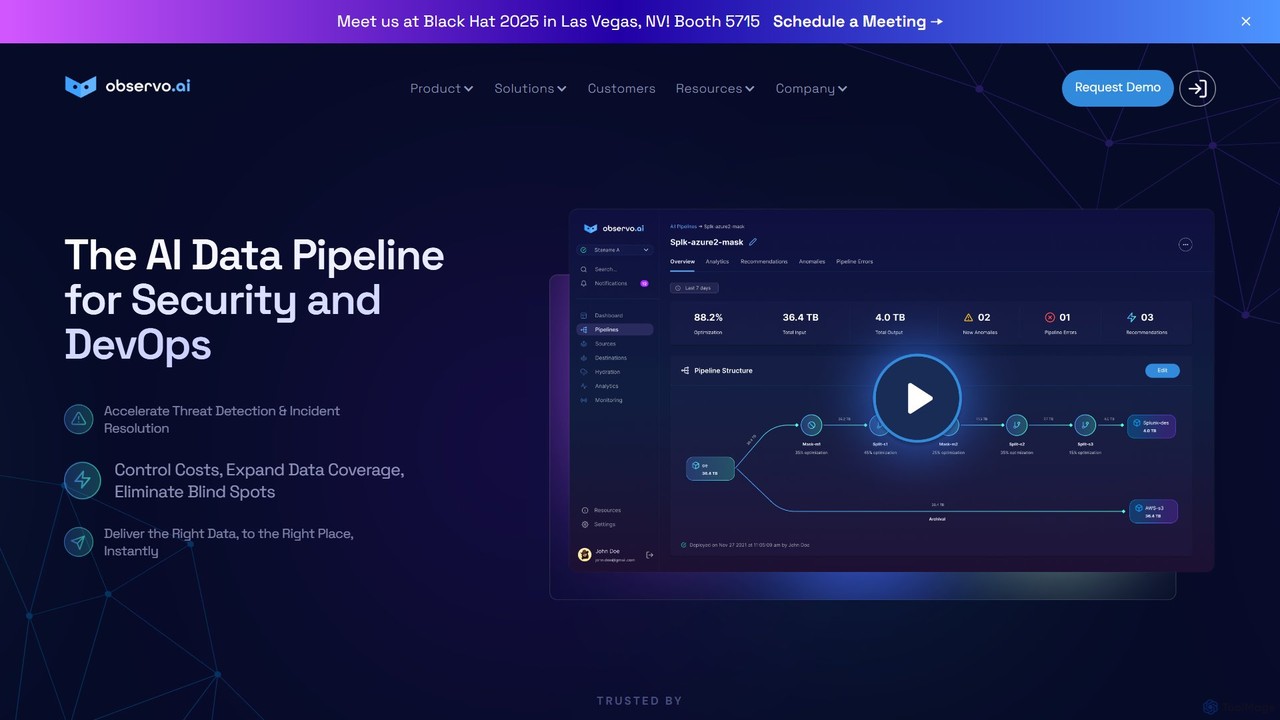
Observo AI is an intelligent data pipeline platform for Security and DevOps teams. It uses AI to optimize …
Observo AI is an intelligent data pipeline platform for Security and DevOps teams. It uses AI to optimize telemetry data, reducing log volumes by up to 80% and observability costs by over 50%. The platform accelerates threat detection, enriches data in real-time, and eliminates blind spots, making security and operations more efficient and cost-effective.
About Observability
Observability AI tools are advanced platforms that leverage artificial intelligence and machine learning to provide deep insights into the internal state of complex software systems, infrastructure, and AI models. These tools automate the collection, correlation, and analysis of telemetry data—logs, metrics, and traces—from distributed environments. By transforming raw data into actionable intelligence, they enable engineering and operations teams to proactively identify performance bottlenecks, diagnose issues, and predict potential failures, ensuring system reliability and optimal user experience within a DevOps framework.
Core Features
- Automated Telemetry Collection: Gathers logs, metrics, and traces from diverse sources across hybrid and multi-cloud environments.
- AI-Powered Anomaly Detection: Automatically identifies unusual patterns and deviations from normal system behavior, reducing alert fatigue.
- Distributed Tracing & Root Cause Analysis: Visualizes end-to-end transaction flows and correlates events to quickly pinpoint the origin of performance issues.
- Predictive Analytics: Uses machine learning to forecast future system performance and potential outages based on historical data.
- Intelligent Alerting & Incident Management: Generates context-rich alerts and integrates with incident response workflows for faster resolution.
Use Cases
DevOps teams and site reliability engineers (SREs) utilize Observability AI tools to maintain high availability and performance of critical applications. They are essential for monitoring microservices architectures, serverless functions, and containerized deployments, providing a unified view of system health. These tools also help in optimizing resource utilization and ensuring compliance in highly regulated industries.
How to Choose
When selecting an Observability AI tool, consider its data ingestion capabilities across your technology stack, the sophistication of its AI/ML algorithms for anomaly detection and root cause analysis, and its integration with existing DevOps tools and workflows. Evaluate its scalability to handle growing data volumes, the clarity of its visualization dashboards, and its pricing model based on data consumption or monitored entities. Look for robust security features and compliance certifications.
ObservabilityUse Cases
Proactive Anomaly Detection in Microservices
A Site Reliability Engineer (SRE) uses an Observability AI tool to continuously monitor hundreds of microservices in a cloud-native application. The AI automatically learns baseline behaviors and flags subtle anomalies in response times or error rates that human monitoring might miss. This allows the SRE to investigate and resolve potential issues before they escalate into widespread outages, maintaining service level objectives (SLOs).
Accelerating Root Cause Analysis for Production Incidents
During a critical production incident, a DevOps team leverages the distributed tracing and AI-driven correlation features of an Observability platform. The tool automatically links logs, metrics, and traces across multiple services and infrastructure components, visually pinpointing the exact service or code change that caused the degradation. This drastically reduces mean time to resolution (MTTR) from hours to minutes.
Optimizing Cloud Resource Utilization and Costs
A cloud architect employs Observability AI to analyze resource consumption patterns (CPU, memory, network I/O) across their entire cloud infrastructure. The AI identifies underutilized resources and provides recommendations for rightsizing instances or optimizing auto-scaling rules. This leads to significant cost savings by eliminating wasteful spending on over-provisioned cloud services without impacting performance.
Monitoring AI Model Performance and Drift
Data scientists and MLOps engineers use Observability tools specifically tailored for AI models to track inference latency, data drift, and model accuracy in production. The AI detects when model predictions start to deviate from expected behavior or when input data changes significantly. This ensures that AI models remain effective and fair over time, triggering retraining or intervention when necessary.
Ensuring Compliance and Security Posture
A security operations team integrates an Observability platform to monitor system logs and network traffic for suspicious activities and compliance violations. The AI engine identifies unusual access patterns, unauthorized configuration changes, or potential data exfiltration attempts. This provides real-time threat detection and audit trails, helping organizations meet regulatory requirements like GDPR or HIPAA.
Improving User Experience by Identifying Frontend Bottlenecks
A product development team utilizes Observability AI to gain insights into real user monitoring (RUM) data, correlating frontend performance metrics with backend service health. The tool identifies specific user journeys where slow loading times or errors occur, tracing them back to inefficient API calls or frontend code issues. This enables targeted optimizations that directly enhance the end-user experience.