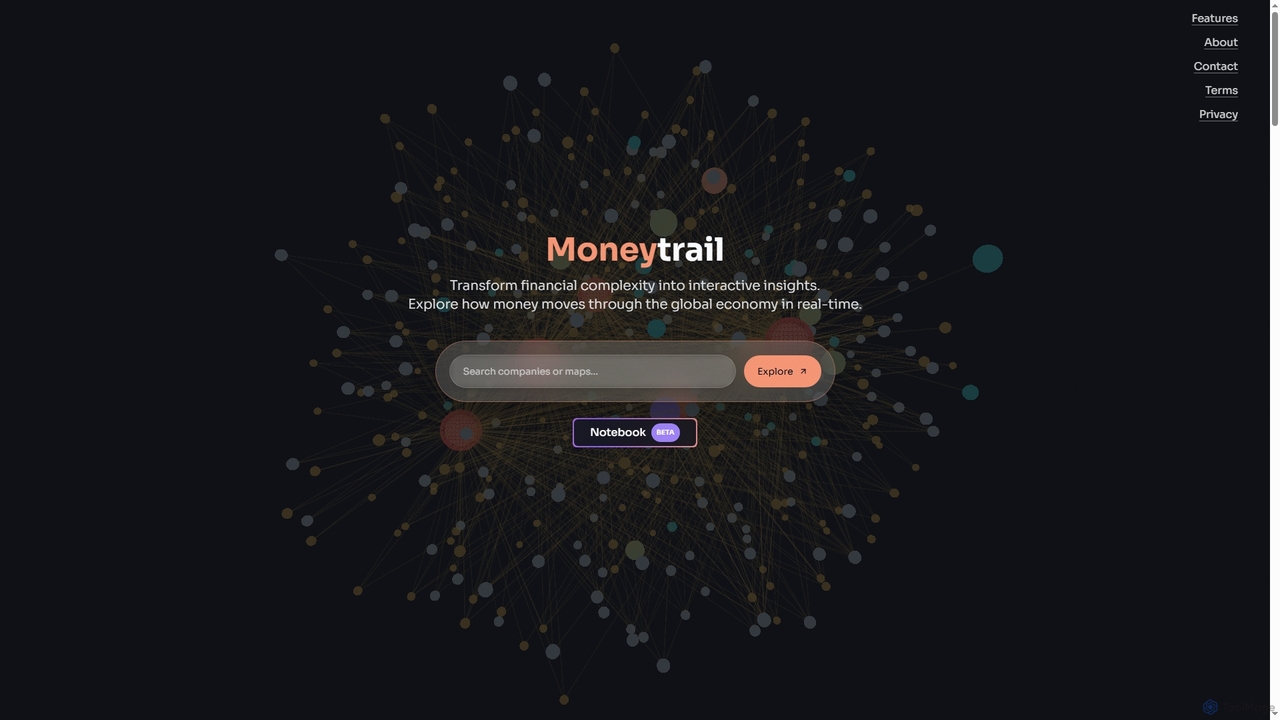
Moneytrail
Moneytrail is an interactive visualization platform that transforms complex financial data into clear insights. It allows users to …
Moneytrail is an interactive visualization platform that transforms complex financial data into clear insights. It allows users to explore the real-time flow of money through the global economy by mapping connections, ownership structures, and contract relationships between companies, governments, and institutions.
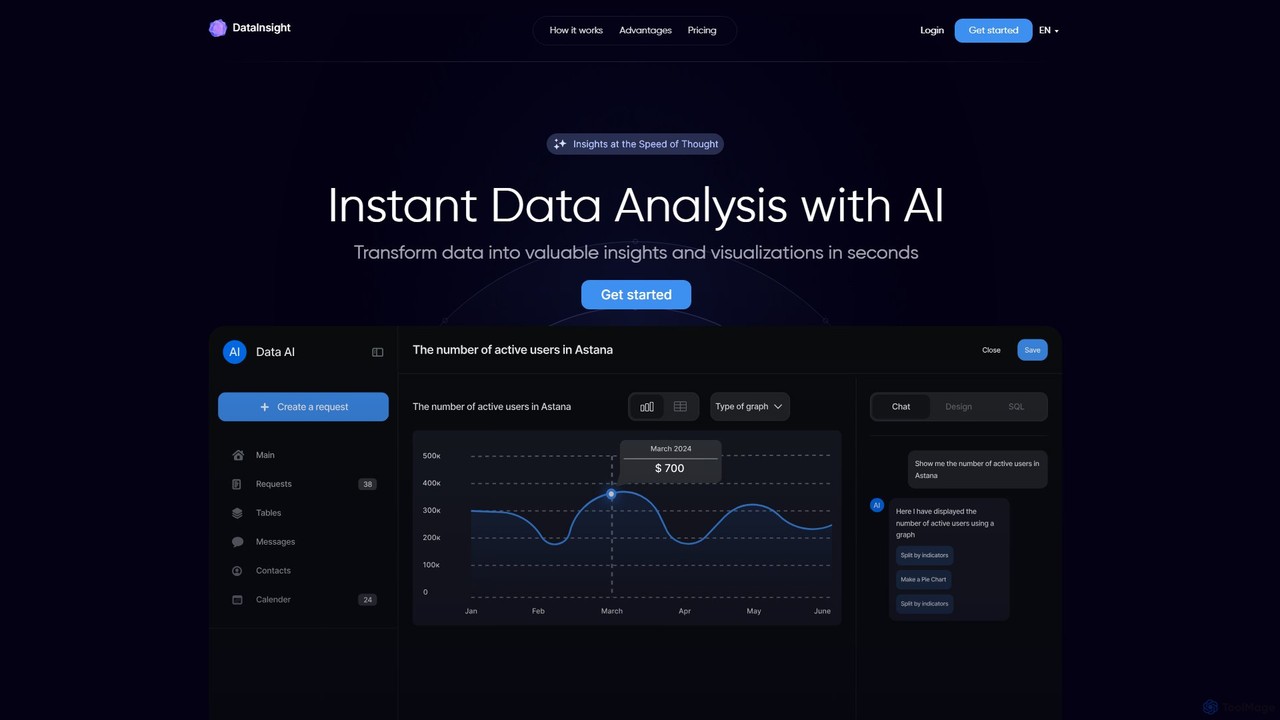
DataInsight
DataInsight is an AI-powered platform that transforms your business data into actionable insights and visualizations in seconds. Connect …
DataInsight is an AI-powered platform that transforms your business data into actionable insights and visualizations in seconds. Connect your databases like Postgres, MySQL, and BigQuery, and ask questions in plain English to receive instant answers. Generate custom graphs and tables, export reports, and replace the need for multiple analytics tools or a dedicated data analyst. It's a fast, secure, and cost-effective solution for data-driven decision-making.
About Data Visualization
Data Visualization AI tools are designed to transform complex financial datasets into intuitive, interactive visual representations. Leveraging advanced AI algorithms, these tools automate the creation of charts, graphs, and dashboards, revealing hidden patterns and trends. They empower financial analysts, investors, and decision-makers to quickly grasp market dynamics, risk exposures, and performance metrics, facilitating data-driven strategic planning and reporting.
Core Features
- Automated Chart Generation: Automatically creates various chart types from raw financial data.
- Anomaly Detection: Identifies unusual patterns or outliers in financial datasets using AI.
- Predictive Visuals: Generates visualizations based on AI-driven forecasts for future trends.
- Interactive Dashboards: Provides dynamic, customizable dashboards for real-time data exploration.
- Natural Language Query: Allows users to ask questions in plain language to generate visualizations.
Applicable Scenarios
These tools are crucial for financial professionals across various roles. Financial analysts use them for market trend analysis, investment managers for portfolio performance tracking, and risk officers for identifying potential exposures. They are also vital for corporate finance teams to visualize budget adherence and expense patterns, enhancing transparency and decision-making.
How to Choose
When selecting a Data Visualization AI tool, consider its compatibility with your existing financial data sources and its range of AI capabilities, such as automated insights and predictive analytics. Evaluate the customization options for dashboards, the ease of use, and the level of interactivity. Crucially, ensure the tool offers robust security features and complies with financial industry regulations for data privacy and integrity.
Data VisualizationUse Cases
Visualizing Investment Portfolio Performance
Investment managers utilize AI data visualization tools to monitor and analyze the performance of diverse portfolios. By integrating real-time market data, these tools automatically generate interactive dashboards displaying asset allocation, returns, and risk metrics. This enables managers to quickly identify underperforming assets, rebalance portfolios, and communicate complex performance insights to clients more effectively, saving hours in manual report generation.
Detecting Financial Anomalies and Fraud
Financial institutions employ AI data visualization to identify unusual patterns in transaction data that might indicate fraud or compliance breaches. The tools visualize large datasets, highlighting outliers and anomalies that human analysts might miss. This proactive visualization helps compliance officers and fraud detection teams to investigate suspicious activities rapidly, reducing potential financial losses and ensuring regulatory adherence.
Market Trend Analysis and Forecasting
Market researchers and strategists leverage these tools to visualize historical market data alongside predictive models. AI-powered visualizations can project future trends for stock prices, commodity movements, or consumer spending. This allows businesses to anticipate market shifts, optimize pricing strategies, and make informed decisions about product launches or market entry, enhancing competitive advantage.
Enhancing Financial Reporting for Stakeholders
CFOs and finance departments use AI data visualization to create clear, compelling financial reports for boards, investors, and regulators. Instead of static spreadsheets, dynamic dashboards present key financial statements, budget vs. actuals, and cash flow analysis in an easily digestible format. This improves transparency, facilitates quicker understanding of financial health, and supports more engaging presentations.
Personalizing Financial Advice and Planning
Financial advisors use these tools to present personalized financial plans and investment recommendations to individual clients. By visualizing a client's current financial situation, future goals, and potential investment outcomes, advisors can make complex concepts understandable. This helps clients make informed decisions about savings, retirement, and wealth management, fostering trust and improving client engagement.
Optimizing Budget Allocation and Expense Tracking
Corporate finance teams utilize AI data visualization to track and analyze departmental budgets and expenses. Interactive dashboards provide a real-time overview of spending patterns, identifying areas of overspending or potential savings. This enables finance managers to optimize resource allocation, enforce budget compliance, and make data-backed decisions for cost reduction initiatives across the organization.