Elementary Data
Observability
AI TOOL COMPARISON
What is the difference, and which fits your workflow? Compare features, usage, pricing models and traffic side by side.
Observability
Data Science
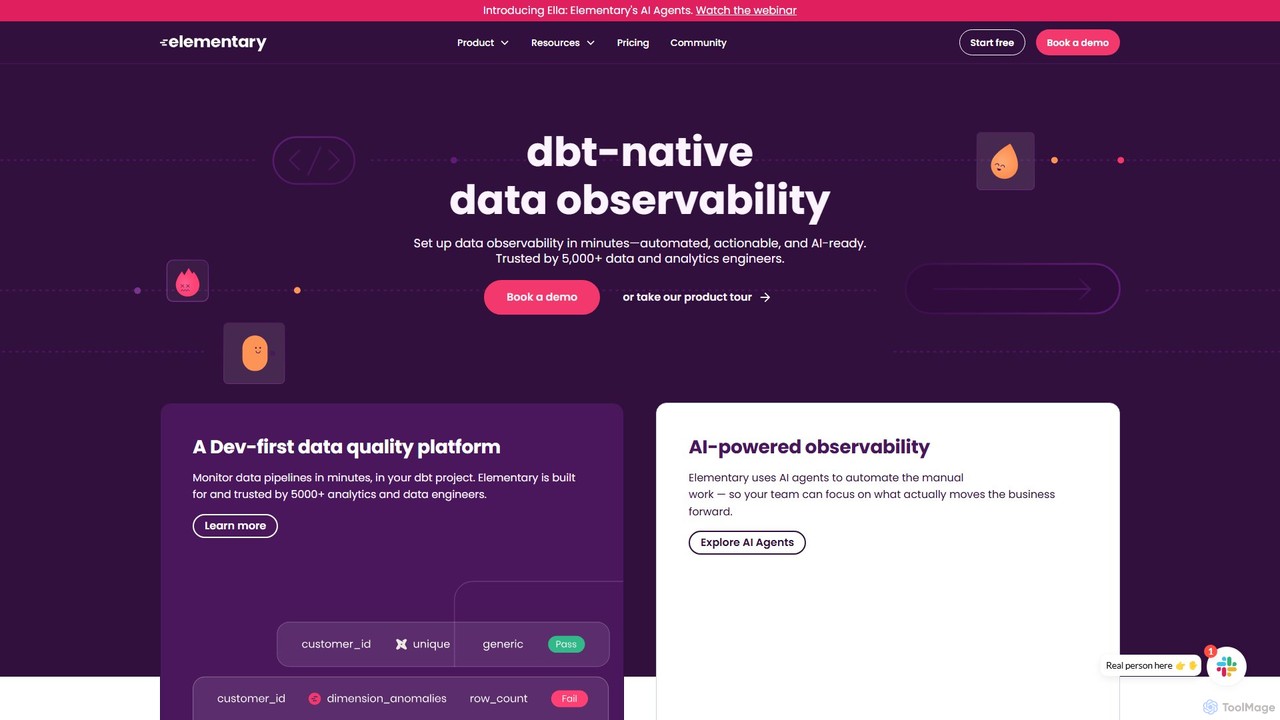
Elementary Data is a dbt-native data observability platform designed for data and analytics engineers. It uses AI agents to automate data quality monitoring, detect anomalies, and provide end-to-end lineage. The platform helps teams reduce alert noise, resolve incidents faster, and build trust in their data for AI and analytics applications.
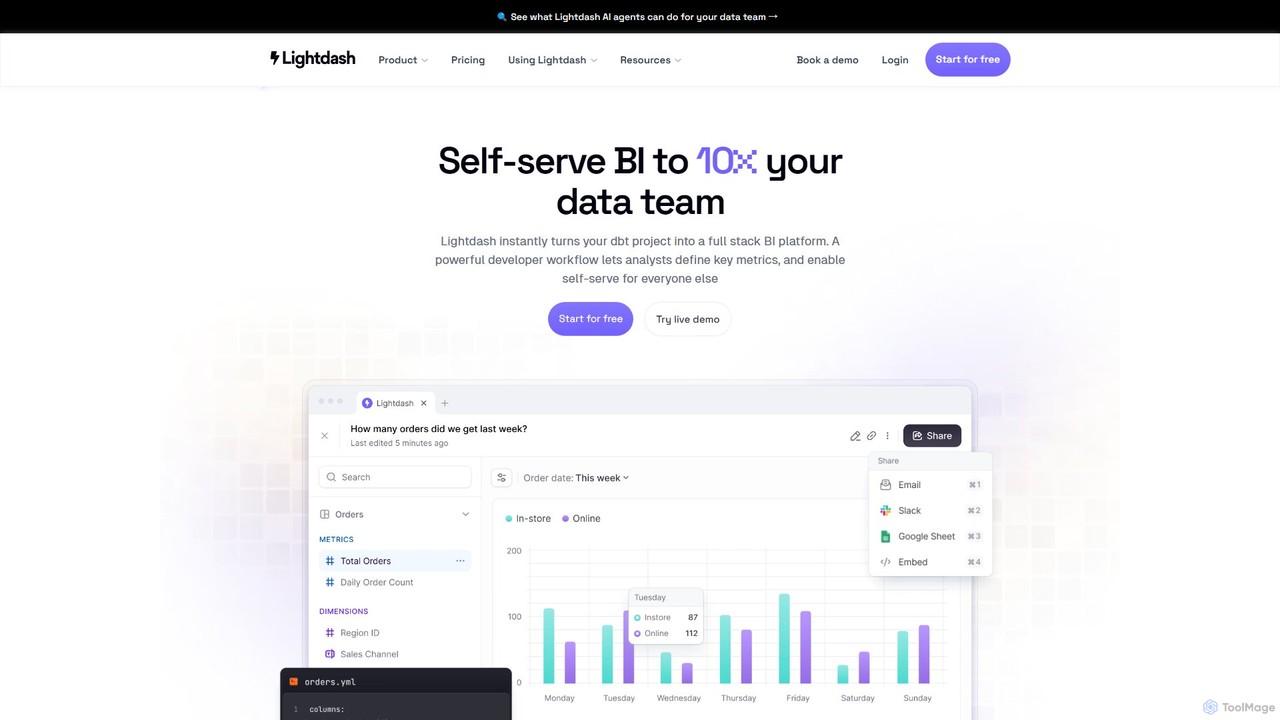
Lightdash is an open-source, AI-powered business intelligence (BI) platform built specifically for dbt. It empowers entire teams with self-serve analytics, allowing users to ask data questions in plain English. With developer-friendly workflows and no per-user pricing, it's designed to make data accessible to everyone, from data engineers to business stakeholders.
Compare product focus, pricing models and audiences. Highlighted rows indicate different listed information; unknown pricing does not mean free.
| Quick facts | Elementary Data | Lightdash |
|---|---|---|
| Pricing model | Freemium | Freemium |
| Product type | Web | Web |
| Primary focus | Observability | Data Science |
| Audience and roles | No data available | No data available |
| Categories | Observability · Data Management · Analytics | Data Science · Business Intelligence · Data Analysis · Analytics |
| Added | Aug 12, 2025 | Aug 2, 2025 |
| Updated | Nov 19, 2026 | Nov 19, 2026 |
Explore the listed product descriptions, features and workflows. Taxonomy labels alone are not feature evaluations.
Elementary Data is a developer-first, dbt-native data observability platform trusted by thousands of data and analytics engineers. It is designed to operationalize data quality across the entire data lifecycle, from detection to resolution. By leveraging AI agents, Elementary automates manual tasks, allowing data teams to focus on high-impact activities that drive business value. The platform addresses the critical challenge of data quality, which is often the primary blocker to successful AI implementation and data product adoption, ensuring that bad inputs do not lead to broken models or untrustworthy decisions.
Getting started with Elementary Data is designed to be quick and seamless, especially for teams already using dbt. The process typically involves:
Elementary Data is versatile and supports various data-driven initiatives. For example, a company like Flock Safety used Elementary to establish a practical data governance program. By focusing on data quality and discovery, they built trust among business partners and analytics engineers. This led to increased data consumption, better collaboration, and more reliable decision-making. Other use cases include:
The primary advantage of Elementary is its deep, native integration with the dbt ecosystem, making it a natural choice for modern data teams. Its developer-first approach ensures it fits seamlessly into existing workflows. The use of AI agents for automation significantly reduces manual effort and improves team efficiency. Furthermore, its comprehensive coverage of the entire data quality lifecycle—from testing and monitoring to incident resolution and governance—makes it an all-in-one solution. The platform is secure by design, never accessing raw data, and offers both a powerful open-source version and scalable cloud plans for enterprises.
Elementary offers a flexible pricing model based on user seats, with a free open-source option and paid cloud plans. A 30-day free trial of the Essentials plan is available.
Lightdash is a modern, open-source business intelligence (BI) platform designed to work seamlessly with dbt (data build tool). It bridges the gap between powerful data transformation and accessible data exploration, creating a single source of truth for metrics and insights. The platform is built on the principle that data should be available to everyone in an organization, not just a select few. It achieves this through an intuitive user interface, powerful developer tools, and a revolutionary AI Analyst feature.
At its core, Lightdash leverages your existing dbt project to define a semantic layer. This means all your business logic, metrics, and dimensions are defined once in code, version-controlled in Git, and then made available across the entire organization. This approach eliminates data silos and ensures consistency in reporting. For data consumers, Lightdash offers a no-SQL, self-service environment where they can build reports, create interactive dashboards, and explore data with ease. For data teams, it provides a robust set of tools that align with software engineering best practices, including CI/CD integration, a powerful CLI, and staging environments.
Getting started with Lightdash is a streamlined process designed for modern data teams. First, you connect Lightdash to your dbt project and your data warehouse (like BigQuery, Snowflake, or Redshift). Lightdash automatically reads your dbt models and metrics, creating the foundation for your BI platform. Data teams can then refine the semantic layer, adding dimensions and metrics directly within their dbt project files. Using developer previews and CI/CD workflows, they can test changes in a staging environment before promoting them to production, ensuring data quality and governance. Once set up, business users can log in and start exploring. They can use the intuitive report builder to drag and drop fields, apply filters, and visualize data without writing a single line of SQL. Alternatively, they can use the 'AI Analyst' feature by simply asking questions in plain English, such as "What were our top 10 selling products last quarter?", and Lightdash's AI will generate the corresponding report and visualization. Insights can be shared via Slack, email, or embedded directly into other applications.
Lightdash is versatile and can be applied across various business functions. For example, a marketing team can use it to build self-serve dashboards to track campaign performance and customer acquisition costs. A sales team can ask the AI Analyst for real-time updates on their pipeline and conversion rates. Product teams can embed usage analytics directly into their application, providing valuable insights to their customers. For leadership, Lightdash provides a high-level view of key business metrics, all sourced from a governed and trusted data model. It's also ideal for companies looking to migrate from expensive, legacy BI tools like Looker, offering a more flexible and cost-effective solution.
The primary advantage of Lightdash is its unique combination of developer power and business user accessibility. By being dbt-native, it ensures that analytics are built on a solid, governed foundation. The 'unlimited users' pricing model is a significant differentiator, removing barriers to data access and encouraging a data-informed culture. The AI Analyst feature democratizes data analysis further, empowering every team member to answer their own questions. Being open-source offers unparalleled transparency and customizability, while the cloud offering provides a fully managed, scalable solution with world-class support.
Lightdash offers several pricing tiers to suit different needs, all with unlimited users:
Their taxonomy shows where the products overlap and where each one has a more distinct focus. Unknown fields are shown explicitly and are never filled with assumptions.
Traffic is shown on the same scale so differences in market visibility are not visually understated.
Both charts share the same months and vertical scale. Each tool identifies its latest reporting month; missing months are left blank, not counted as zero. Regional and source visit counts are estimates calculated from the reported shares.
| Country/region | Percentage | Estimated visits |
|---|---|---|
| 🇺🇸United States | 48.18% | 7.7K |
| 🇩🇪Germany | 25.01% | 4K |
| 🇧🇷Brazil | 11.23% | 1.8K |
| 🇮🇳India | 8.01% | 1.3K |
| 🇫🇷France | 7.57% | 1.2K |
| Country/region | Percentage | Estimated visits |
|---|---|---|
| 🇮🇳India | 50.59% | 23.2K |
| 🇺🇸United States | 26.22% | 12K |
| 🇬🇧United Kingdom | 11.35% | 5.2K |
| 🇩🇪Germany | 6.43% | 3K |
| 🇧🇷Brazil | 5.41% | 2.5K |
| Source type | Percentage | Estimated visits |
|---|---|---|
| Direct | 81.31% | 37.3K |
| Referral | 17.97% | 8.3K |
| 0.72% | 331 |
Ratings, comments, favorites, and likes are community signals—not a substitute for product fit.
This page is assembled from ToolMage product listings, taxonomy, traffic statistics and on-site user feedback. It is not a hands-on test or an independent review.