Infography
vs
MyLens
A comprehensive comparison of the core features, performance, user experience, and pricing strategies of two excellent AI tools
Providing objective and detailed selection advice based on real data and user feedback
Overview
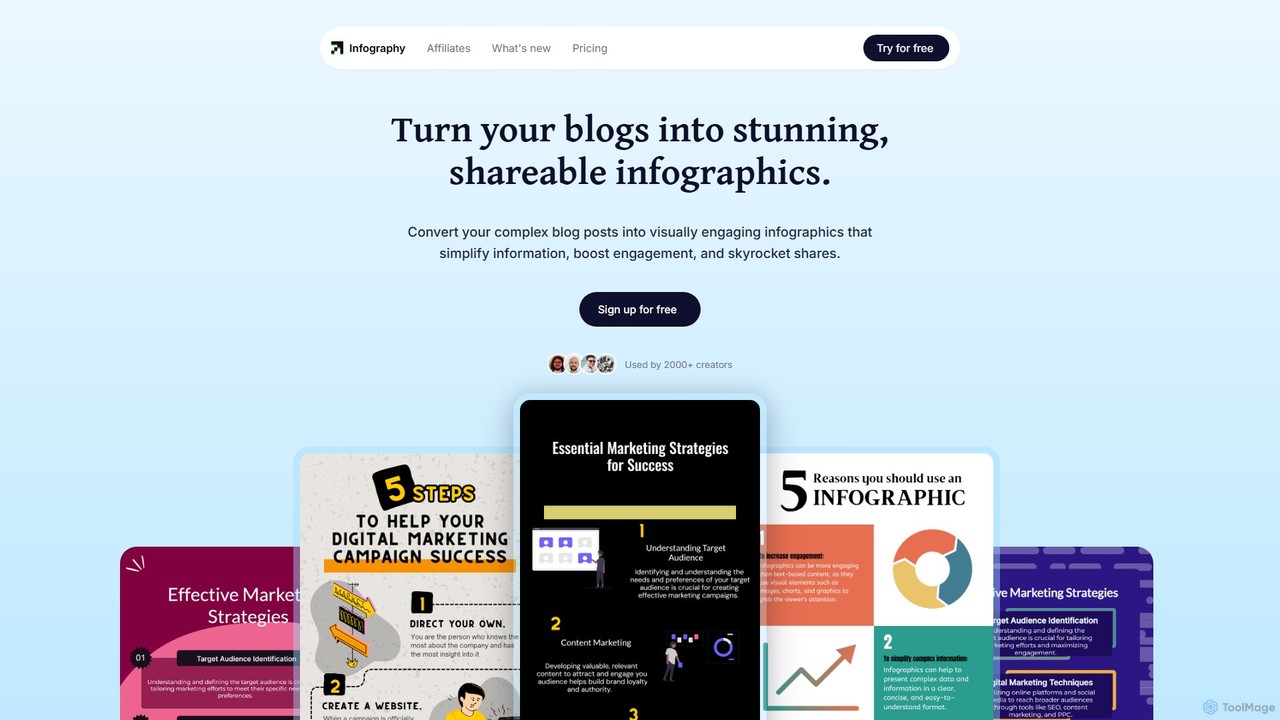
Infography Overview
Instantly convert your blog posts, articles, or text into stunning, shareable infographics with Infography's AI. Boost engagement, save time, and enhance your content marketing.
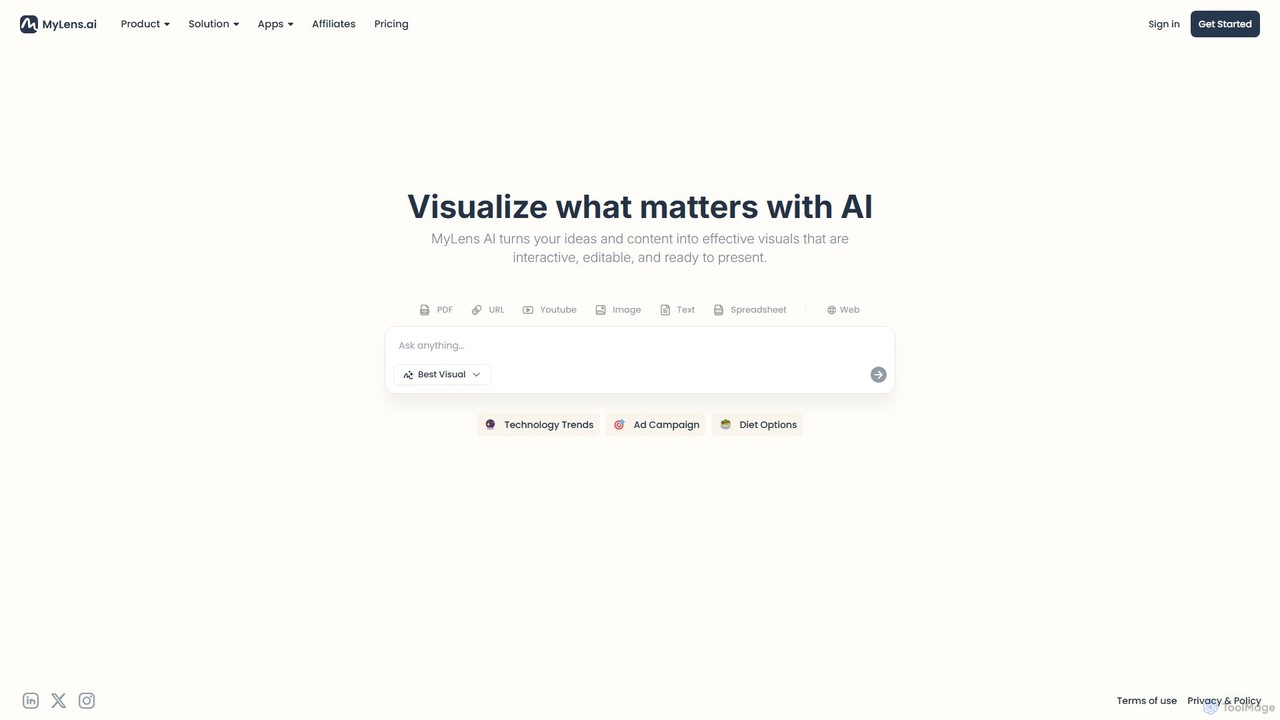
MyLens Overview
Turn your ideas and data into stunning, interactive visuals with MyLens AI. Create professional presentations, infographics, charts, and diagrams in minutes. No design skills required.
Detailed Feature Comparison
Comprehensive comparison of the core features and characteristics of two AI tools
| Features | Infography | MyLens |
|---|---|---|
| Main Categories | Content Creation | Presentations |
| Inclusion Date | 2025-08-09 | 2025-08-07 |
| Pricing Type | Freemium | Freemium |
| Official Website | https://www.infography.in/ | https://mylens.ai/ |
| Tool Type | Website | Website |
| Performance Data | ||
| User Rating | No Rating Yet | No Rating Yet |
| User Reviews | 0 reviews | 0 reviews |
| Monthly Visits | 29.2K | 160.3K |
| Details | View Details | View Details |
Compare Traffic / Monthly Visits
Infography's traffic
Infography Current monthly visible visits are 29.2K.
Latest Traffic
Monthly Traffic Trend
Geography
Top 5 Countries/Regions
| Country/Region | Percentage | Traffic |
|---|---|---|
|
🇨🇴
Colombia
|
26.98% | 7.9K |
|
🇲🇽
Mexico
|
25.91% | 7.6K |
|
🇻🇳
Vietnam
|
18.51% | 5.4K |
|
🇺🇸
United States
|
16.65% | 4.9K |
|
🇮🇳
India
|
11.95% | 3.5K |
Traffic source
| Source Type | Percentage | Traffic |
|---|---|---|
|
Direct Access
|
50.86% | 14.8K |
|
Referral
|
49.14% | 14.3K |
Popular Keywords
MyLens's traffic
MyLens Current monthly visible visits are 160.3K.
Latest Traffic
Monthly Traffic Trend
Geography
Top 5 Countries/Regions
| Country/Region | Percentage | Traffic |
|---|---|---|
|
🇺🇸
United States
|
50.86% | 81.5K |
|
🇮🇳
India
|
17.93% | 28.7K |
|
🇨🇦
Canada
|
12.51% | 20.1K |
|
🇦🇺
Australia
|
10.77% | 17.3K |
|
🇮🇩
Indonesia
|
7.93% | 12.7K |
Traffic source
| Source Type | Percentage | Traffic |
|---|---|---|
|
Direct Access
|
77.35% | 124.0K |
|
Referral
|
15.84% | 25.4K |
|
Email
|
6.81% | 10.9K |
Popular Keywords
Usage Comparison
Compare Infography and MyLens 's Advantages
Infography's Core Features
MyLens's Core Features
Use Cases
Understand the specific application scenarios and functional characteristics of the two AI tools
Infography Use Cases
MyLens Use Cases
Infography vs MyLens:In-depth Comparison Analysis and Selection Recommendations
Comprehensive comparison and evaluation based on real data and user feedback
Market Performance and User Preference Analysis
- Core positioning: Infography leans more toward Content Creation, while MyLens leans more toward Presentations.
- Traffic Signal: MyLens currently has higher monthly traffic, serving as a reference for market attention.
- Neither tool has reviewed ratings yet; it is recommended to prioritize comparing functional positioning, price, and actual trial experience.
MyLens has about 160.3K monthly visits, higher than Infography at 29.2K. Use this as a signal of market attention, not as product quality by itself.
In-depth Analysis of User Engagement
Both tools have third-party traffic analysis records, allowing comparison of visits, dwell time, pages per visit, and bounce rate; these metrics should be considered alongside the tool's purpose.
User Reviews vs. Community Feedback
Infography has no reviewed ratings yet. MyLens has no reviewed ratings yet.
Product Positioning and Application Scenario Analysis
Infography is in Content Creation with a Freemium pricing model; MyLens is in Presentations with a Freemium pricing model. Prioritize fit for your specific tasks rather than traffic or default ratings alone.
Frequently Asked Questions
FAQs about these two tools to help you better understand their features and differences
What are the biggest differences between the two?
Infography is primarily positioned in Content Creation, while MyLens is primarily positioned in Presentations. Which one suits you depends on which type of use case and workflow you need more.
Which tool is better to try first?
MyLens currently has higher market attention, making it suitable for initial understanding; the final decision should still be based on specific functional needs after trial.
How should ratings and traffic data be interpreted?
Ratings only count reviewed user comments; no default 5-star rating is given when there are no comments. Traffic is used to gauge market attention but cannot solely represent product quality.
Related Tool Recommendations
Discover more excellent AI tools of the same kind
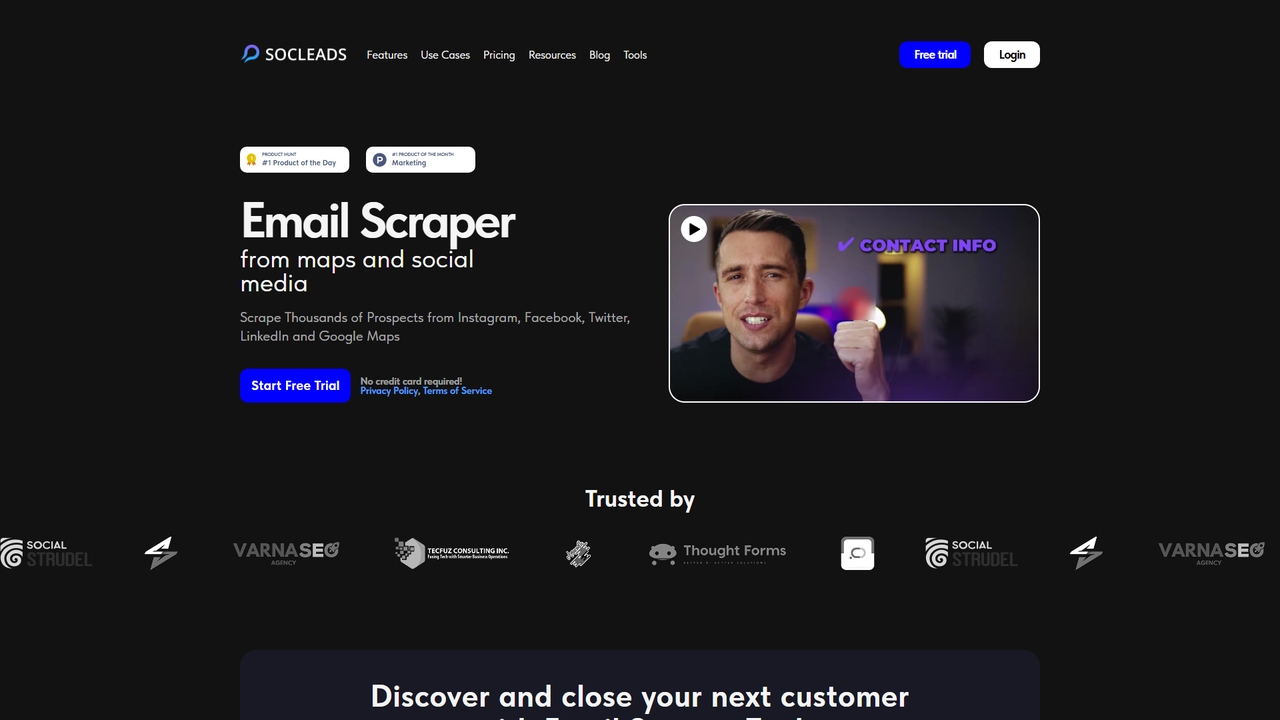
SocLeads
SocLeads is a no-code email scraping tool that extracts verified leads from social media platforms and Google Maps …
SocLeads is a no-code email scraping tool that extracts verified leads from social media platforms and Google Maps for targeted outreach and marketing campaigns.
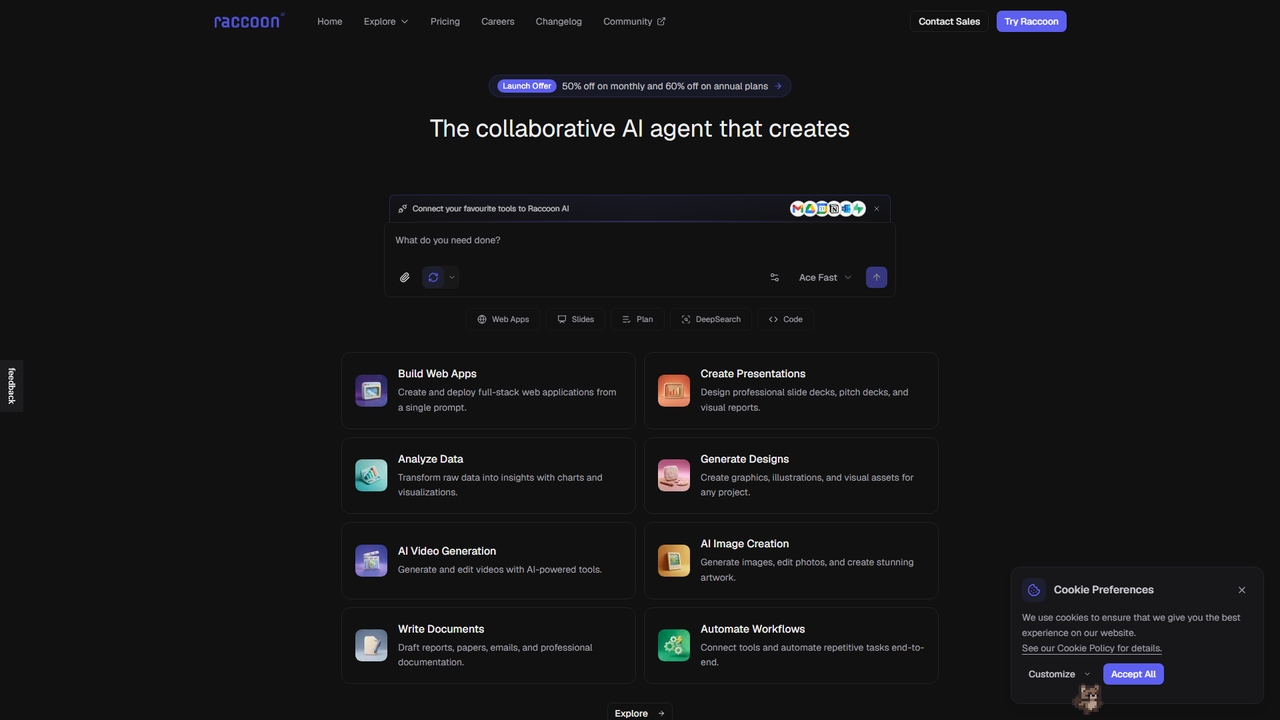
Raccoon AI
Raccoon AI is a collaborative AI workspace that transforms conversations into web applications, presentations, reports, and designs. It …
Raccoon AI is a collaborative AI workspace that transforms conversations into web applications, presentations, reports, and designs. It integrates with your favorite tools to automate and execute complex creative and technical tasks.
Brila
Brila uses AI and the Jobs To Be Done framework to analyze your Google Maps reviews and automatically …
Brila uses AI and the Jobs To Be Done framework to analyze your Google Maps reviews and automatically generate a website with compelling, customer-centric messaging for your local business.
Dreambase
An AI-native analytics platform that connects directly to your Supabase database, providing instant dashboards, reports, and actionable insights …
An AI-native analytics platform that connects directly to your Supabase database, providing instant dashboards, reports, and actionable insights with minimal setup.
Epismo
A workflow platform for AI agents, offering ready-to-use templates for marketing, productivity, programming, and operations.
A workflow platform for AI agents, offering ready-to-use templates for marketing, productivity, programming, and operations.
Flint
Flint is an AI-powered platform for marketing and growth teams that autonomously generates and manages brand-consistent, SEO-optimized landing …
Flint is an AI-powered platform for marketing and growth teams that autonomously generates and manages brand-consistent, SEO-optimized landing pages. It integrates directly with existing tools and workflows, enabling rapid creation of personalized pages for campaigns, account-based marketing, and keyword targeting without requiring engineering resources.
Supapin
Supapin is an AI-powered Pinterest automation tool designed to streamline content creation and scheduling. It automatically scans your …
Supapin is an AI-powered Pinterest automation tool designed to streamline content creation and scheduling. It automatically scans your website, generates professional pin designs, writes SEO-optimized titles and descriptions, and publishes pins to relevant boards at optimal times, all to drive more traffic from Pinterest with minimal manual effort.
NextDocs
NextDocs is an AI-powered document and presentation generator that transforms ideas into polished documents and slides in seconds. …
NextDocs is an AI-powered document and presentation generator that transforms ideas into polished documents and slides in seconds. It handles structure, formatting, and design automatically, supports multiple formats from a single prompt, and offers flexible editing and export options to fit any workflow.
Autobizai
Autobizai is a comprehensive AI-powered marketing platform designed to streamline and accelerate business communication. It integrates 12 specialized …
Autobizai is a comprehensive AI-powered marketing platform designed to streamline and accelerate business communication. It integrates 12 specialized tools to generate lead responses, follow-up emails, social media content, ad copy, website copy, blog posts, and more, enabling marketing, sales, and support teams to produce high-quality content 10x faster and improve conversion rates.
StoryCut
StoryCut is an AI-powered video editor designed specifically for creating viral short-form content. It automates the process of …
StoryCut is an AI-powered video editor designed specifically for creating viral short-form content. It automates the process of turning long videos into engaging clips for TikTok, Reels, and Shorts by adding dynamic captions, auto-reframing, applying transitions, cleaning audio, and generating thumbnails, all in seconds.
Sokosumi
Sokosumi is an AI marketing workforce platform designed for modern teams. It provides specialized "Agentic Coworkers" that can …
Sokosumi is an AI marketing workforce platform designed for modern teams. It provides specialized "Agentic Coworkers" that can be assigned real work, such as market research, content creation, strategy planning, and data analysis. These AI agents operate autonomously, trained on real campaign work to deliver expert-level results across various marketing functions.
GitFit
GitFit is an AI-powered fitness and habit-tracking application that combines calorie counting, activity logging, and progress visualization. It …
GitFit is an AI-powered fitness and habit-tracking application that combines calorie counting, activity logging, and progress visualization. It allows you to track any custom metric using AI scanning, featuring a clean interface inspired by GitHub commit charts. Your data is fully encrypted and exportable, ensuring privacy and flexibility.
Faces
Faces is a modern presentation tool designed to break free from static slides. It enables users, particularly entrepreneurs, …
Faces is a modern presentation tool designed to break free from static slides. It enables users, particularly entrepreneurs, to create interactive and explorable presentations that leverage the full power of the web, making ideas more engaging and effective for pitches, portfolios, guides, and proposals.
Nano Banana
Nano Banana is a state-of-the-art AI platform that revolutionizes image generation and editing using natural language. It offers …
Nano Banana is a state-of-the-art AI platform that revolutionizes image generation and editing using natural language. It offers unmatched multi-image fusion, exceptional character consistency, and rapid creation of high-quality visuals from simple text commands, catering to a wide range of creative and commercial needs.
Surfn
Surfn is a no-code AI agent builder empowering creators, brands, and teams to create conversational AI pages that …
Surfn is a no-code AI agent builder empowering creators, brands, and teams to create conversational AI pages that significantly boost conversions. It provides instant, personalized answers to visitor queries, turning traffic into leads, bookings, and sales across websites, social media, and emails with ease.