
Open Interpreter
An open-source tool that lets Large Language Models (LLMs) run code (Python, Shell, etc.) locally on your computer. …
An open-source tool that lets Large Language Models (LLMs) run code (Python, Shell, etc.) locally on your computer. It provides a natural language interface to your machine, enabling complex tasks like data analysis, file management, and automation with full access to your system's capabilities.
Lilac
Lilac is an open-source tool for data scientists and ML engineers to explore, clean, and improve datasets for …
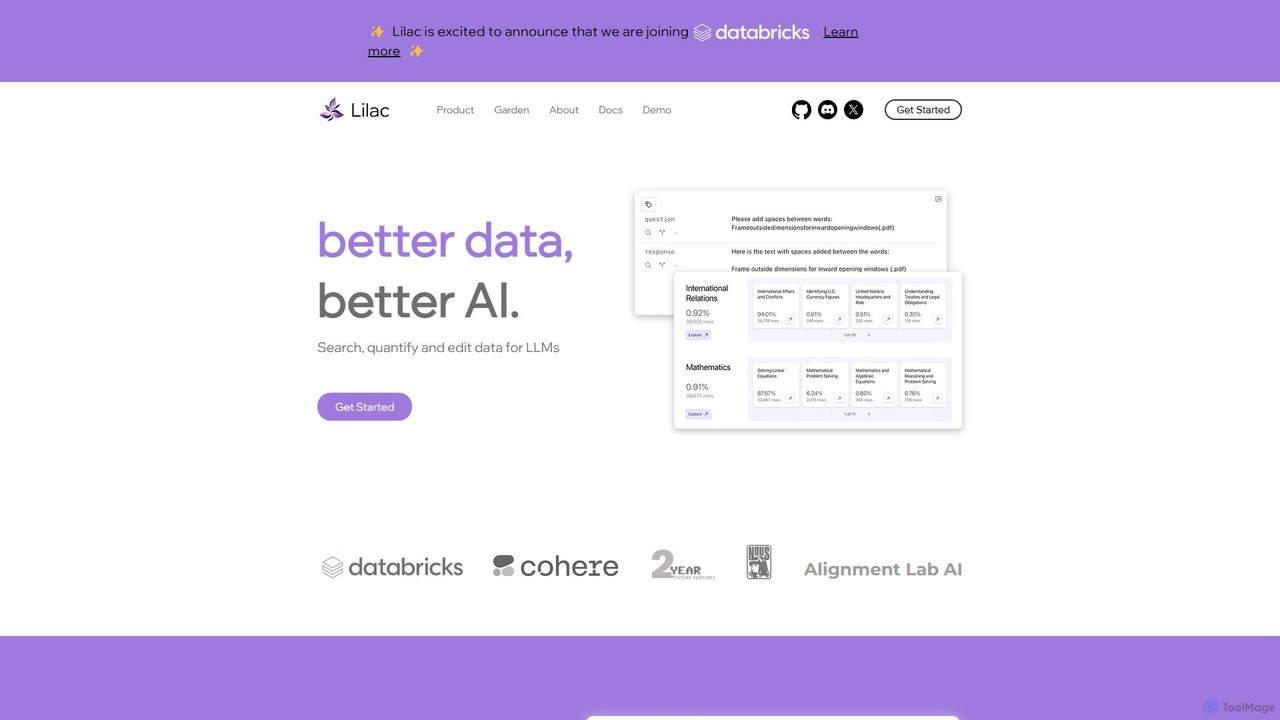
Lilac is an open-source tool for data scientists and ML engineers to explore, clean, and improve datasets for large language models (LLMs). It offers powerful semantic search, data clustering, and quality analysis to build better AI.
About Data Analysis
Data Analysis tools are AI-powered applications designed to automate the process of cleaning, exploring, visualizing, and interpreting large datasets. They leverage machine learning and natural language processing to uncover trends, patterns, and insights without requiring deep coding expertise. This enables businesses and individuals to make faster, data-driven decisions, from optimizing marketing campaigns to identifying operational inefficiencies. Their key advantage lies in democratizing data analysis for non-technical users, making it a crucial component within the broader Data Science field.
Core Features
- Natural Language Querying: Ask questions about your data in plain language and receive instant visualizations and answers.
- Automated Data Cleaning: Automatically identifies and corrects errors, duplicates, and inconsistencies in raw data.
- Predictive Forecasting: Utilizes historical data to generate forecasts for future trends, such as sales or customer demand.
- Interactive Dashboards: Creates dynamic, shareable dashboards that visualize key metrics and allow for real-time data exploration.
- Automated Insight Generation: Proactively identifies significant correlations, anomalies, and patterns, presenting them as easy-to-understand summaries.
Applicable Scenarios
These tools are widely used by business analysts, marketing managers, product managers, and operations teams. They are particularly effective in sectors like e-commerce for analyzing sales performance, in finance for tracking key metrics, and in marketing for measuring campaign ROI. Any role that requires understanding data trends to make strategic decisions can benefit.
Selection Criteria
When choosing a tool, first consider its integration capabilities with your existing data sources (e.g., SQL databases, Google Analytics, CRMs). Evaluate the complexity of analysis it supports, from basic dashboards to advanced predictive modeling. Also, assess the user interface's intuitiveness for your team's technical skill level and ensure the pricing model scales with your data volume and usage needs.
Data AnalysisUse Cases
Analyze E-commerce Sales Performance
An e-commerce manager uses an AI data analysis tool to understand a recent sales dip. By connecting their Shopify and Google Analytics data, they ask, "What were our top-selling products by region last month?" and "Which marketing channels had the lowest conversion rates?". The tool generates interactive charts showing a decline in a specific product category and poor performance from a social media campaign. This allows them to quickly adjust inventory and reallocate marketing budget, avoiding manual spreadsheet analysis that would take hours.
Optimize Marketing Campaign ROI
A digital marketing team connects data from Facebook Ads, Google Ads, and their CRM. They use the tool's automated insight feature to identify which ad creatives and audience segments generate the highest return on investment (ROI). The AI highlights that video ads on Instagram are outperforming static images on Facebook for a key demographic. Based on this, the team doubles down on video content, increasing their overall campaign ROI by 15% in the next quarter.
Identify Customer Churn Drivers
A product manager for a SaaS company wants to reduce customer churn. They upload user activity data and subscription information. Using natural language, they ask, "What behaviors are common among users who churned in the last 90 days?". The AI analysis reveals a strong correlation between churn and low usage of a specific feature. This insight leads the product team to prioritize improving that feature's user experience and creating targeted onboarding guides to encourage adoption.
Streamline Financial Reporting for Startups
A startup founder, without a dedicated finance team, connects their Stripe and QuickBooks accounts to an AI data analysis tool. The tool automatically generates a monthly P&L statement, cash flow analysis, and a dashboard tracking key metrics like Monthly Recurring Revenue (MRR) and Customer Acquisition Cost (CAC). It also flags unusual spending spikes, enabling the founder to maintain financial health and prepare investor reports in minutes instead of days.
Enhance Supply Chain Operations
An operations manager for a retail chain uses an AI tool to analyze inventory and sales data from hundreds of stores. The tool's predictive forecasting feature models future demand for various products based on historical trends, seasonality, and even external factors like local holidays. This helps the manager optimize stock levels, reduce overstocking of slow-moving items, and prevent stockouts of popular products, improving overall supply chain efficiency.
Analyze User Feedback from Surveys
A user experience (UX) researcher collects thousands of open-ended responses from a customer satisfaction survey. Instead of manually reading and tagging each response, they upload the data to an AI analysis tool. The tool uses sentiment analysis and topic modeling to automatically categorize feedback into themes like "pricing concerns," "feature requests," and "positive UI feedback." This provides a quantitative overview of qualitative data, allowing the team to quickly identify the most pressing user issues.