
Coohom
Coohom is an all-in-one, cloud-based 3D design platform for interior designers, architects, and retailers. It enables users to …
Coohom is an all-in-one, cloud-based 3D design platform for interior designers, architects, and retailers. It enables users to create 2D/3D floor plans, generate photorealistic renderings and 720° panoramas in minutes, and visualize designs with a massive library of 3D models. Its AI-powered features streamline the entire design-to-visualization workflow.
AiHouse
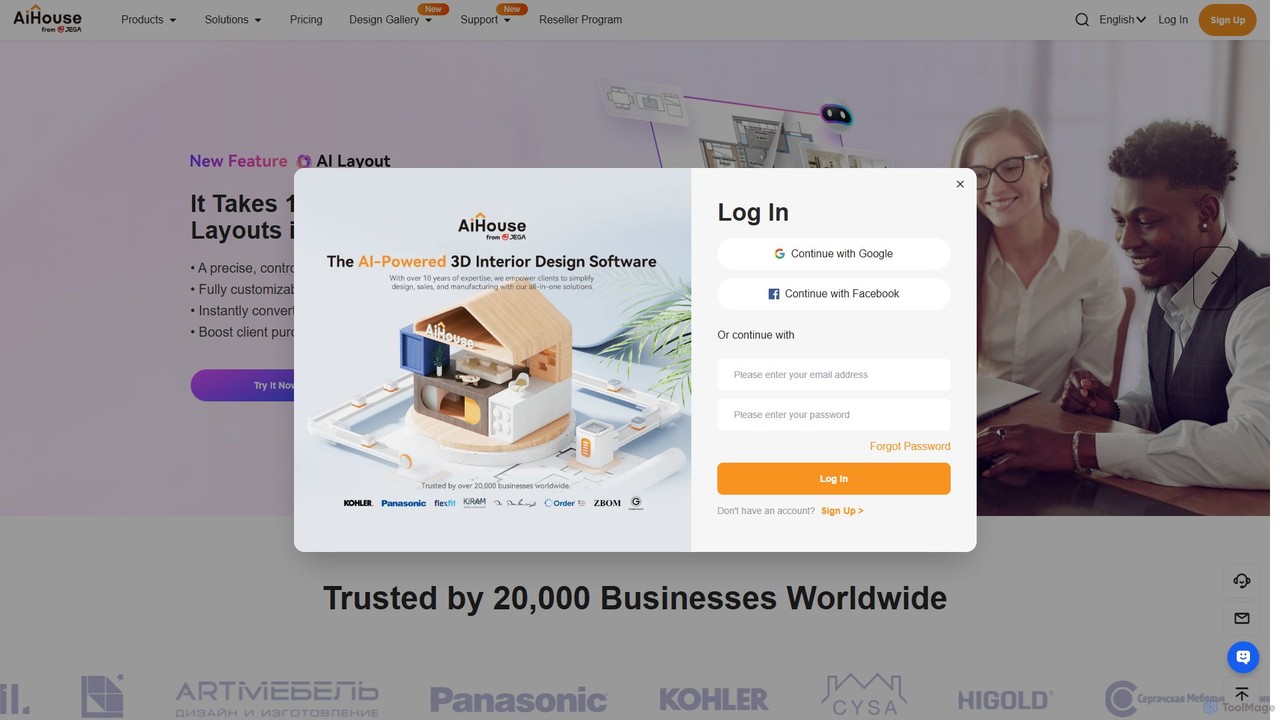
AiHouse is an all-in-one, AI-powered 3D interior design and manufacturing software. It enables professionals to create photorealistic visualizations, …
AiHouse is an all-in-one, AI-powered 3D interior design and manufacturing software. It enables professionals to create photorealistic visualizations, 2D/3D floor plans, and interactive virtual tours in minutes. With a library of over 80 million 3D models and seamless design-to-manufacturing integration, AiHouse streamlines the entire workflow for interior designers, architects, and furniture businesses, boosting sales and efficiency.
ChatUML
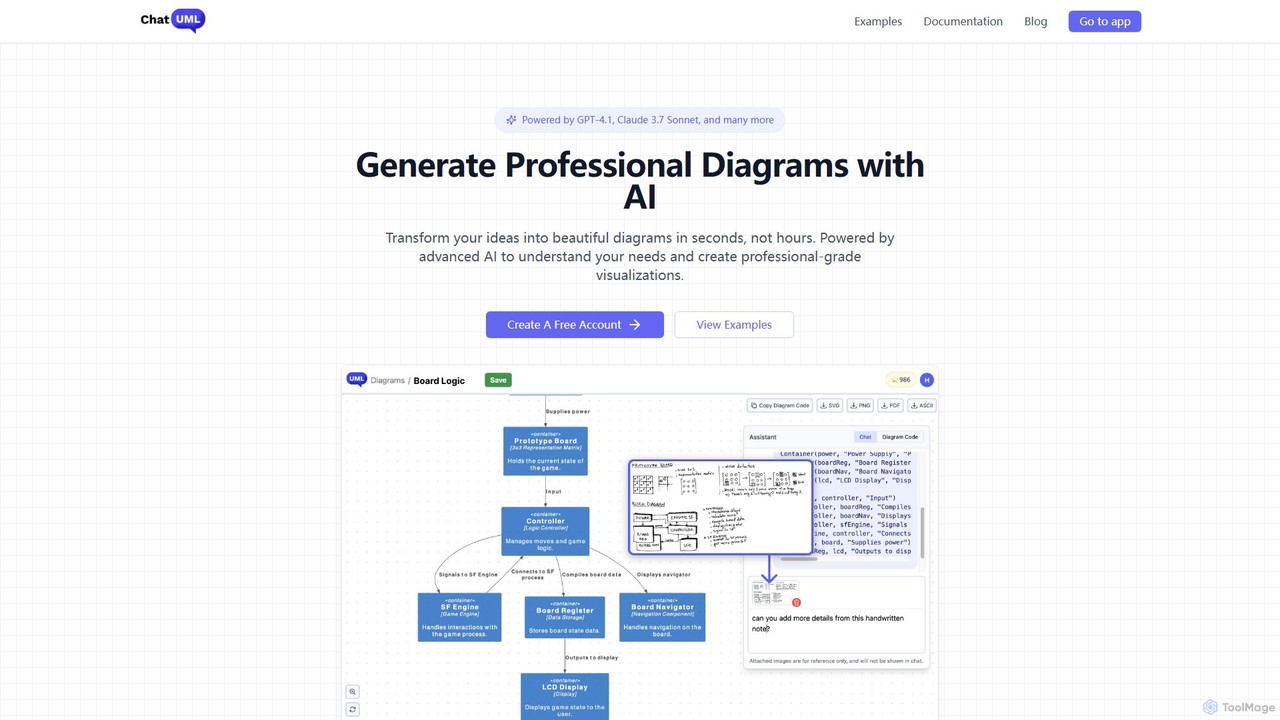
ChatUML is an AI-powered diagram generator that transforms text descriptions, hand-drawn sketches, and even website content into professional …
ChatUML is an AI-powered diagram generator that transforms text descriptions, hand-drawn sketches, and even website content into professional diagrams in seconds. Leveraging models like GPT-4.1 and Claude 3, it supports various formats including UML, C4 architecture, mind maps, and more, streamlining the visualization process for developers, project managers, and creative teams.
About Visualization
AI Visualization tools are applications that use artificial intelligence to automatically convert complex marketing data into clear, interactive, and insightful visuals. They leverage machine learning algorithms to identify patterns, trends, and correlations in datasets, generating charts, graphs, and dashboards with minimal manual effort. These tools empower marketing teams to quickly understand campaign performance, audience behavior, and market dynamics, facilitating data-driven decision-making and more effective communication of results. They go beyond static charts by offering features like natural language querying and automated insight generation.
Core Features
- Automated Dashboard Creation: Automatically generates comprehensive marketing dashboards by connecting to data sources like Google Analytics, CRM, and ad platforms.
- Natural Language Querying (NLQ): Allows users to ask questions about their data in plain language (e.g., "show me top traffic sources last month") and receive instant visual answers.
- Predictive Analytics Visualization: Creates forecasts and visualizes potential future trends based on historical marketing data.
- Dynamic Infographic Generation: Transforms raw data, reports, or text into professionally designed infographics for content marketing.
- Sentiment Analysis Visualization: Maps and visualizes customer sentiment from social media, reviews, and surveys into intuitive charts.
Use Cases
These tools are essential for marketing analysts, campaign managers, and content strategists. For instance, an analyst can use AI visualization to create a real-time performance dashboard for a multi-channel campaign, while a content creator can instantly generate an infographic from a market research report. They are widely used in digital marketing agencies, e-commerce companies, and corporate marketing departments to translate raw metrics into strategic insights.
How to Choose
When selecting an AI Visualization tool for marketing, consider the following: data source integrations (does it connect to your ad platforms, CRM, and analytics tools?), the variety of marketing-specific chart types and templates available, the sophistication of its AI-powered insights (does it just plot data or does it suggest actions?), and its ease of use for non-technical team members. Also, evaluate collaboration features and export options for reporting.
VisualizationUse Cases
Automate Campaign Performance Reporting
A digital marketing manager needs to present weekly performance reports for a multi-channel campaign (covering Google Ads, Facebook, and email marketing) to stakeholders. Instead of manually exporting data from each platform and building charts in spreadsheets, they connect all data sources to an AI Visualization tool. The tool automatically generates an interactive dashboard that visualizes key metrics like Cost Per Acquisition (CPA), Return On Ad Spend (ROAS), and conversion rates across channels. This saves hours of manual work each week and allows for real-time analysis during meetings.
Create Data-Driven Infographics for Content Marketing
A content marketer has just completed a comprehensive industry survey and wants to present the findings in an engaging format for a blog post and social media. They upload the raw survey data (e.g., a CSV file) into an AI Visualization tool. Using a natural language prompt like "Create an infographic about key survey findings on customer preferences," the AI analyzes the data, identifies the most significant statistics, and generates a professionally designed, editable infographic. This process reduces design time from days to minutes and ensures the visual content is both accurate and aesthetically pleasing.
Visualize Customer Segmentation for Personalization
A CRM analyst for an e-commerce brand wants to better understand customer segments to improve personalized marketing campaigns. They connect their customer database to an AI Visualization tool. The tool automatically identifies distinct clusters based on purchasing behavior, demographics, and engagement levels. It then generates interactive charts, such as scatter plots and tree maps, that clearly visualize these segments. The analyst can explore these visuals to uncover insights, like identifying a high-value segment that prefers a specific product category, leading to more targeted and effective email campaigns.
Analyze Social Media Trends in Real-Time
A social media manager for a fast-fashion brand needs to stay on top of rapidly changing trends. They use an AI Visualization tool connected to their social media monitoring platform. The tool processes real-time data on mentions, hashtags, and sentiment. It generates dynamic visualizations like word clouds to show trending topics, sentiment analysis charts to gauge public perception of a new collection, and network graphs to identify key influencers. This allows the manager to quickly spot emerging trends and adapt their content strategy accordingly, ensuring the brand remains relevant.
Interpret A/B Testing Results for CRO
A Conversion Rate Optimization (CRO) specialist runs multiple A/B tests on a website's landing pages. To determine the winning variations, they input the test data (e.g., traffic, conversions, and bounce rates for each variant) into an AI Visualization tool. The tool not only creates clear side-by-side comparison charts but also automatically calculates statistical significance and confidence levels. It might highlight the winning variation in green and provide a natural language summary like, "Variation B increased conversions by 15% with 98% confidence." This simplifies the interpretation of complex statistical data and helps the team make confident decisions on website changes.
Visualize Market Research & Competitor Analysis
A market research analyst is tasked with presenting a competitive landscape report. They gather data on competitors' market share, social media voice, pricing strategies, and customer reviews. By feeding this diverse dataset into an AI Visualization tool, they can generate a variety of charts. For example, a stacked bar chart to show market share evolution over time, a radar chart to compare feature sets across competitors, and a sentiment map to visualize customer opinions. This transforms a dense, text-heavy report into a clear and compelling visual story, making it easier for leadership to grasp strategic opportunities and threats.