charteye is an AI-powered tool that automates technical analysis for any financial chart. Simply upload a chart image or interact with the AI assistant, EyeGent, to receive instant, in-depth analysis, identify key patterns, trends, and trading signals. It's designed for traders of all levels, from beginners to professionals, across crypto, stocks, and other markets.

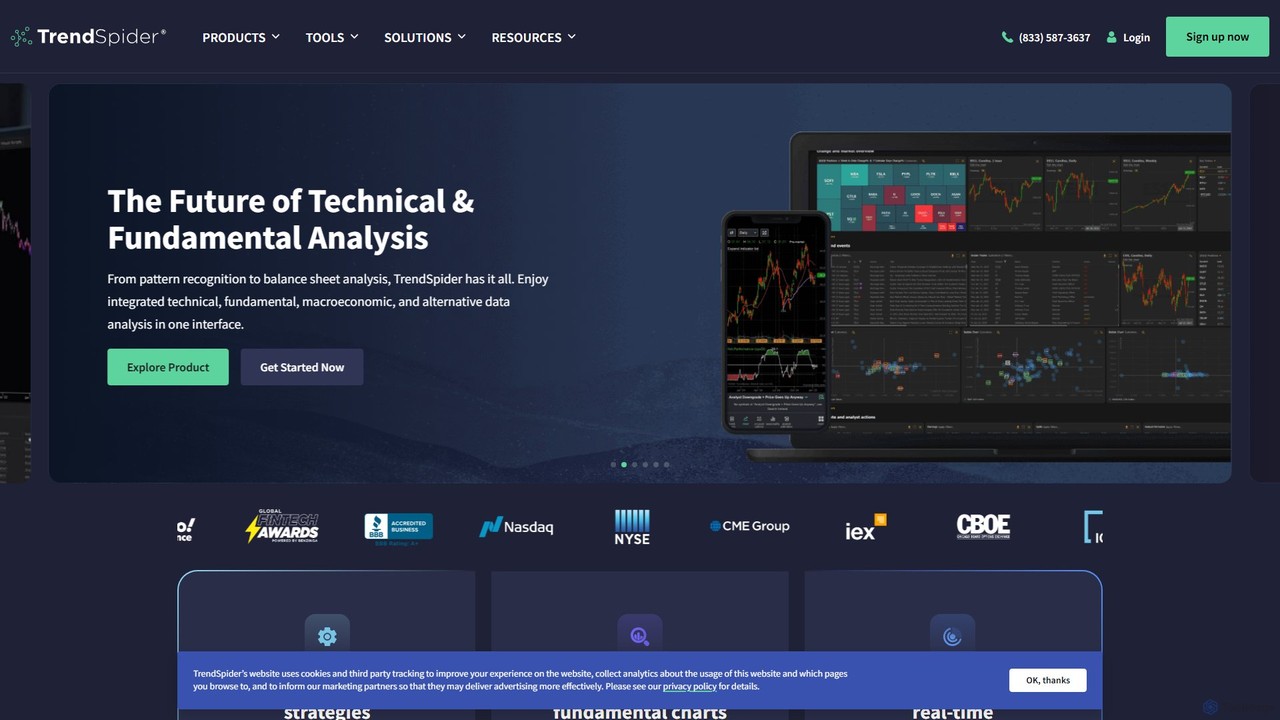
TrendSpider is an all-in-one, AI-powered technical analysis and trading platform designed for traders. It automates chart analysis, strategy backtesting, and trade idea generation, featuring predictive AI models, a no-code strategy builder, and real-time market scanning to help traders make smarter, faster decisions.
Product overview
charteye Product overview
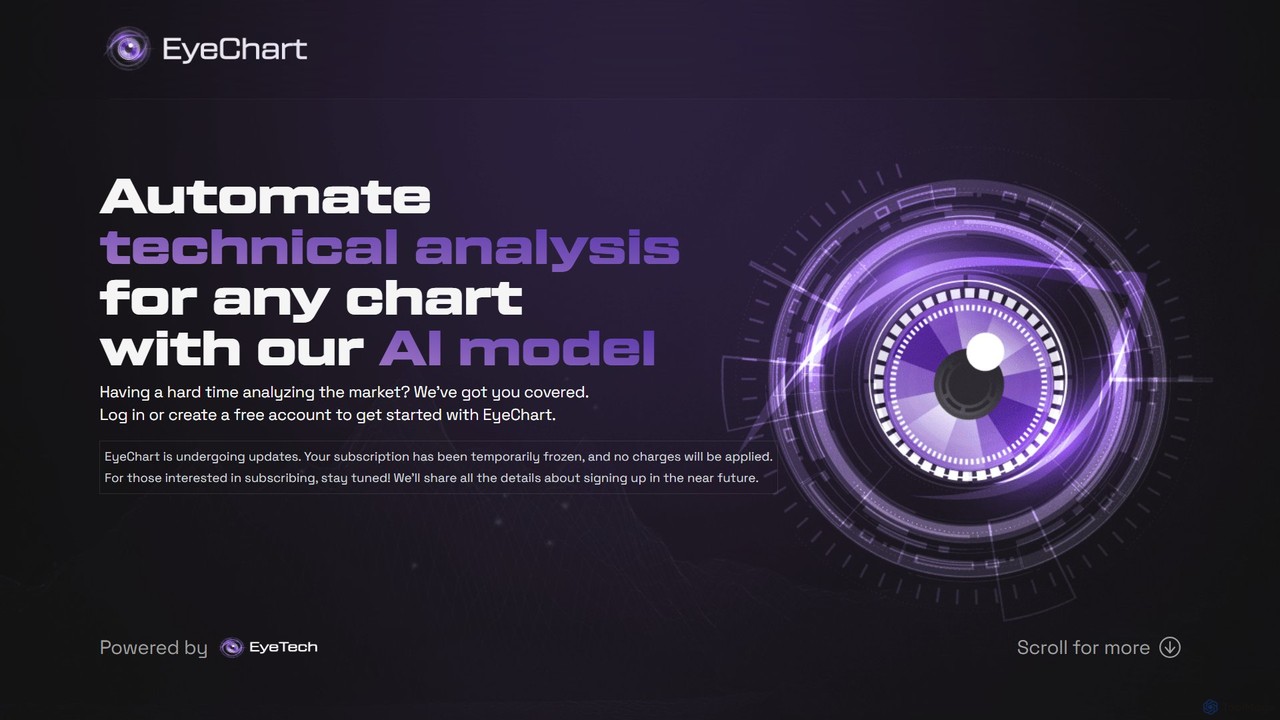
charteye is an AI-powered tool that automates technical analysis for any financial chart. Simply upload a chart image or interact with the AI assistant, EyeGent, to receive instant, in-depth analysis, identify key patterns, trends, and trading signals. It's designed for traders of all levels, from beginners to professionals, across crypto, stocks, and other markets.
TrendSpider Product overview
TrendSpider is an all-in-one, AI-powered technical analysis and trading platform designed for traders. It automates chart analysis, strategy backtesting, and trade idea generation, featuring predictive AI models, a no-code strategy builder, and real-time market scanning to help traders make smarter, faster decisions.
Detailed feature comparison
| Feature | charteye | TrendSpider |
|---|---|---|
| Primary category | Financial Learning | Cryptocurrency |
| Added | 2025-08-02 | 2025-08-14 |
| Pricing | Freemium | Paid |
| Official website | chart.eye.tech | trendspider.com |
| Product type | Website | Website |
| Performance data | ||
| User rating | Not verified | Not verified |
| Comments | 0 | 0 |
| Monthly visits | 4.2K | 652.7K |
| Monthly growth | Not verified | 7.5% |
| Favorites | 105 | 130 |
| Details | View details | View details |
charteye vs TrendSpider monthly traffic
Compare charteye and TrendSpider by monthly reach, traffic trend, visit depth, top regions, and acquisition sources.
How to interpret the traffic data
In the charteye vs TrendSpider monthly traffic comparison, charteye currently shows 4.2K visits and TrendSpider shows 652.7K; TrendSpider has about 157 times the visible traffic of charteye, an absolute difference of about 648.5K visits. This reflects visible reach, not feature quality or paid users.
Only TrendSpider has complete third-party traffic details; charteye uses visits recorded inside ToolMage. These scopes cannot estimate market share directly, and on-site views should not be treated as the product’s total website traffic.
charteye monthly traffic:
Latest traffic
TrendSpider monthly traffic:
Latest traffic
Monthly traffic trend
- 2025/9: 600.9K Monthly visits
- 2026/1: 600.4K Monthly visits
- 2026/2: 601.6K Monthly visits
- 2026/3: 623.4K Monthly visits
- 2026/4: 606.9K Monthly visits
- 2026/5: 652.7K Monthly visits
Top regions
Top 5 countries/regions
| Country/region | Percentage | Traffic |
|---|---|---|
| 🇺🇸United States | 84.83% | 553.7K |
| 🇮🇳India | 5.37% | 35K |
| 🇬🇧United Kingdom | 3.53% | 23K |
| 🇩🇪Germany | 3.34% | 21.8K |
| 🇰🇷Korea, Republic of | 2.93% | 19.1K |
Traffic sources
| Source type | Percentage | Traffic |
|---|---|---|
| Direct | 84.62% | 552.3K |
| Referral | 13.38% | 87.3K |
| 2% | 13.1K |
Search keywords
Usage comparison
Compare the core capabilities of charteye and TrendSpider
charteye Core features
TrendSpider Core features
Use cases
charteye Use cases
TrendSpider Use cases
charteye vs TrendSpider:In-depth comparison and selection guidance
First decide whether the products solve the same kind of need
This in-depth charteye vs TrendSpider comparison uses only the product records, taxonomy, audience, traffic, and community signals available on this page. charteye is primarily listed under “Financial Learning”, while TrendSpider is primarily listed under “Cryptocurrency”, so the first decision is whether your actual task matches their recorded scope.
The structured fields currently show these decision-relevant differences: Primary category (charteye: Financial Learning; TrendSpider: Cryptocurrency); Pricing (charteye: Freemium; TrendSpider: Paid); Monthly visits (charteye: 4.2K; TrendSpider: 652.7K); Favorites (charteye: 105; TrendSpider: 130); Website (charteye: chart.eye.tech; TrendSpider: trendspider.com). These facts are more useful for selection than brand visibility alone.
What market visibility and monthly traffic mean
In the charteye vs TrendSpider monthly traffic comparison, charteye currently shows 4.2K visits and TrendSpider shows 652.7K; TrendSpider has about 157 times the visible traffic of charteye, an absolute difference of about 648.5K visits. This reflects visible reach, not feature quality or paid users.
Only TrendSpider has complete third-party traffic details; charteye uses visits recorded inside ToolMage. These scopes cannot estimate market share directly, and on-site views should not be treated as the product’s total website traffic.
The current traffic scope is not sufficient for a reliable product ranking. Treat monthly visits as a market-interest signal, then decide using taxonomy, use cases, pricing, and a like-for-like trial rather than reading exposure as product capability.
Product positioning, use cases, and roles
charteye and TrendSpider currently overlap in shared categories: Trading and Data Analysis; shared tags: investment, technical analysis, and trading. This can place both on the same shortlist, but it does not prove equal implementation, depth, or cost.
charteye's unique categories/tags are Financial Learning, AI assistant, chart analysis, cryptocurrency, data visualization, finance, and stock market; TrendSpider's are Cryptocurrency, Stock Market, ai trading, algorithmic trading, backtesting, charting software, financial data, and market scanner. These unique fields are the strongest differentiators: validate the product whose recorded scope matches the task instead of following traffic alone.
What ratings, comments, and favorites can tell you
charteye has no verified rating, 0 comments, 105 favorites, and 114 likes;TrendSpider has no verified rating, 0 comments, 130 favorites, and 131 likes。
Neither product has enough rating or comment samples for a credible reputation ranking.
Selection guidance by actual need
When to evaluate charteye first
Put charteye on the priority trial list when the task aligns with “Financial Learning” and especially Financial Learning, AI assistant, chart analysis, cryptocurrency, data visualization, and finance. This follows recorded positioning and does not imply unlisted capabilities are absent.
charteye also currently records: pricing is freemium, product type is website, 4.2K on-site monthly views, no verified user rating. Verify any hard requirement around price, platform, or reach before trial, and do not let sparse review data substitute for testing.
When to evaluate TrendSpider first
Put TrendSpider on the priority trial list when the task aligns with “Cryptocurrency” and especially Cryptocurrency, Stock Market, ai trading, algorithmic trading, backtesting, and charting software. This follows recorded positioning and does not imply unlisted capabilities are absent.
TrendSpider also currently records: pricing is paid, product type is website, 652.7K verified monthly visits, no verified user rating. Verify any hard requirement around price, platform, or reach before trial, and do not let sparse review data substitute for testing.
How to validate the recommendation before deciding
The available data describes positioning, public visibility, and community signals, but it cannot prove output quality, speed, integration effort, privacy, or long-term cost in your workflow. Before deciding, run the same representative tasks in charteye and TrendSpider, then record completion time, accuracy, manual corrections, and the real paid threshold. A like-for-like trial turns this comparison into a defensible adoption decision.
Comparison FAQ
How should I choose between charteye and TrendSpider?
Where does this comparison data come from?
What do unknown fields mean?
Related AI tools

feetr
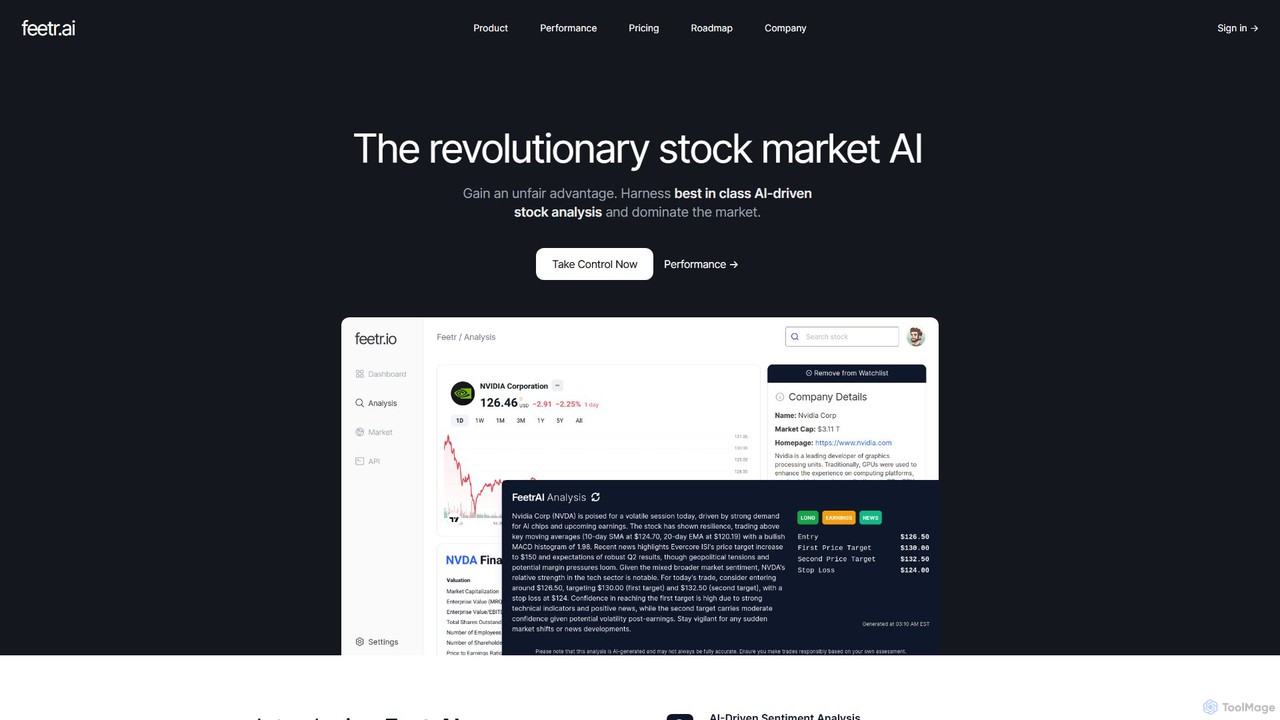
Feetr is an advanced AI-powered platform for stock market analysis. It provides traders with a competitive edge by delivering real-time, data-driven insights, global sentiment analysis, and precise price targets. The tool is designed for retail, whale, and institutional traders.
Stock Market
Castello.ai
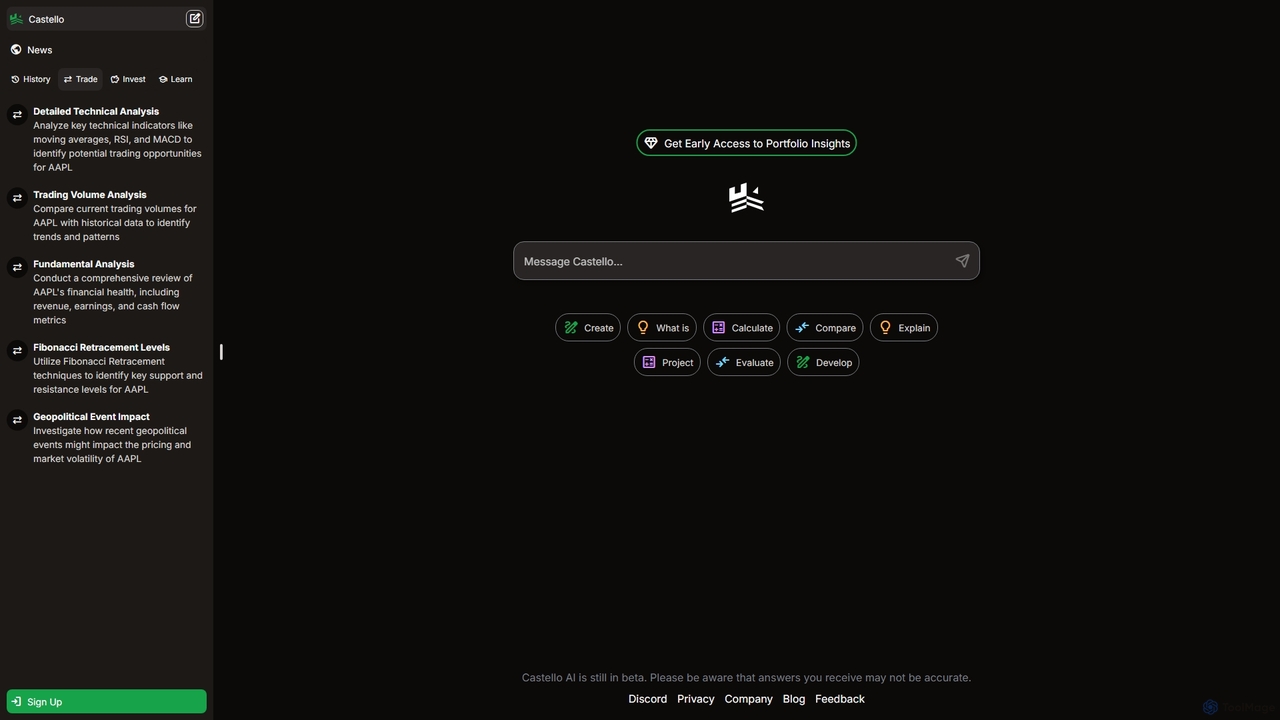
Castello.ai is a conversational AI platform designed for investors and traders. It simplifies complex financial analysis by providing detailed technical, fundamental, and geopolitical insights through a user-friendly chat interface. Ask questions in natural language to get instant, data-driven analysis on stocks and market trends, empowering you to make smarter investment decisions.
Chatbot
Chart Aether
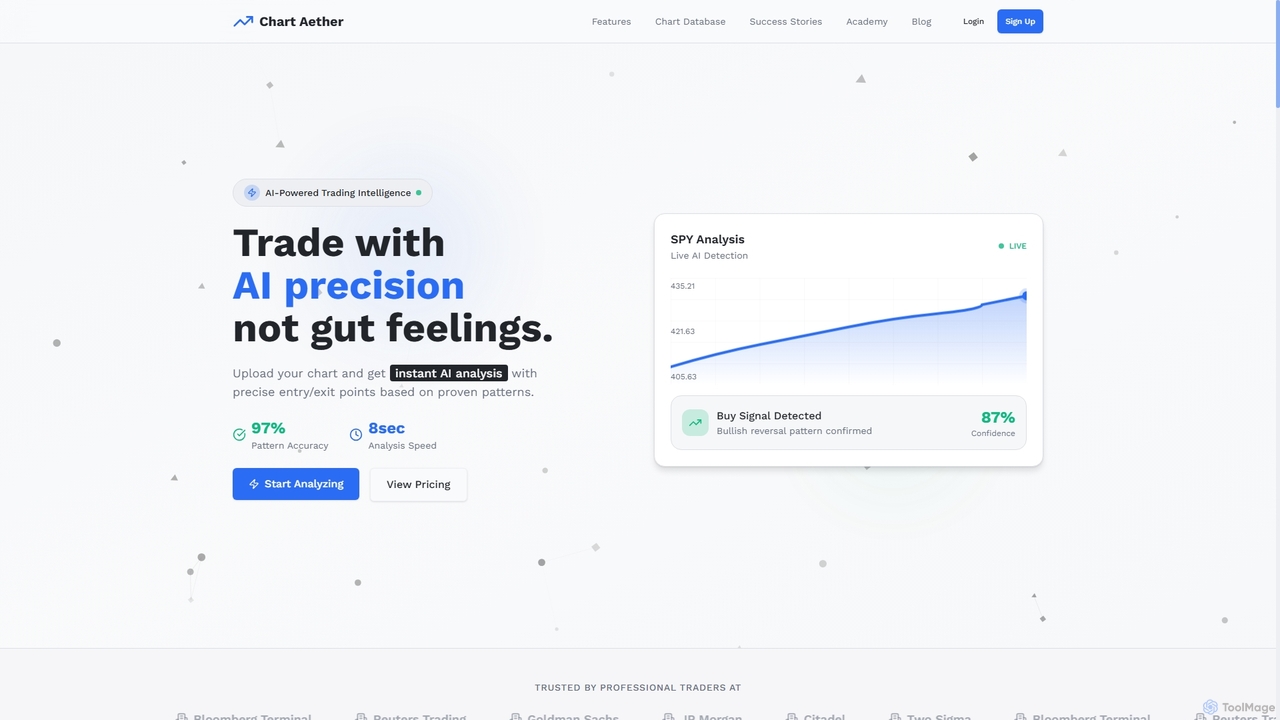
Chart Aether is an AI-powered trading intelligence platform that provides instant, precise analysis of trading charts. Upload any chart screenshot to receive AI-generated trade plans, including entry/exit points, stop-loss levels, and profit targets, based on over 50 proven chart patterns with up to 97% accuracy. It supports multiple assets and timeframes, empowering traders to make data-driven decisions.
Market Analysis
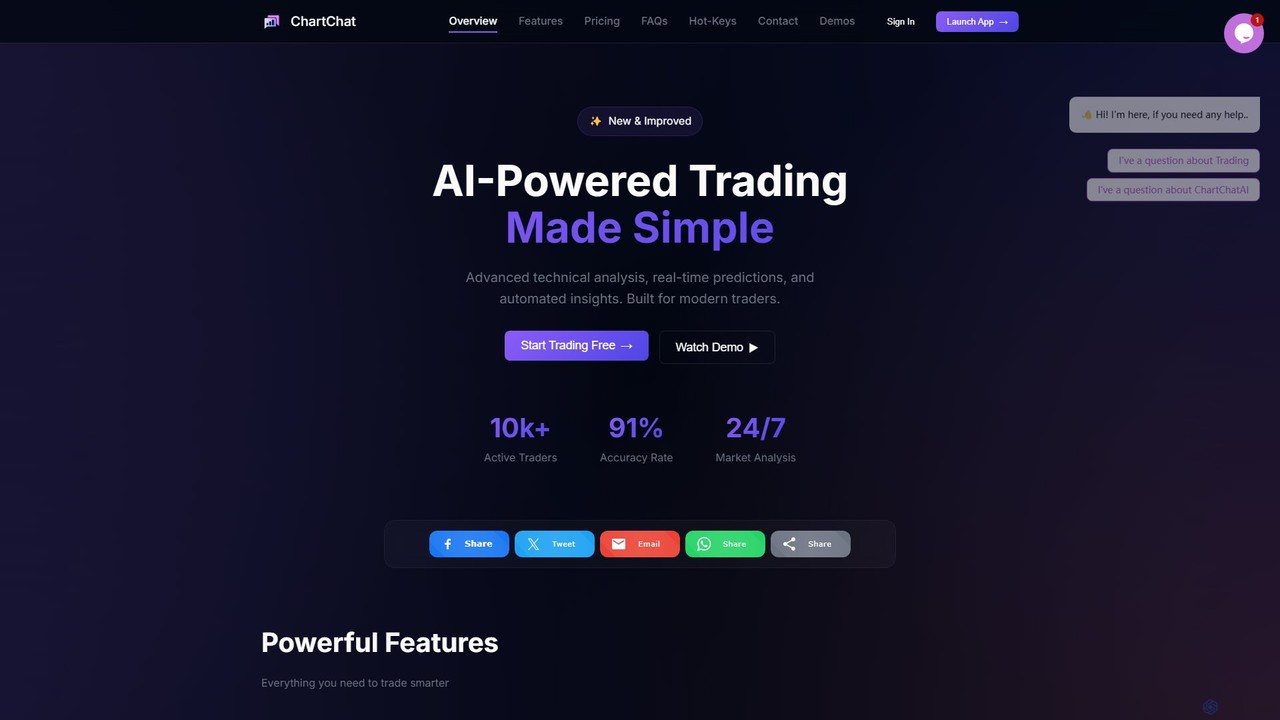
ChartChat AI
ChartChat AI is a specialized AI trading assistant that simplifies technical analysis. Paste any chart screenshot from platforms like TradingView or Binance to receive instant, in-depth analysis, real-time pattern recognition, and ML-based price predictions. It's designed for traders of all levels to make faster, smarter decisions in stock, crypto, and forex markets.
Cryptocurrency
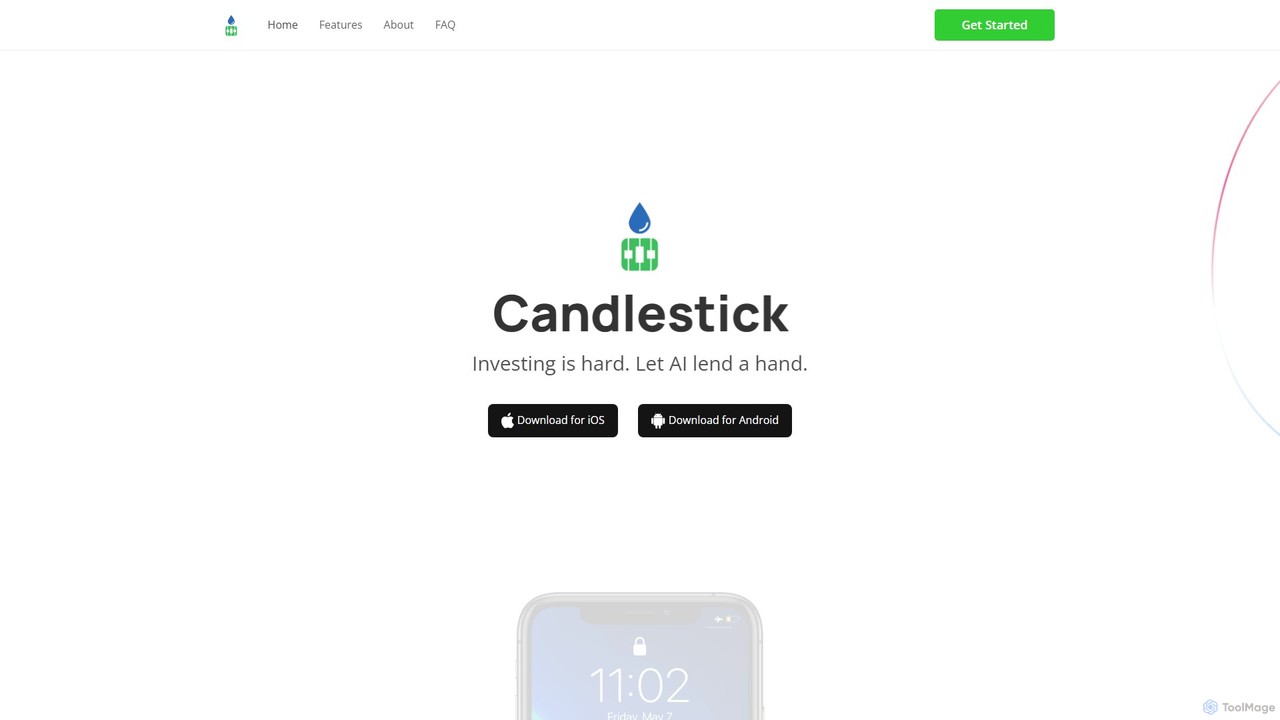
Candlestick
Candlestick is an AI-powered investment platform designed to help investors make smarter, data-driven decisions. As an SEC-registered investment advisor, it provides AI-generated stock recommendations, in-depth market analysis, and portfolio management tools. The platform leverages advanced algorithms to analyze market data, identify trends, and offer actionable insights for both novice and experienced investors.
Investing
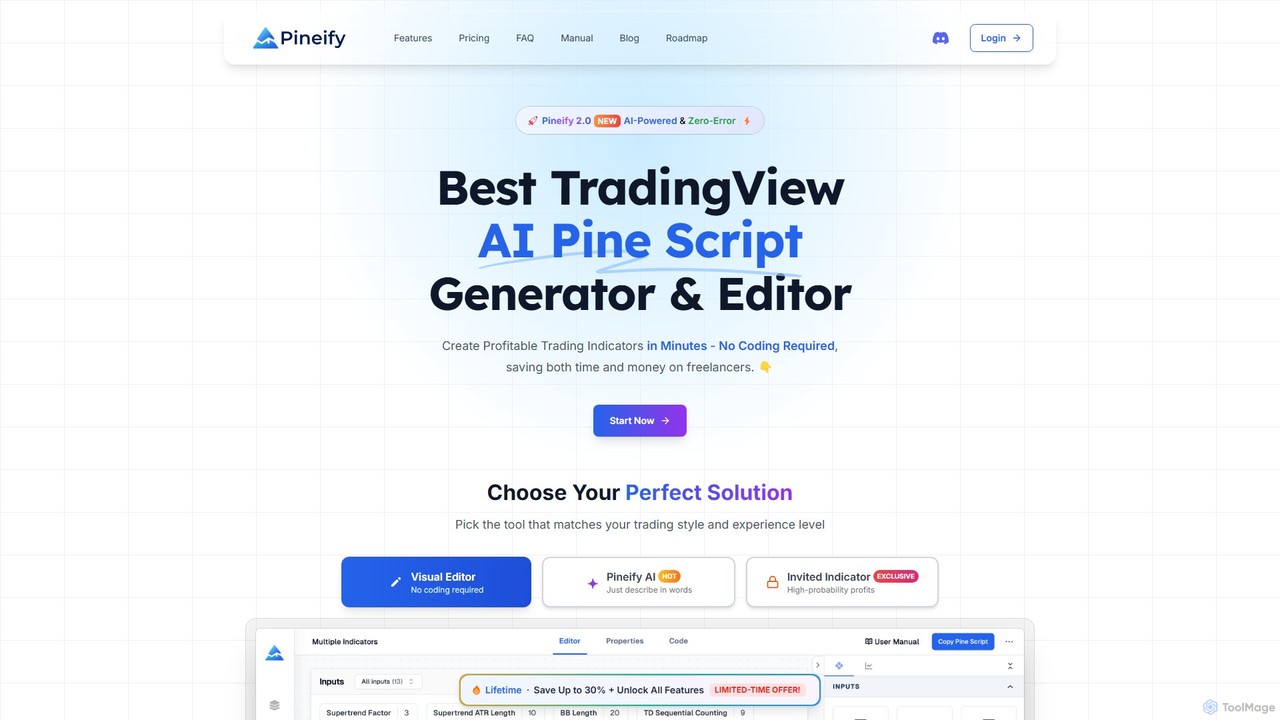
Pineify
Pineify is an AI-powered platform for creating TradingView indicators and strategies. It features a no-code visual editor and an advanced AI Pine Script generator that supports models like GPT-4o and Gemini. Users can build, backtest, and deploy complex trading tools in minutes, bypassing TradingView's limitations without any coding knowledge, saving significant time and money.
Code Generation
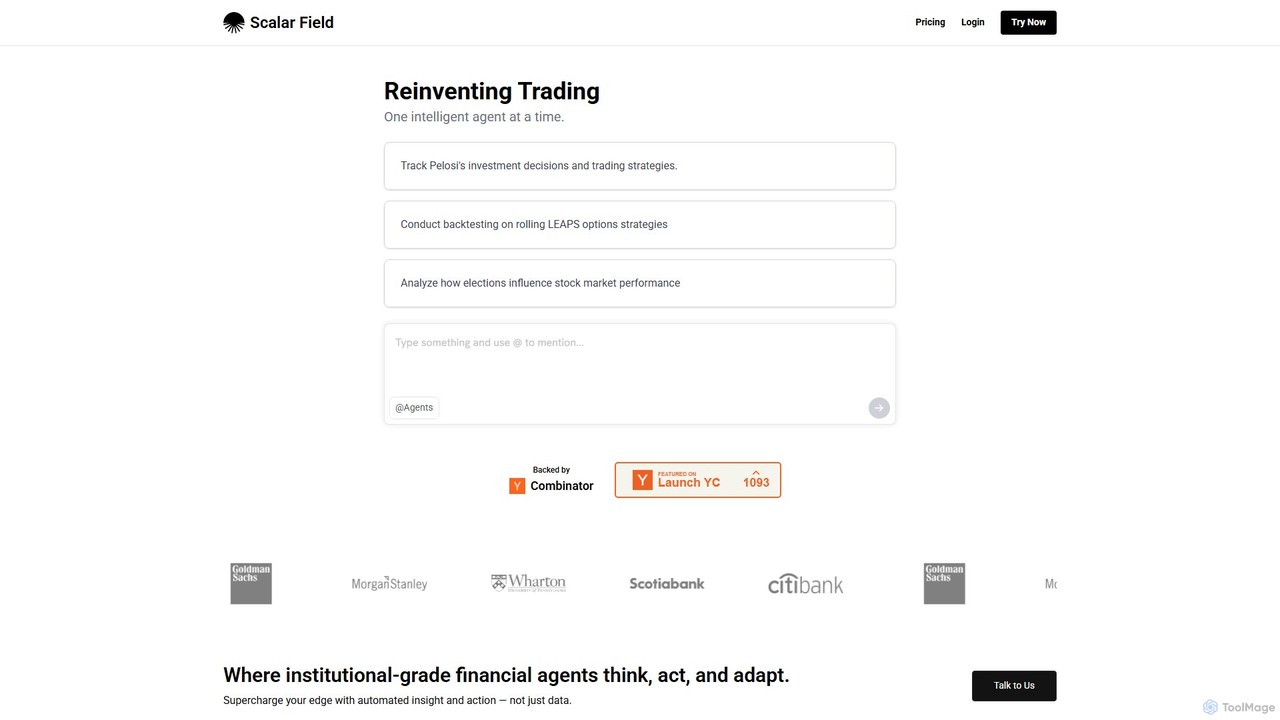
ScalarField
ScalarField is an AI-powered financial analysis platform for institutional-grade trading research. It allows users to backtest strategies, analyze vast datasets (fundamentals, options, insider trading, macroeconomics) using natural language queries, and gain automated insights. Backed by Y Combinator, it supercharges investment decisions by transforming complex data into actionable intelligence.
Investment Analysis
GoMoon.ai
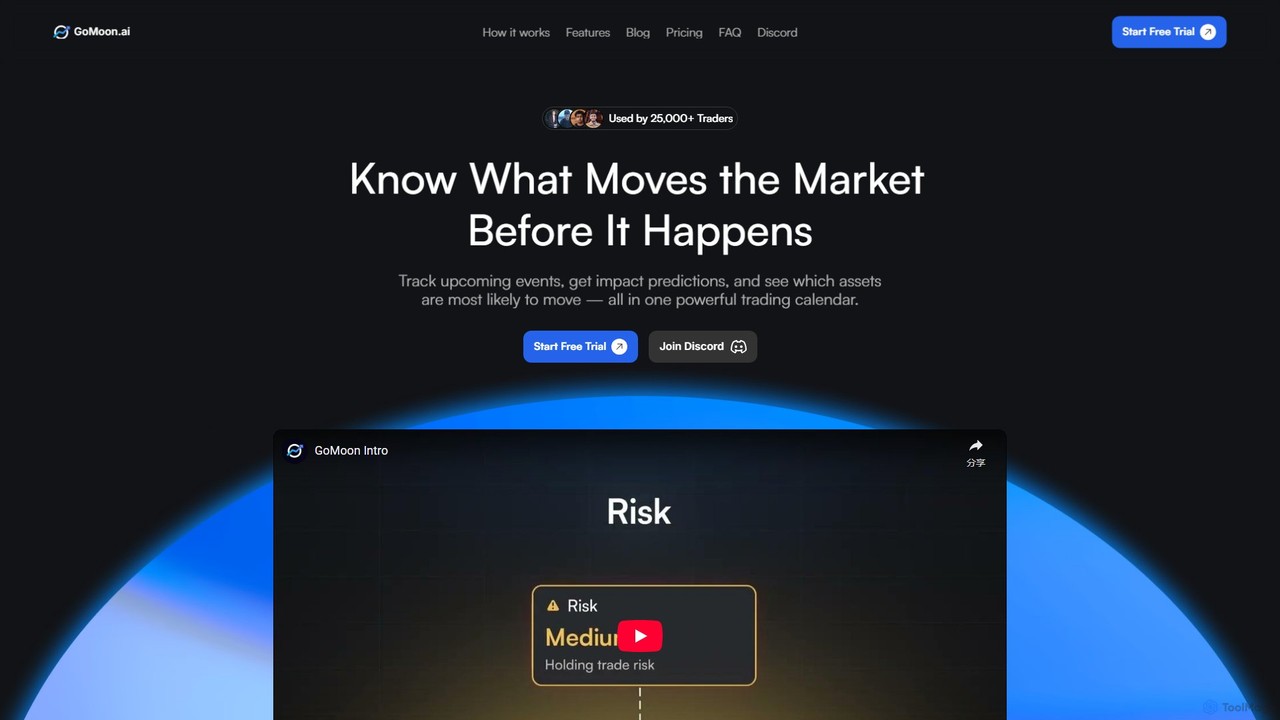
GoMoon.ai is an AI-powered economic calendar designed for traders. It provides predictive analysis on how global events will impact financial markets, offering AI-driven impact scores, live event streaming, and customizable alerts to help traders make informed, data-driven decisions for forex, crypto, and stock trading.
Market Research
rocketscooter
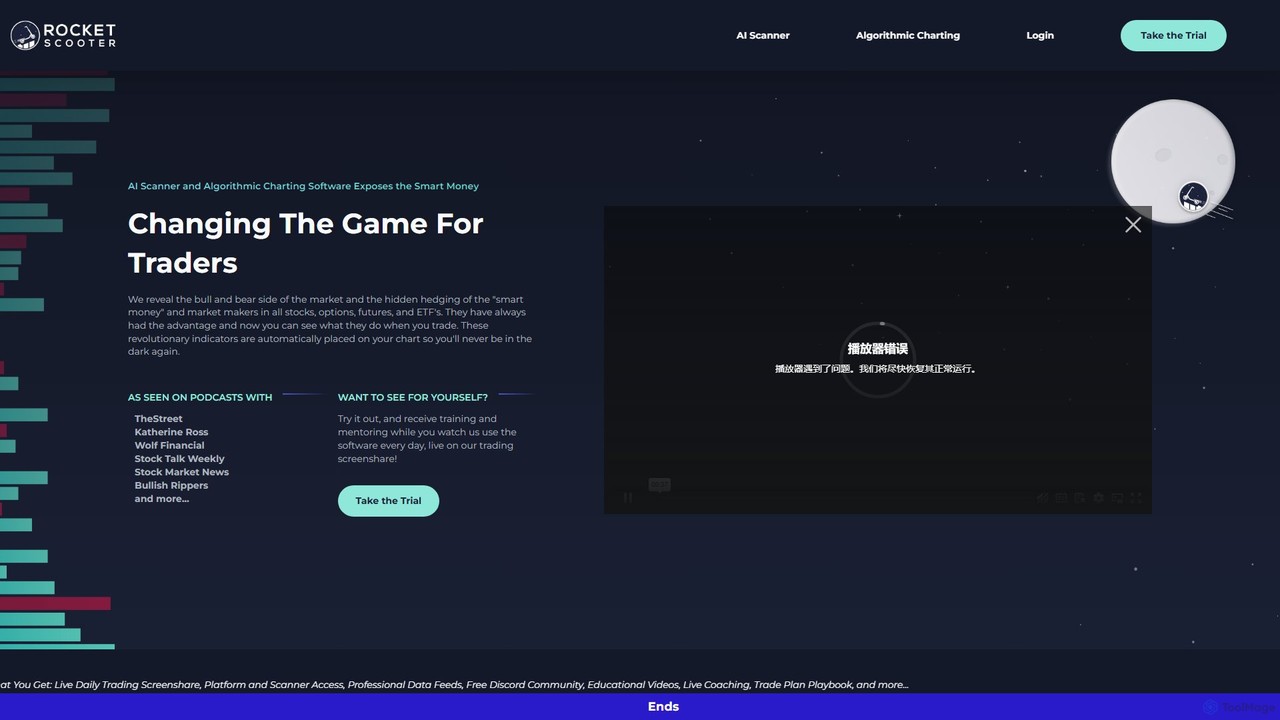
Rocket Scooter is an AI-powered trading platform featuring an intelligent scanner and algorithmic charting. It's designed to help traders by revealing the hidden positions and hedging activities of "smart money" and market makers across stocks, options, futures, and ETFs. The software automatically places proprietary indicators on charts, identifies high-reward, low-risk setups, and helps users trade with more confidence by understanding market liquidity and pivot points.
Investment
Raguie
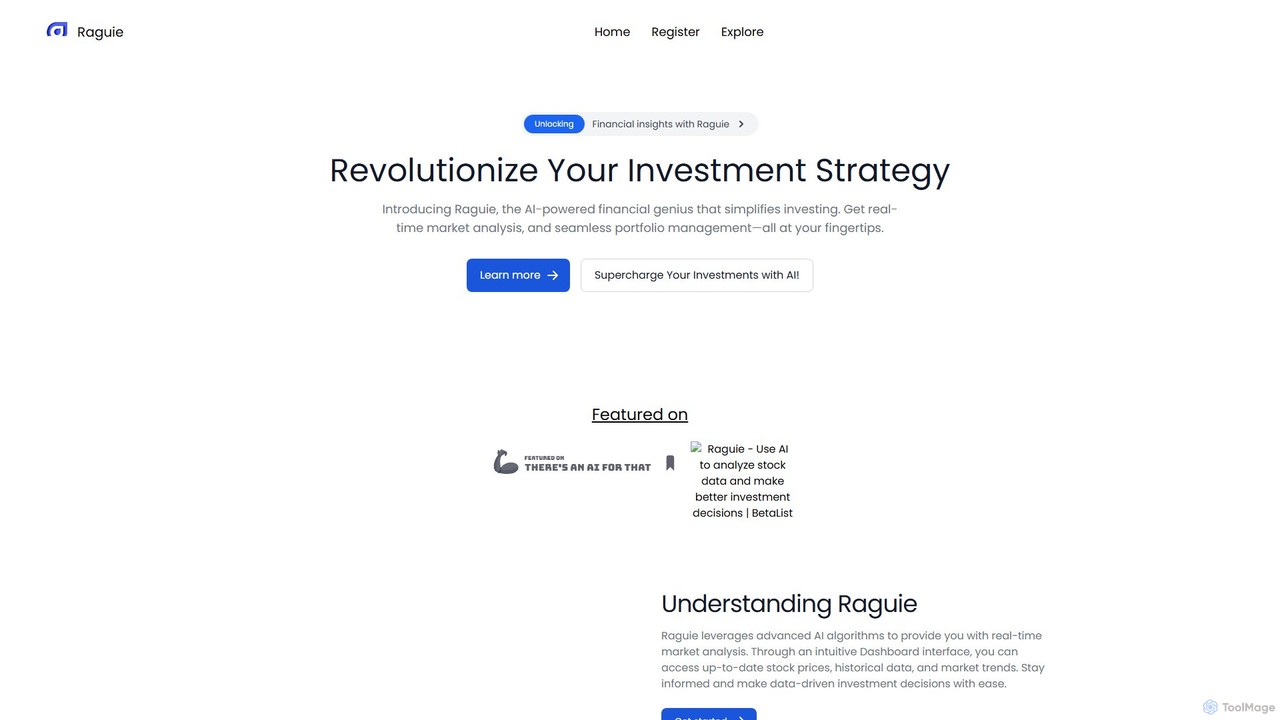
Raguie is an AI-powered financial assistant designed to simplify investing. It provides real-time market analysis, personalized portfolio monitoring, and actionable insights by analyzing financial data, news, and social media trends. It empowers investors of all levels to make informed, data-driven decisions through an intuitive dashboard and chat interface.
Investing
ChartScout
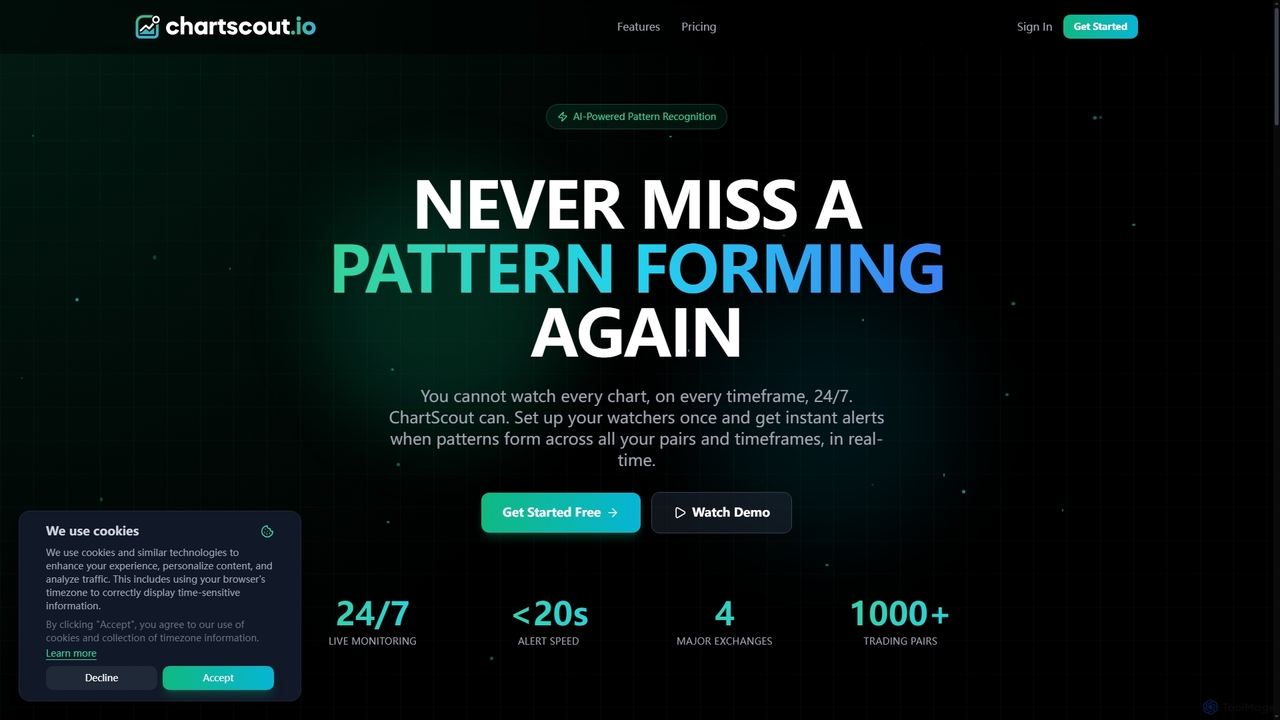
ChartScout is an AI-powered real-time cryptocurrency pattern scanner that monitors over 1,000 trading pairs across major exchanges 24/7. It delivers instant alerts within 20 seconds when critical chart patterns form, helping traders never miss a market opportunity.
Market Patterns
CoinSignal
CoinSignal is an AI-powered tool that delivers real-time crypto trading insights. It provides clear BUY/SELL/HOLD signals by combining technical, fundamental, and sentiment analysis from over 100 sources. The platform saves traders time, eliminates emotional decision-making, and offers a 24/7 market watch, complete with Discord and API integration for automated insights.
Crypto
QuantSignals
QuantSignals is a leading AI trading community leveraging advanced Large Language Models and professional quantitative modeling to deliver real-time market intelligence and trading signals. It offers mobile apps for on-the-go access, portfolio tracking, and is building a revolutionary AI-native brokerage. Join thousands of traders experiencing the future of AI-powered investing.
Market Prediction
Quantle
Quantle is a no-code platform that empowers traders to create, backtest, and deploy automated trading bots. Using an intuitive drag-and-drop interface and AI-powered optimization, users can build and validate complex strategies against historical data in minutes and deploy them seamlessly to over 10 supported brokers. It's designed for both beginners and professionals seeking to automate their trading without writing a single line of code.
No Code
Tradepost.ai
Tradepost.ai is an AI-powered market intelligence platform designed to simplify trading. It delivers one high-conviction, easy-to-understand trading signal each day, complete with clear entry, stop-loss, and target prices. Ideal for traders of all levels who want to leverage data-driven insights without complex analysis or coding.
Analytics