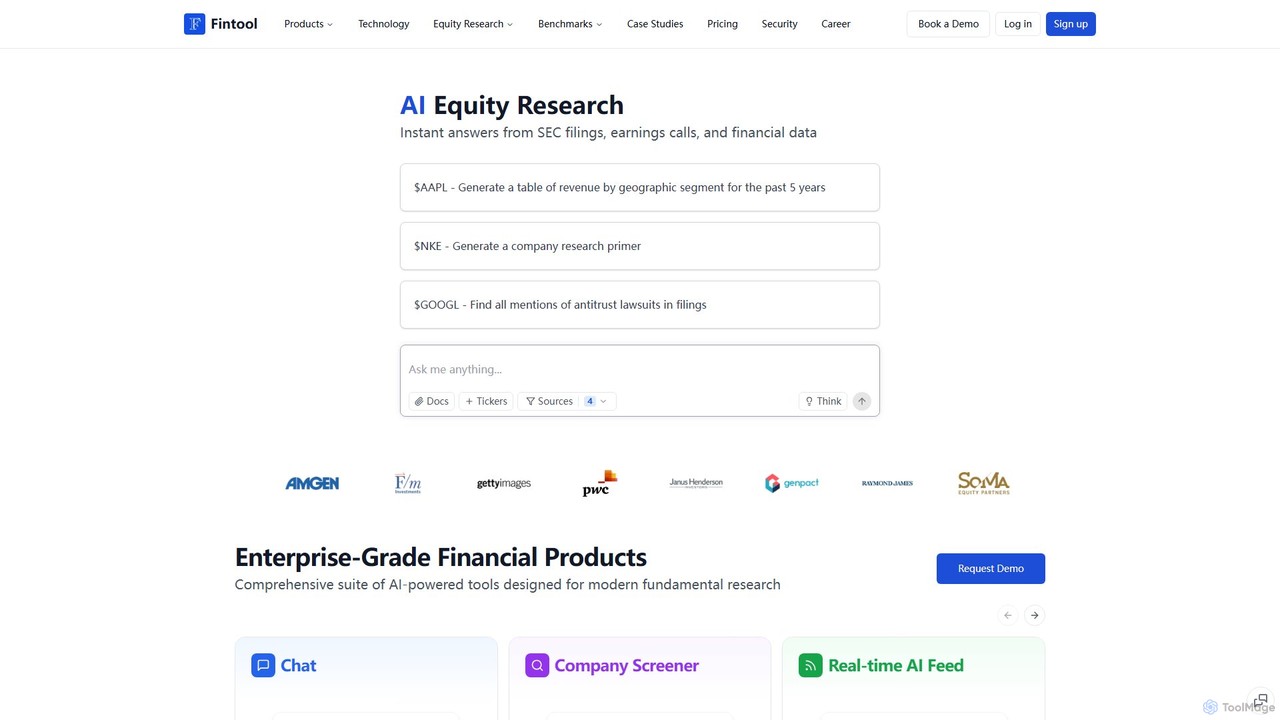
Fintool is an AI-powered equity research copilot designed for investment professionals. It streamlines financial analysis by answering complex questions, generating company reports, screening for industry trends, and providing real-time insights from SEC filings, earnings calls, and other primary sources.

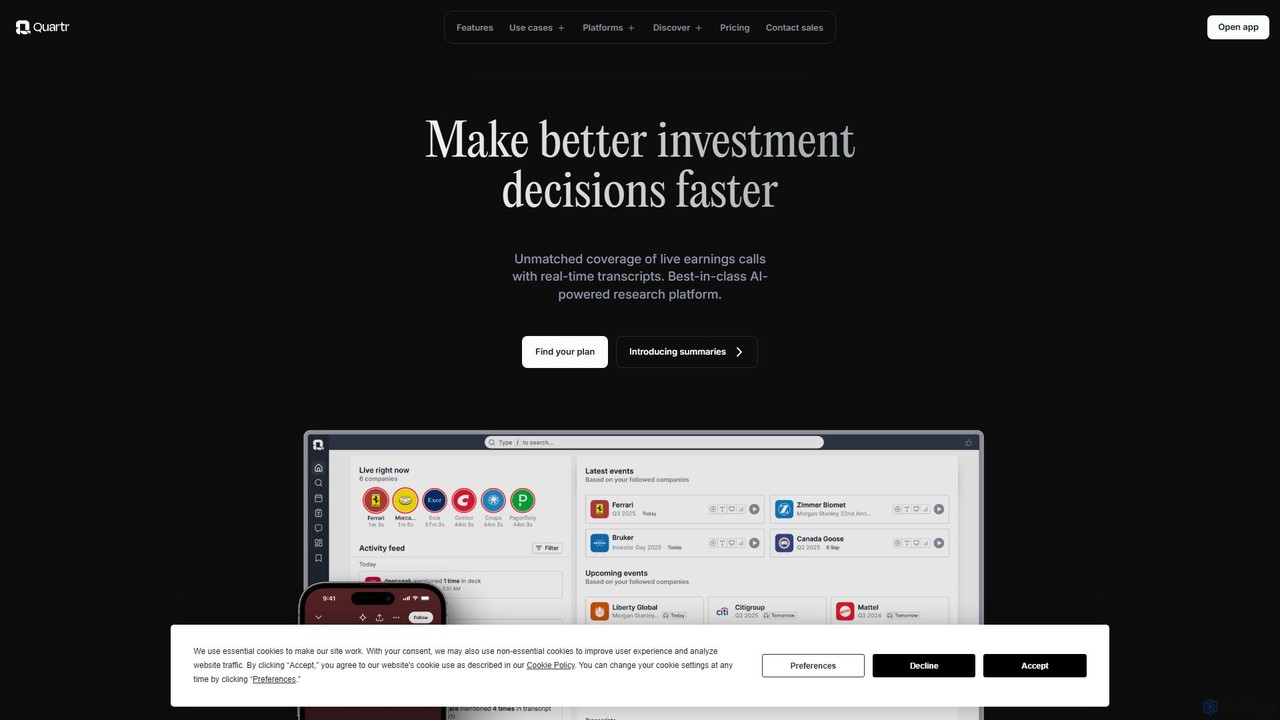
Quartr is an AI-powered financial research platform designed for investors and analysts. It provides access to live earnings calls, real-time transcripts, reports, and an AI chat to analyze over 13,000 public companies. Streamline your qualitative research and make faster, more informed investment decisions.
Product overview
Fintool Product overview
Fintool is an AI-powered equity research copilot designed for investment professionals. It streamlines financial analysis by answering complex questions, generating company reports, screening for industry trends, and providing real-time insights from SEC filings, earnings calls, and other primary sources.
Quartr Product overview
Quartr is an AI-powered financial research platform designed for investors and analysts. It provides access to live earnings calls, real-time transcripts, reports, and an AI chat to analyze over 13,000 public companies. Streamline your qualitative research and make faster, more informed investment decisions.
Detailed feature comparison
| Feature | Fintool | Quartr |
|---|---|---|
| Primary category | Data Analysis | Data Extraction |
| Added | 2025-08-11 | 2025-08-16 |
| Pricing | Freemium | Freemium |
| Official website | fintool.com | quartr.com |
| Product type | Website | Website |
| Performance data | ||
| User rating | Not verified | Not verified |
| Comments | 0 | 0 |
| Monthly visits | 11.9K | 458.1K |
| Monthly growth | -77.9% | 17.9% |
| Favorites | 127 | 107 |
| Details | View details | View details |
Fintool vs Quartr monthly traffic
Compare Fintool and Quartr by monthly reach, traffic trend, visit depth, top regions, and acquisition sources.
How to interpret the traffic data
In the Fintool vs Quartr monthly traffic comparison, Fintool currently shows 11.9K visits and Quartr shows 458.1K; Quartr has about 38.4 times the visible traffic of Fintool, an absolute difference of about 446.2K visits. This reflects visible reach, not feature quality or paid users.
Both tools provide verified traffic details, so monthly trends, visit depth, regions, and acquisition sources can be compared on the same basis.
Fintool monthly traffic:
Latest traffic
Monthly traffic trend
- 2025/9: 32.2K Monthly visits
- 2026/1: 111.6K Monthly visits
- 2026/2: 168.9K Monthly visits
- 2026/3: 140.1K Monthly visits
- 2026/4: 53.9K Monthly visits
- 2026/5: 11.9K Monthly visits
Top regions
Top 5 countries/regions
| Country/region | Percentage | Traffic |
|---|---|---|
| 🇺🇸United States | 51.93% | 6.2K |
| 🇮🇳India | 19.76% | 2.4K |
| 🇫🇷France | 12.48% | 1.5K |
| 🇧🇷Brazil | 10.47% | 1.2K |
| 🇳🇱Netherlands | 5.36% | 639 |
Traffic sources
| Source type | Percentage | Traffic |
|---|---|---|
| Direct | 57.31% | 6.8K |
| Referral | 40.09% | 4.8K |
| 2.6% | 310 |
Search keywords
Quartr monthly traffic:
Latest traffic
Monthly traffic trend
- 2025/9: 360K Monthly visits
- 2026/1: 372.9K Monthly visits
- 2026/2: 420.2K Monthly visits
- 2026/3: 462.6K Monthly visits
- 2026/4: 388.4K Monthly visits
- 2026/5: 458.1K Monthly visits
Top regions
Top 5 countries/regions
| Country/region | Percentage | Traffic |
|---|---|---|
| 🇺🇸United States | 62.35% | 285.6K |
| 🇸🇪Sweden | 11.59% | 53.1K |
| 🇮🇳India | 10.9% | 49.9K |
| 🇬🇧United Kingdom | 10.55% | 48.3K |
| 🇰🇷Korea, Republic of | 4.61% | 21.1K |
Traffic sources
| Source type | Percentage | Traffic |
|---|---|---|
| Direct | 80.69% | 369.6K |
| Referral | 15% | 68.7K |
| 4.31% | 19.7K |
Search keywords
Usage comparison
Compare the core capabilities of Fintool and Quartr
Fintool Core features
Quartr Core features
Use cases
Fintool Use cases
Quartr Use cases
Fintool vs Quartr:In-depth comparison and selection guidance
First decide whether the products solve the same kind of need
This in-depth Fintool vs Quartr comparison uses only the product records, taxonomy, audience, traffic, and community signals available on this page. Fintool is primarily listed under “Data Analysis”, while Quartr is primarily listed under “Data Extraction”, so the first decision is whether your actual task matches their recorded scope.
The structured fields currently show these decision-relevant differences: Primary category (Fintool: Data Analysis; Quartr: Data Extraction); Monthly visits (Fintool: 11.9K; Quartr: 458.1K); Monthly growth (Fintool: -77.9%; Quartr: 17.9%); Favorites (Fintool: 127; Quartr: 107); Website (Fintool: fintool.com; Quartr: quartr.com). These facts are more useful for selection than brand visibility alone.
What market visibility and monthly traffic mean
In the Fintool vs Quartr monthly traffic comparison, Fintool currently shows 11.9K visits and Quartr shows 458.1K; Quartr has about 38.4 times the visible traffic of Fintool, an absolute difference of about 446.2K visits. This reflects visible reach, not feature quality or paid users.
Both tools provide verified traffic details, so monthly trends, visit depth, regions, and acquisition sources can be compared on the same basis.
If public market visibility is an important first-pass criterion, investigate Quartr first. The final choice should still follow taxonomy, use case, and a real trial because higher traffic does not prove broader capabilities or better workflow fit.
Product positioning, use cases, and roles
Fintool and Quartr currently overlap in shared categories: Research; shared tags: earnings calls, financial analysis, investment, and stock market. This can place both on the same shortlist, but it does not prove equal implementation, depth, or cost.
Fintool's unique categories/tags are Data Analysis, Investment Analysis, AI copilot, equity research, financial data, fundamental analysis, portfolio management, and SEC filings; Quartr's are Data Extraction, Investment Research, AI chat, data extraction, investor relations, market research, qualitative analysis, and transcription. These unique fields are the strongest differentiators: validate the product whose recorded scope matches the task instead of following traffic alone.
What ratings, comments, and favorites can tell you
Fintool has no verified rating, 0 comments, 127 favorites, and 125 likes;Quartr has no verified rating, 0 comments, 107 favorites, and 93 likes。
Neither product has enough rating or comment samples for a credible reputation ranking.
Selection guidance by actual need
When to evaluate Fintool first
Put Fintool on the priority trial list when the task aligns with “Data Analysis” and especially Data Analysis, Investment Analysis, AI copilot, equity research, financial data, and fundamental analysis. This follows recorded positioning and does not imply unlisted capabilities are absent.
Fintool also currently records: pricing is freemium, product type is website, 11.9K verified monthly visits, no verified user rating. Verify any hard requirement around price, platform, or reach before trial, and do not let sparse review data substitute for testing.
When to evaluate Quartr first
Put Quartr on the priority trial list when the task aligns with “Data Extraction” and especially Data Extraction, Investment Research, AI chat, data extraction, investor relations, and market research. This follows recorded positioning and does not imply unlisted capabilities are absent.
Quartr also currently records: pricing is freemium, product type is website, 458.1K verified monthly visits, no verified user rating. Verify any hard requirement around price, platform, or reach before trial, and do not let sparse review data substitute for testing.
How to validate the recommendation before deciding
The available data describes positioning, public visibility, and community signals, but it cannot prove output quality, speed, integration effort, privacy, or long-term cost in your workflow. Before deciding, run the same representative tasks in Fintool and Quartr, then record completion time, accuracy, manual corrections, and the real paid threshold. A like-for-like trial turns this comparison into a defensible adoption decision.
Comparison FAQ
How should I choose between Fintool and Quartr?
Where does this comparison data come from?
What do unknown fields mean?
Related AI tools

BeeBee.AI
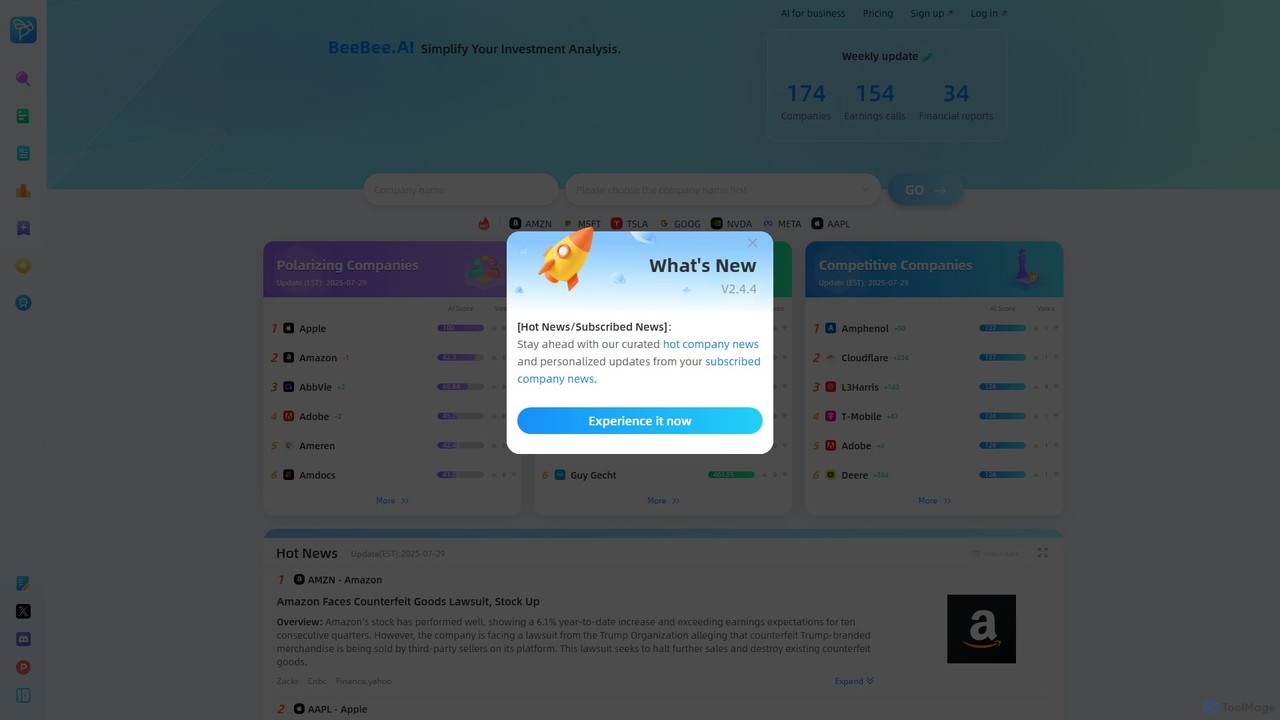
BeeBee.AI is an AI-powered investment analysis tool for the US stock market. It simplifies complex financial data by providing AI-driven summaries and in-depth analysis of earnings calls, 10-K/10-Q reports, and other financial documents. The platform tracks over 3000 companies, offering structured insights, sentiment analysis, and interactive Q&A to help investors make informed decisions quickly and efficiently.
Financial Data
Stockinsights.ai
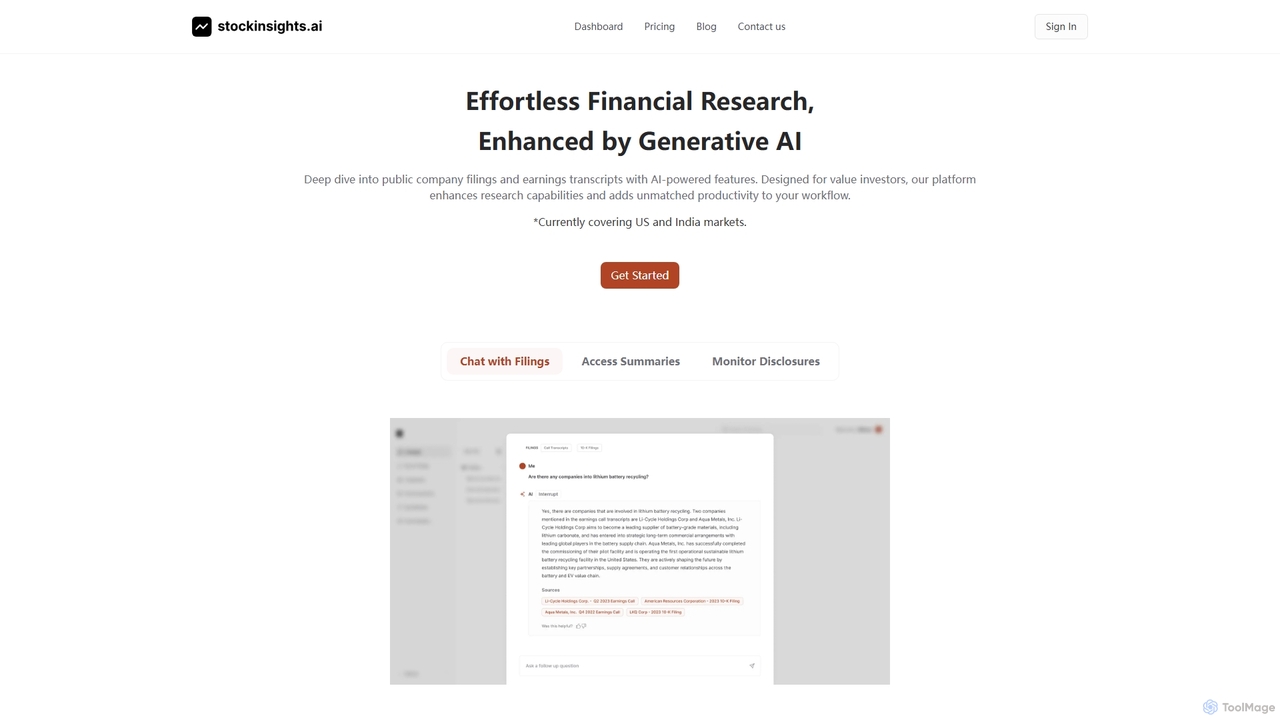
Stockinsights.ai is an AI-powered equity research assistant designed for investors. It uses generative AI to analyze and summarize public company filings, earnings calls, and financial data from US and Indian markets, streamlining due diligence and portfolio tracking.
Financial Analysis
Fey
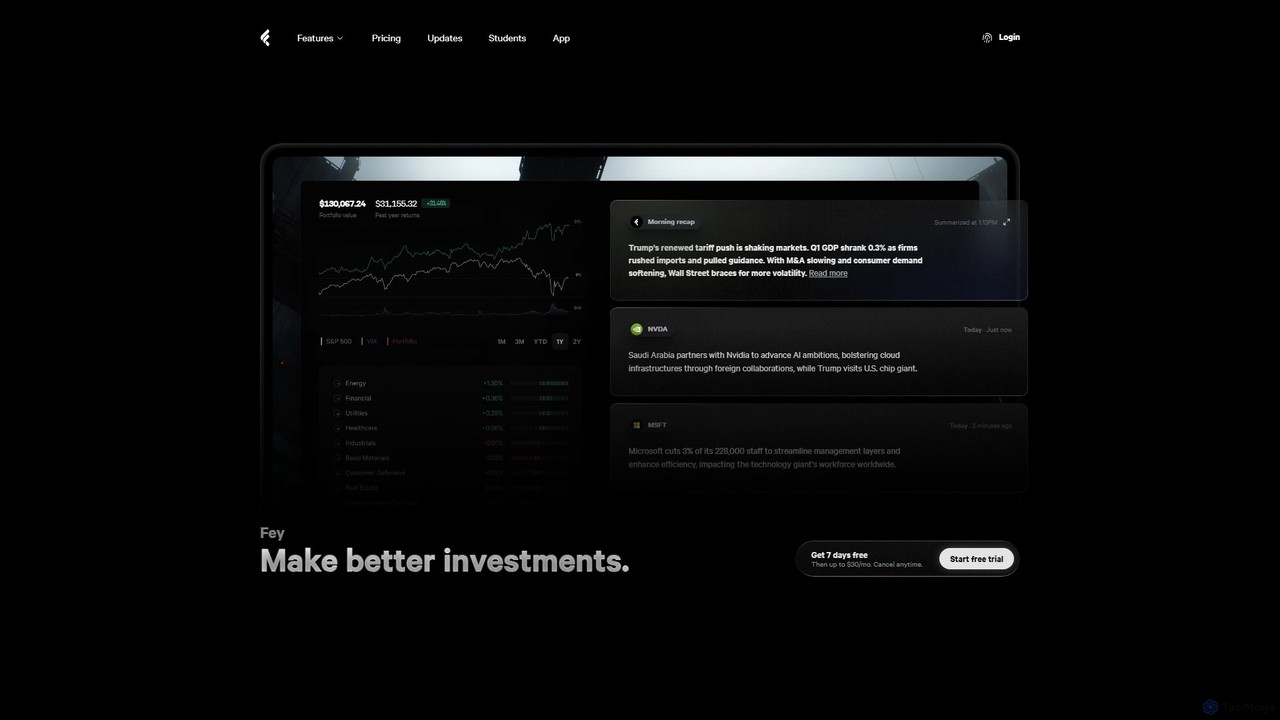
Fey is an AI-powered investment research platform that simplifies financial markets. It transforms complex data, news, and earnings reports into clear, actionable insights using AI summaries, real-time alerts, and a natural language stock screener. Sync your portfolio, track performance, and make better investment decisions with its beautiful, ad-free interface.
Financial Analysis
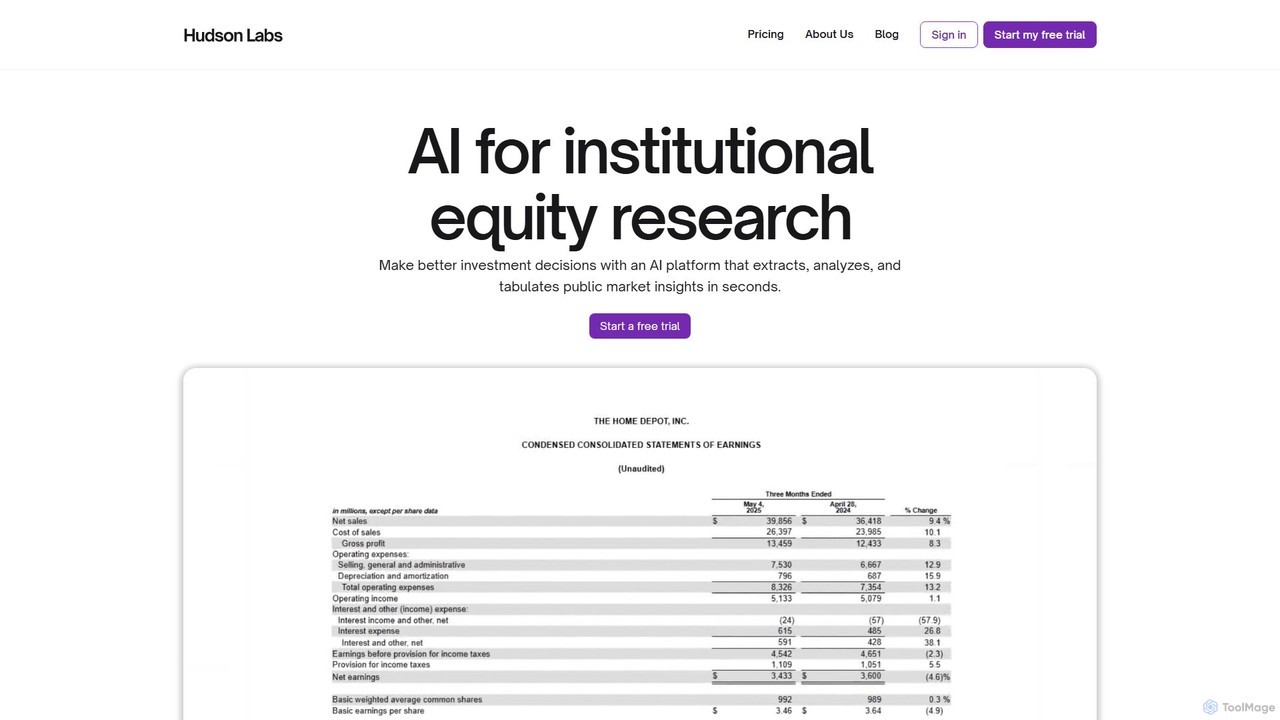
Hudson Labs
Hudson Labs is an AI platform for institutional equity research, designed to help investors make better decisions. It extracts, analyzes, and tabulates insights from public market documents like SEC filings and earnings calls in seconds, providing actionable intelligence with full data integrity.
Business Intelligence
Reportify
Reportify is an AI-powered investment research engine that aggregates and analyzes vast financial documents like earnings reports, conference calls, and research papers. It provides intelligent summaries, Q&A, and data extraction to help investors and analysts make informed decisions quickly and efficiently.
Data Analysis
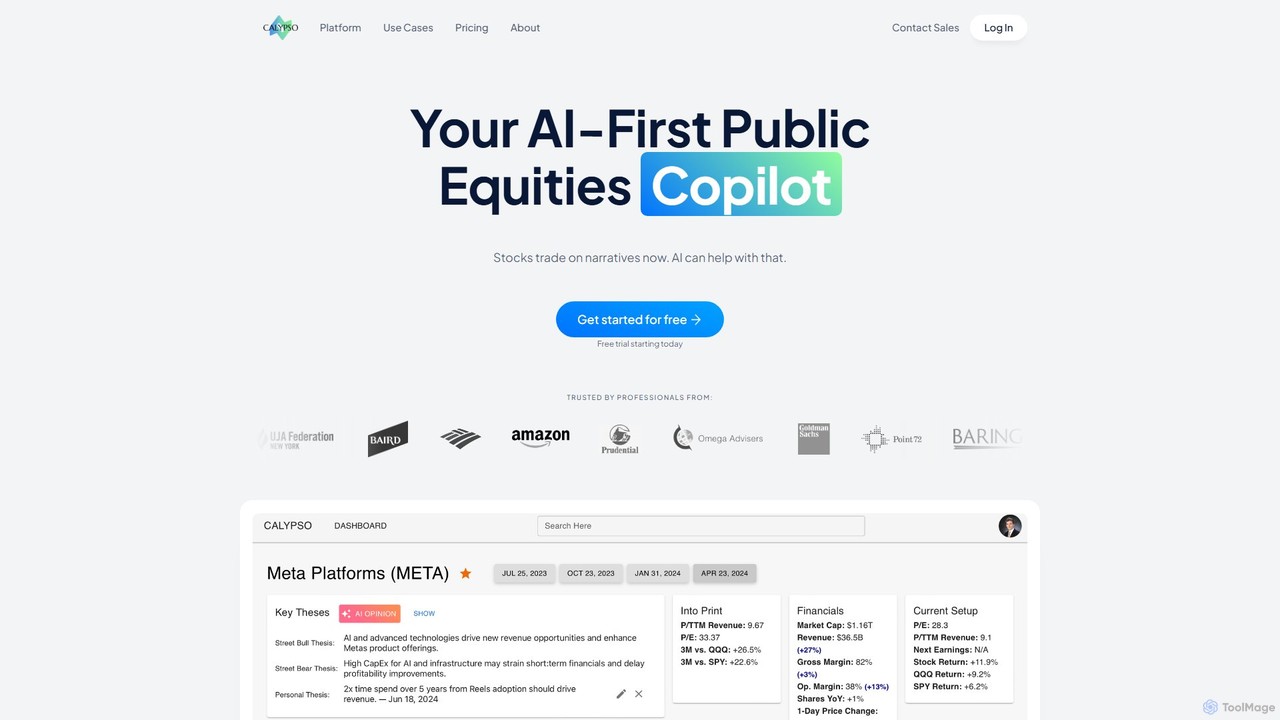
Calypso Copilot
Calypso Copilot is an AI-first platform for public equities analysis, designed for investors, analysts, and hedge funds. It leverages GPT-4 and finance-trained models to provide jargon-free company profiles, AI-powered insights from transcripts and reports, and interactive chats to test investment theses. It streamlines research by summarizing earnings calls, identifying key market debates, and tracking financial data, helping users make faster, more informed investment decisions.
Business Intelligence
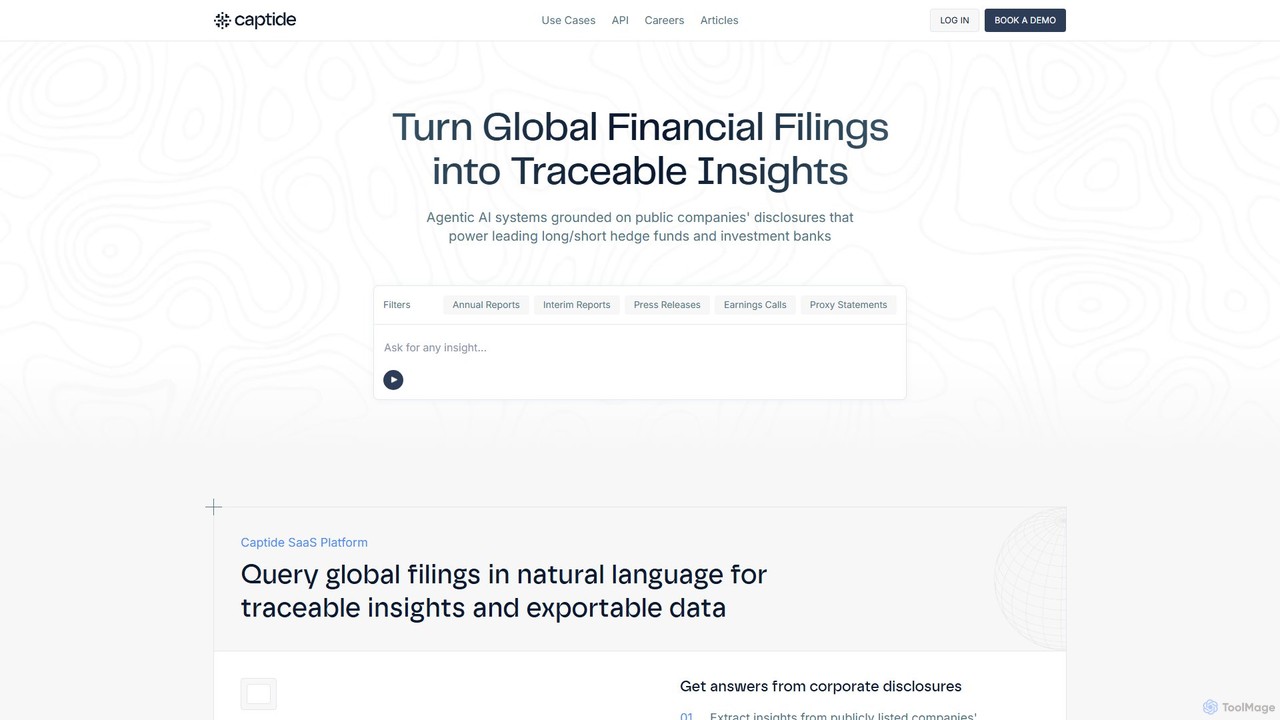
Captide
Captide is an AI-powered platform for financial professionals that transforms global financial filings into actionable, traceable insights. Using natural language queries, it automates data extraction, comparative analysis, and research workflows, enabling hedge funds, investment banks, and asset managers to make faster, data-driven decisions.
Api
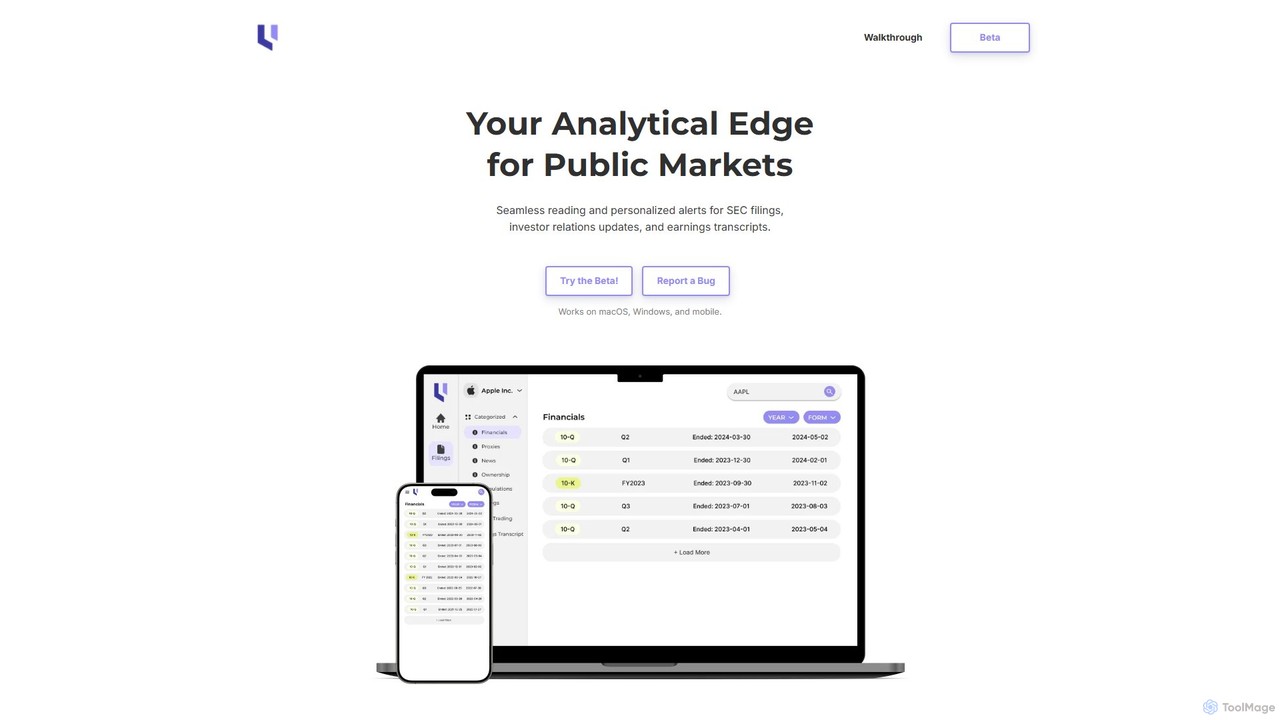
Unlevered
Unlevered is an AI-powered platform designed for investors and financial analysts to streamline investment due diligence. It automates the analysis of SEC filings and other financial documents, providing features like real-time filing alerts, sector-specific screeners, insider trading insights, and AI-summarized earnings call transcripts. By leveraging advanced AI, Unlevered helps users quickly uncover critical information and make more informed investment decisions.
Market Research
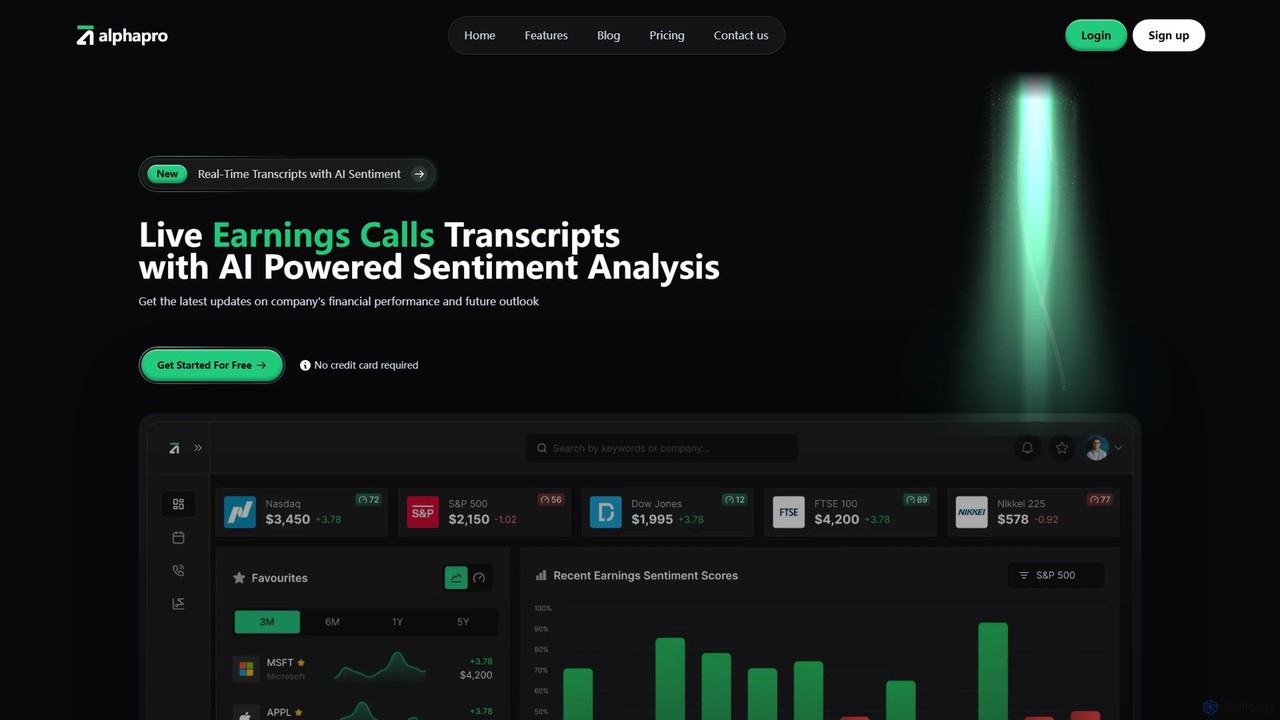
AlphaPro
AlphaPro is an AI-powered platform providing real-time earnings call transcripts and advanced sentiment analysis. It helps investors and analysts quickly understand corporate financial performance and future outlook, enabling smarter, data-driven investment decisions.
Investment
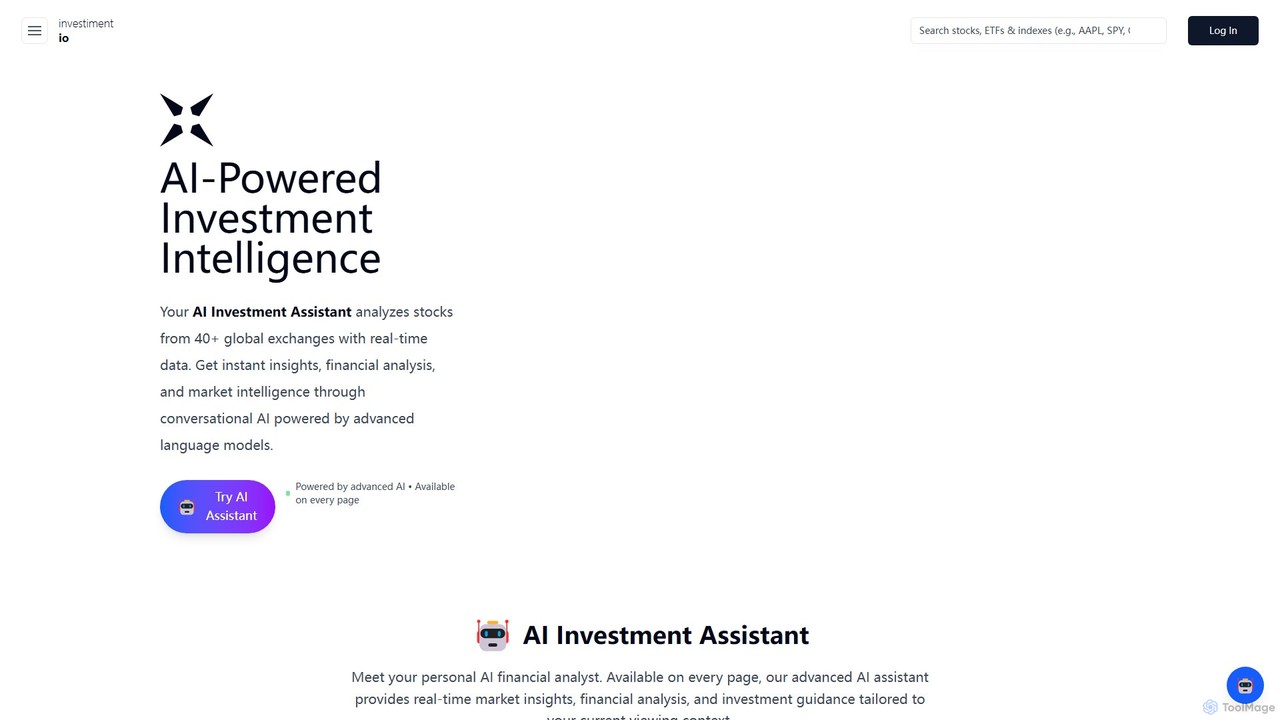
investiment.io
investiment.io is an AI-powered investment platform featuring a conversational AI assistant. It provides real-time financial analysis, market intelligence, and stock screening for over 40 global exchanges. Users can ask questions in plain English to get instant insights on stock valuation, financial health, and market trends, making institutional-grade analysis accessible to all investors.
Investing
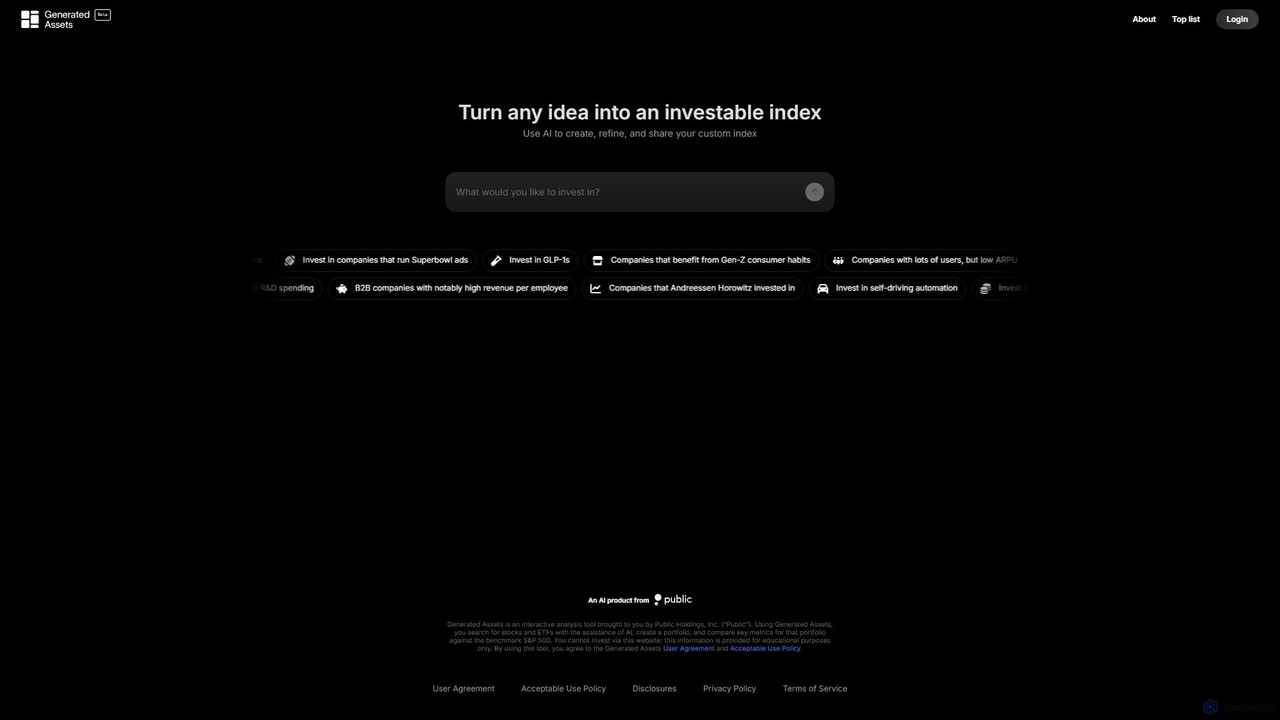
GeneratedAssets
GeneratedAssets is an AI-powered tool that transforms any investment idea into a custom, hypothetical index. Users can create, refine, and analyze portfolios using natural language prompts. The platform provides detailed performance metrics, comparison against the S&P 500, and social sharing features, making it an excellent educational resource for testing investment theses without financial risk.
Learning
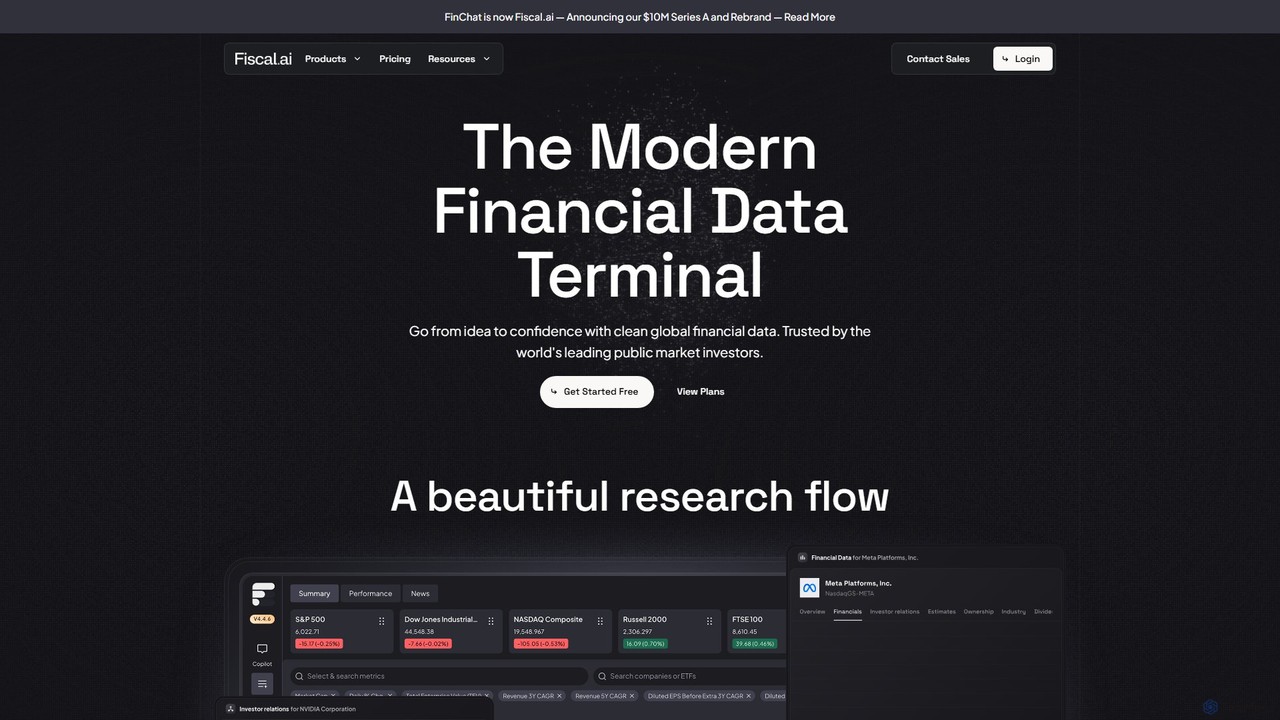
Fiscal.ai
Fiscal.ai (formerly FinChat) is an AI-powered stock research platform offering institutional-grade global financial data. It combines a modern data terminal with an AI assistant to help investors analyze equities, ETFs, and funds. Users can ask complex financial questions in natural language, visualize data, track portfolios, and access comprehensive investor relations content, streamlining the entire investment research process.
Investment Research
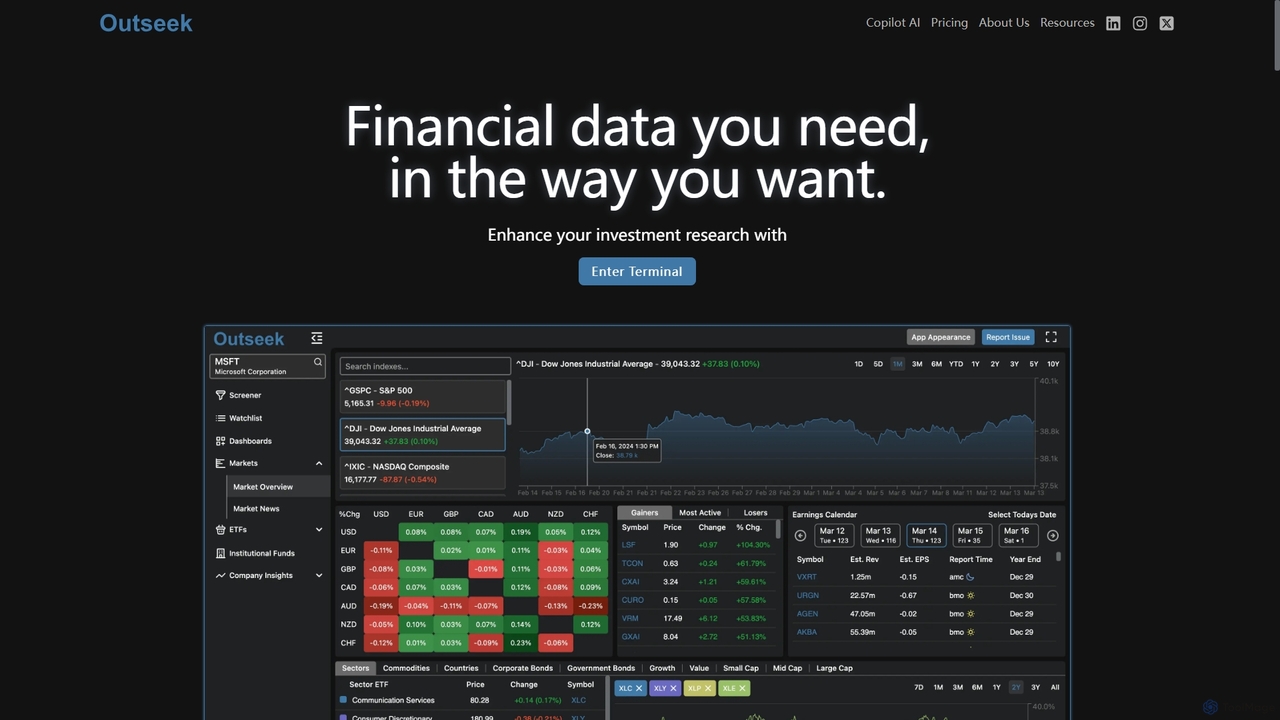
Outseek
Outseek is an AI-powered financial research terminal designed for the modern investor. It provides institutional-grade data, innovative visualizations, and an AI Copilot to enhance investment research. Access over 35 years of financial data, track social media sentiment, analyze insider trading, and utilize a powerful stock screener to make more informed decisions quickly and efficiently.
Data Analysis
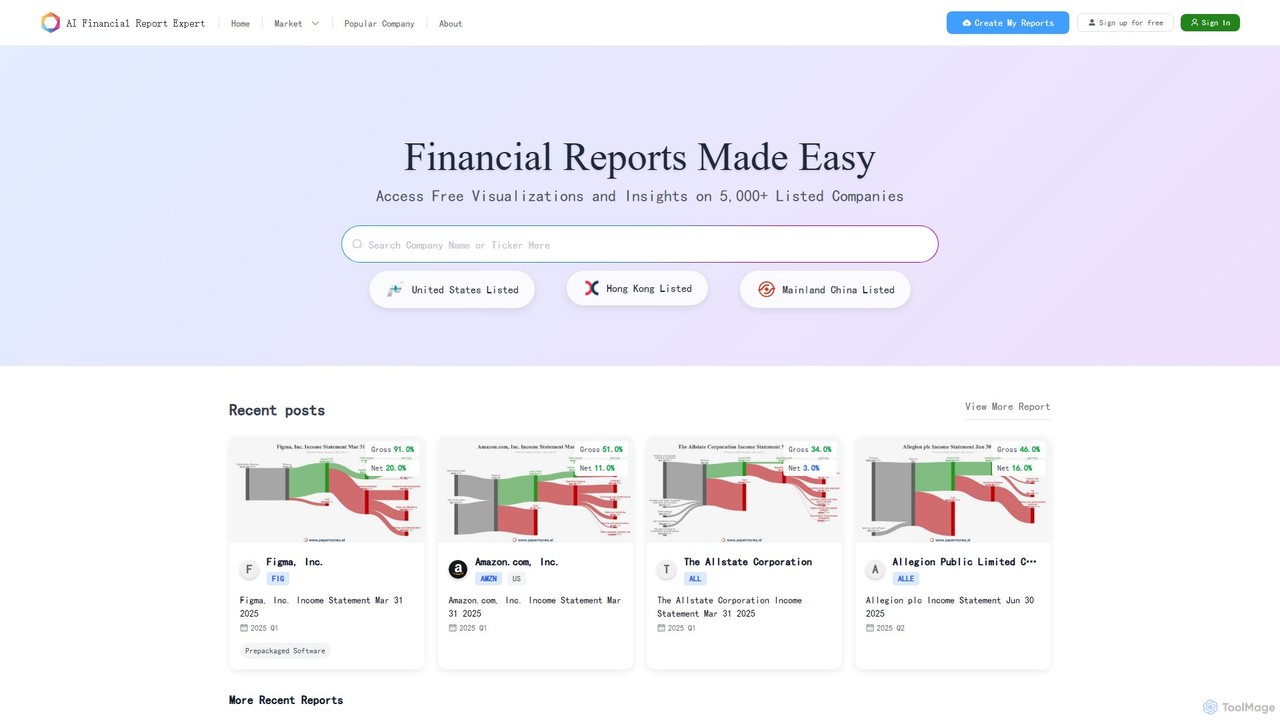
papermoney
papermoney is an AI-powered financial analysis platform that transforms complex financial reports of over 5,000 public companies into intuitive visual charts. It provides free access to key insights from income statements, balance sheets, and cash flow statements for companies listed in the US, Hong Kong, and Mainland China. Ideal for investors, analysts, and students seeking to quickly understand a company's financial health.
Finance
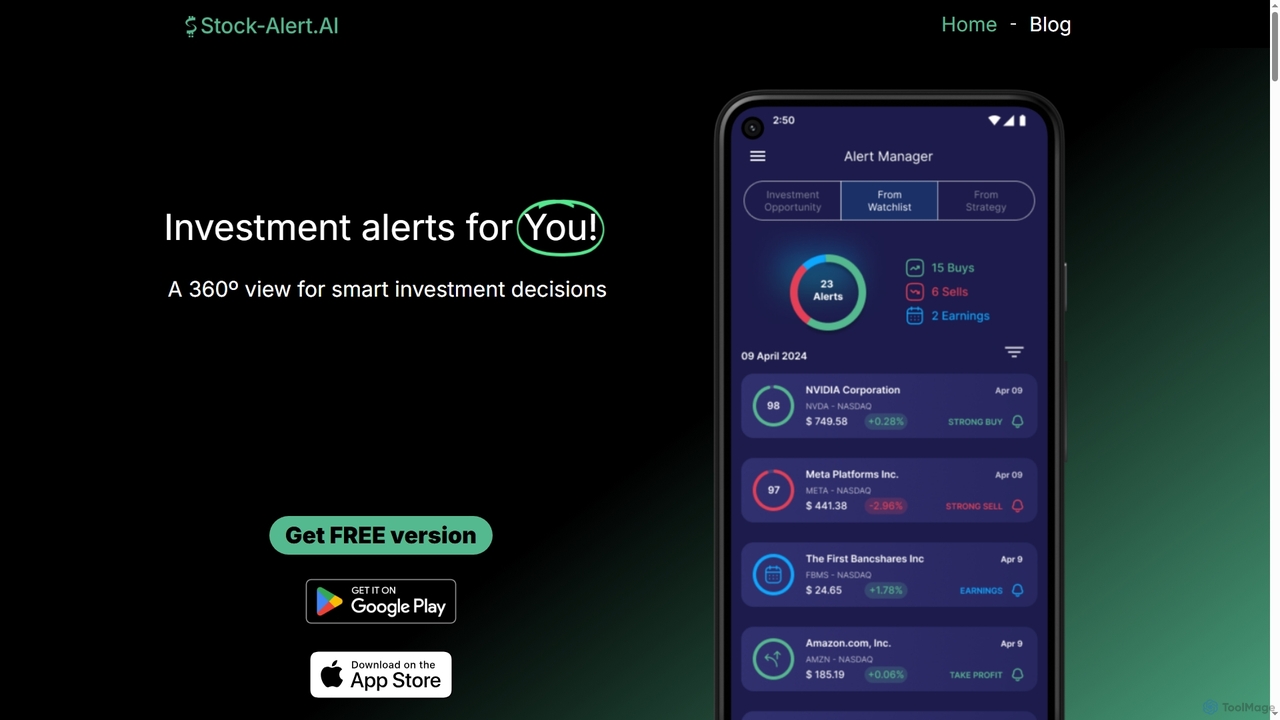
Stock Alert
Stock Alert is an AI-powered tool providing investment alerts for US stocks. It helps traders make informed decisions by offering buy/sell signals, position monitoring, and a stock screener. Alerts are triggered by technical indicators, news, and predictive analytics based on 12 years of back-tested data.
Analytics