ToolMage
Sign in

Best 4 Financial Data AI tools for Data Analysis

Popular Financial Data AI tools in Data Analysis include Crawfield Dutton, Stock Alpha, BeeBee.AI, and welltrade.ai, helping you work more efficiently.

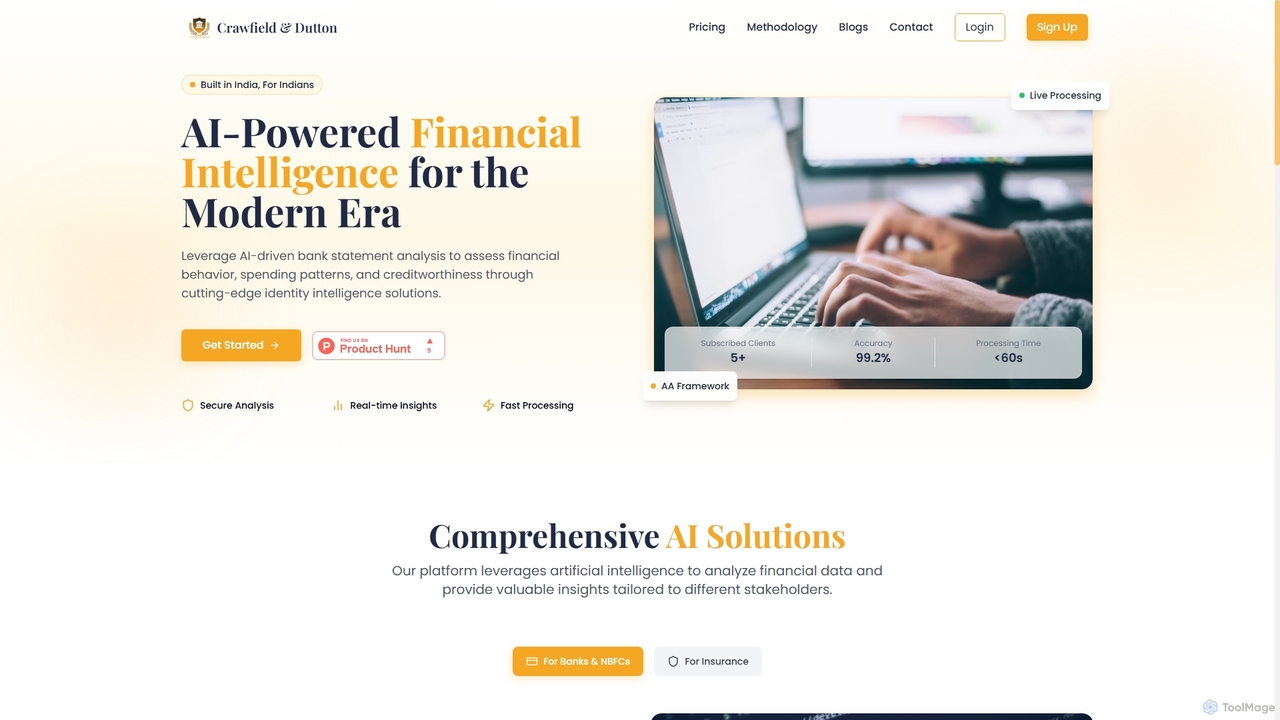
Crawfield Dutton

Crawfield Dutton is an AI-powered financial intelligence platform built in India for the Indian market. It offers advanced bank statement analysis to assess financial behavior, spending patterns, and creditworthiness, providing real-time insights for banks, NBFCs, insurance companies, and individuals.

Financial Data
Visits 4.7KFavorites 45Likes 44
Freemium

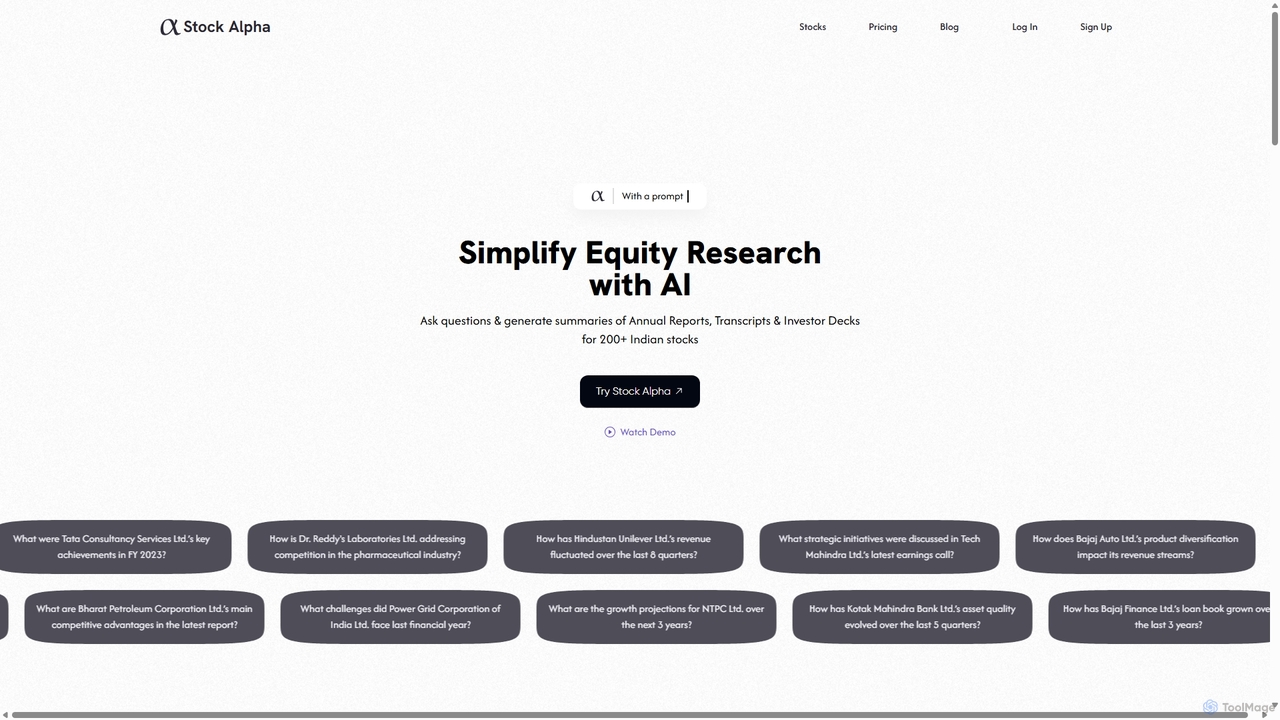
Stock Alpha

Stock Alpha is an AI-powered equity research platform designed to simplify financial analysis for Indian stocks. It allows users to ask natural language questions, generate summaries of official company documents like annual reports and earnings calls, and extract financial data into structured tables, saving hours of manual research.

Financial Data
Visits 4.3KFavorites 103Likes 107
Freemium

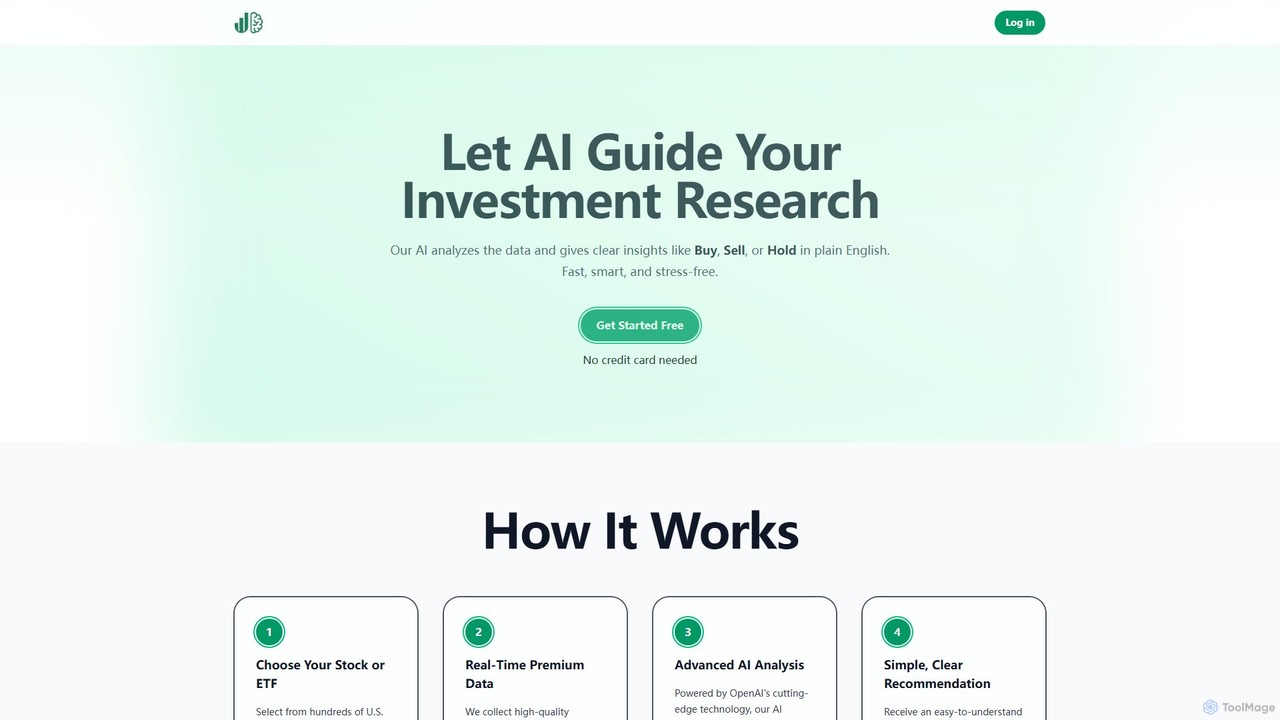
welltrade.ai

Welltrade.ai is an AI-powered investment research platform that simplifies stock and ETF analysis. It uses advanced AI to process vast amounts of financial data, delivering clear "Buy, Sell, or Hold" recommendations in plain English, supported by concise reasons. It's designed for new investors, active traders, and busy professionals seeking fast, data-driven insights to make informed investment decisions without the complexity.

Financial Data
Visits 3.4KFavorites 102Likes 108
Freemium

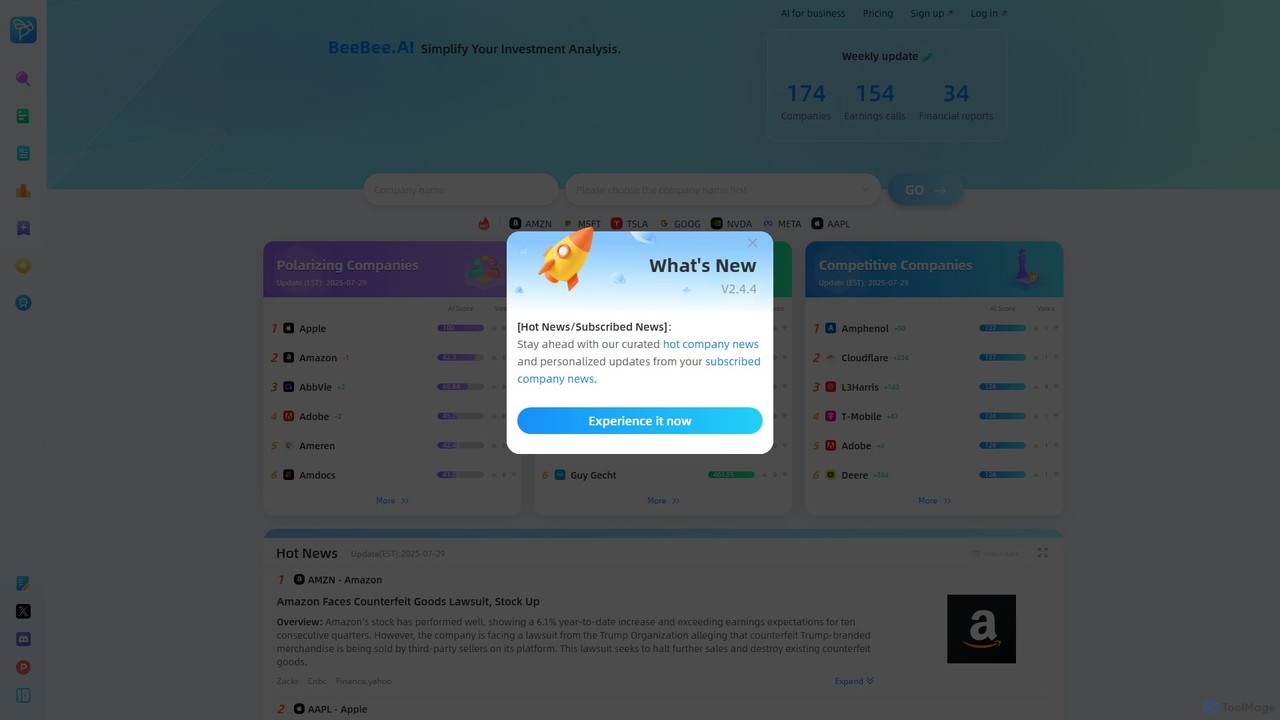
BeeBee.AI

BeeBee.AI is an AI-powered investment analysis tool for the US stock market. It simplifies complex financial data by providing AI-driven summaries and in-depth analysis of earnings calls, 10-K/10-Q reports, and other financial documents. The platform tracks over 3000 companies, offering structured insights, sentiment analysis, and interactive Q&A to help investors make informed decisions quickly and efficiently.

Financial Data
Visits 4KFavorites 90Likes 91

About Financial Data

AI Financial Data tools are specialized platforms designed to access, process, and analyze vast quantities of financial market information. They leverage APIs and machine learning to extract real-time and historical data from stock exchanges, economic reports, and corporate filings. These tools empower investors, analysts, and businesses to make data-driven decisions, identify market trends, and perform quantitative analysis. Unlike general data analysis platforms, they provide pre-structured, finance-specific datasets and models, significantly reducing data collection and preparation time.

Core Features

  • Real-time Data Feeds: Access live price data for stocks, forex, cryptocurrencies, and commodities.
  • Historical Data Access: Retrieve extensive historical datasets for backtesting trading strategies and performing long-term analysis.
  • Fundamental Data Analysis: Automatically parse and analyze corporate financial statements like income statements and balance sheets.
  • Alternative Data Integration: Incorporate non-traditional data sources such as social media sentiment, satellite imagery, or web traffic.
  • Economic Indicator Tracking: Monitor and analyze macroeconomic data including GDP, inflation rates, and employment figures.

Use Cases

These tools are primarily used by quantitative analysts, investment firms, hedge funds, and corporate finance departments. Common applications include developing algorithmic trading strategies, conducting equity research, managing portfolio risk, and performing market forecasting. They are also valuable for academic researchers studying financial markets.

How to Choose

When selecting a Financial Data tool, consider the following: data coverage (markets, asset classes, historical depth), API quality and reliability, data granularity (e.g., tick-level vs. daily), integration capabilities with your existing software, and the pricing model (per-call vs. subscription).

Featured tool rankings

Financial Data use cases

1

Backtesting Algorithmic Trading Strategies

A quantitative analyst (quant) at a hedge fund needs to validate a new trading algorithm. Using a financial data tool, they access 20 years of minute-by-minute historical price data for the S&P 500 index. The tool's API allows them to feed this data directly into their Python backtesting environment. The analyst simulates the algorithm's performance across various market conditions, including bull markets, bear markets, and high-volatility periods, to assess its profitability and risk profile before deploying it with real capital.

2

Conducting Fundamental Equity Research

An equity research analyst is tasked with creating a valuation model for a publicly traded tech company. Instead of manually collecting data from SEC filings, the analyst uses a financial data tool to programmatically pull 15 years of quarterly and annual financial statements (income statements, balance sheets, cash flow statements). The tool provides clean, standardized data, which is then used to calculate key financial ratios, forecast future earnings, and build a Discounted Cash Flow (DCF) model to determine the company's intrinsic value.

3

Monitoring Macroeconomic Trends for Investment

A global macro hedge fund manager needs to understand the economic health of several countries to inform their investment decisions. They use a financial data tool to access and visualize decades of macroeconomic indicators, such as GDP growth rates, Consumer Price Index (CPI), and unemployment figures for G20 nations. The platform's AI capabilities help identify correlations and leading indicators, allowing the manager to forecast potential currency fluctuations and shifts in government bond yields, thereby positioning their portfolio accordingly.

4

Analyzing Market Sentiment with Alternative Data

A fintech startup is developing a stock recommendation engine. To gain a competitive edge, they incorporate alternative data. Using a financial data tool's API, they stream millions of social media posts and news articles related to specific stocks. The tool's built-in Natural Language Processing (NLP) models analyze the text to generate a real-time sentiment score (positive, negative, neutral) for each stock. This sentiment data is then used as a feature in their machine learning model to predict short-term price movements more accurately.

5

Automating Corporate Due Diligence

An investment banking analyst is performing due diligence on a potential acquisition target. The process requires analyzing years of financial health and identifying any red flags. The analyst uses a financial data tool to instantly aggregate all public filings, earnings call transcripts, and analyst ratings for the target company. The AI features can automatically flag unusual accounting practices or highlight key risks mentioned in the 'Risk Factors' section of annual reports, reducing manual review time from days to hours and ensuring a more thorough analysis.

6

Real-time Portfolio Risk Management

A portfolio manager at an asset management firm is responsible for a multi-asset class portfolio. They use a financial data tool to stream real-time market data for all their holdings (stocks, bonds, commodities). The platform continuously calculates key risk metrics like Value at Risk (VaR) and portfolio volatility. If a specific asset's volatility spikes or correlations between assets change unexpectedly, the system sends an automated alert, allowing the manager to quickly rebalance the portfolio or hedge positions to mitigate potential losses.

Financial Data FAQ

What are AI Financial Data tools?

AI Financial Data tools are specialized software platforms that provide programmatic access to a wide range of financial information. They aggregate data from sources like stock exchanges, regulatory filings, and economic reports, offering it to users via APIs. Key features include real-time market data feeds, extensive historical datasets for analysis, fundamental company data, and increasingly, alternative data like news sentiment. They are essential for quantitative analysis, algorithmic trading, and data-driven investment research.

How to choose the right Financial Data tool?

Choosing the right tool depends on your specific needs. Consider these factors:

  • Data Coverage: Ensure it covers the markets (e.g., US equities, global forex), asset classes, and historical time frame you require.
  • API Quality: Look for a reliable, well-documented API with low latency, especially if you're building real-time applications.
  • Data Granularity: Do you need tick-by-tick data for high-frequency trading, or are daily closing prices sufficient for your analysis?
  • Features: Evaluate if it offers necessary features like fundamental data, economic indicators, or alternative data streams.
  • Cost: Compare pricing models. Some charge per API call, while others offer monthly subscriptions with different data limits.
What's the difference between Financial Data tools and general Business Intelligence (BI) tools?

The primary difference lies in the data source and specialization. Financial Data tools provide access to external, specialized financial market and economic data. They are designed for financial analysis, quantitative modeling, and trading. Business Intelligence (BI) tools, on the other hand, are general-purpose platforms designed to analyze a company's internal data, such as sales figures, customer information, and operational metrics. You bring your own data to a BI tool, whereas a Financial Data tool provides the data for you.

What types of data can be accessed through these tools?

Financial Data tools offer a diverse range of datasets, typically including:

  • Market Data: Real-time and historical prices for stocks, ETFs, forex, cryptocurrencies, and commodities.
  • Fundamental Data: Standardized financial statements (income, balance sheet, cash flow) from company filings.
  • Economic Data: Macroeconomic indicators like GDP, inflation (CPI), unemployment rates, and interest rates.
  • Alternative Data: Non-traditional sources such as news sentiment, social media trends, satellite imagery, and corporate ESG ratings.
  • Options Data: Pricing and greeks for options contracts.
Who are the primary users of Financial Data tools?

These tools cater to a range of professionals and institutions within the finance industry. Primary users include:

  • Quantitative Analysts (Quants): Who use the data to build and backtest complex trading models.
  • Hedge Funds and Asset Managers: For portfolio management, risk analysis, and strategy development.
  • Investment Bankers: For company valuation, M&A analysis, and due diligence.
  • Fintech Developers: Who build applications like robo-advisors or trading platforms that require financial data feeds.
  • Academic Researchers: For studying market behavior and economic trends.