

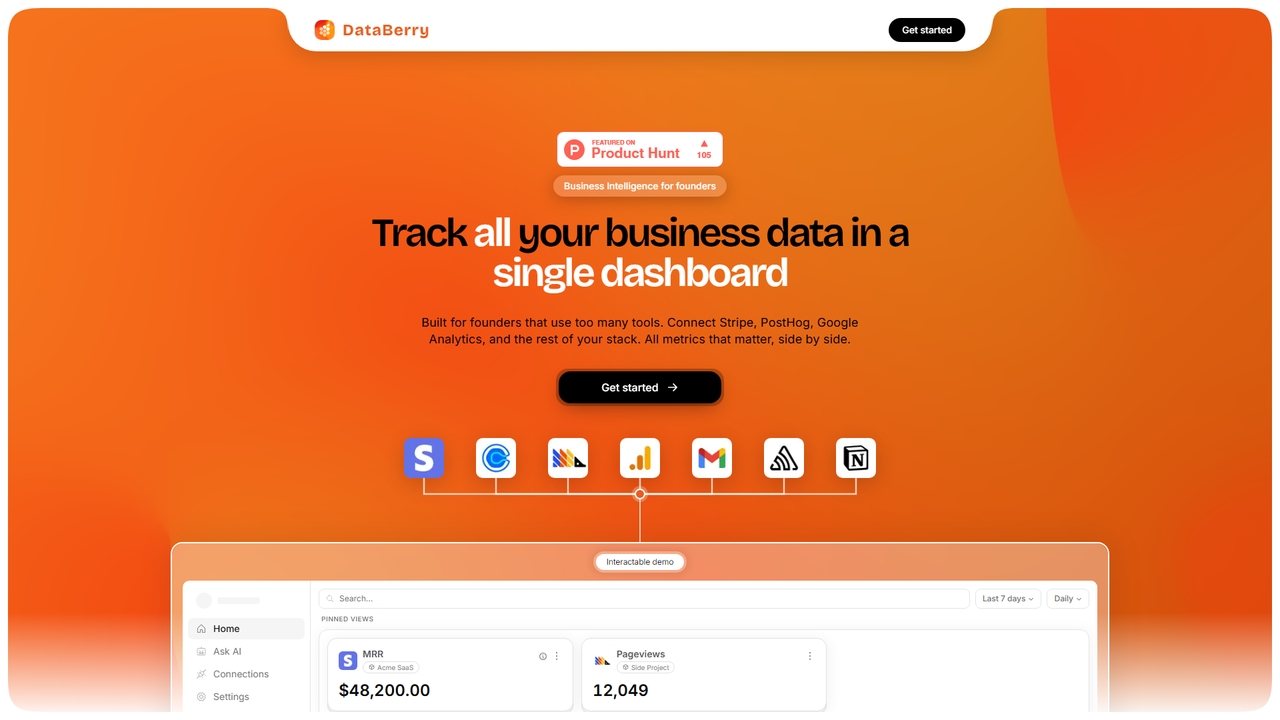
Databerry Overview
Databerry is a purpose-built business intelligence platform designed for founders and teams who juggle multiple analytics, billing, and productivity tools. It eliminates the need to switch between different dashboards by aggregating data from your entire tech stack—including Stripe, PostHog, Google Analytics, Sentry, and Calendly—into a single, unified view. This allows you to monitor critical metrics like Monthly Recurring Revenue (MRR), user funnels, website traffic, top customers, and application errors side by side, enabling faster, data-driven decisions without engineering overhead.
How to use Databerry
Getting started with Databerry is straightforward and requires no code changes to your existing setup. You begin by connecting your existing business tools via OAuth or API keys. For services like Stripe and Google Analytics, this is a one-click process. Once connected, you can create and customize project views, adding the specific metrics and data cards that matter most to your business. The platform automatically pulls and displays live data, allowing you to monitor your operations in real time.
Core Features of Databerry
- Unified Data Dashboard: Integrates data from Stripe, PostHog, Google Analytics, Sentry, Calendly, and more into one customizable interface.
- Multi-Project Support: Manage and view separate dashboards for different products or business lines within a single workspace.
- Real-Time Analytics: See live updates for metrics like MRR, gross volume, user sign-ups, active users, and error rates.
- Historical Time Travel: Access daily snapshots of all your metrics, allowing you to navigate to any past date and compare performance over time.
- No-Code Integration: Connect your tools without installing SDKs or writing any code. Databerry reads data from your existing accounts.
- Read-Only Access: All connections are read-only, ensuring your source data remains unmodified and secure.
Use Cases for Databerry
Databerry is ideal for startup founders and small teams running multiple products who need a consolidated view of business health. Marketing teams can track campaign sources and conversion funnels. Sales and finance can monitor revenue, top customers, and financial forecasts in real time. Product and engineering teams can oversee application uptime, error logs from Sentry, and development activity from GitHub. It is particularly useful for weekly review meetings and for anyone who spends too much time switching between tabs to gather business metrics.
Advantages of Databerry
The primary advantage of Databerry is its simplicity and focus. It saves significant time by eliminating context-switching between disparate tools. The setup is genuinely quick—taking minutes, not days, with no engineering work required. The "Time Travel" feature provides valuable historical context that most native dashboards lack. Its read-only architecture enhances security, and the platform is built with privacy in mind, using strong encryption and GDPR-compliant practices. It is an affordable alternative to complex, custom-built business intelligence solutions.
Pricing and Plans
Databerry offers a freemium model with four distinct plans:
- Free: $0/month. Includes 3 projects, 10 views per project, 1 connection per integration, and access to Google Analytics, PostHog, and Stripe integrations. Support is via email.
- Starter: $5/month. Unlocks all integrations. Includes 5 projects, 20 views per project, and 3 connections per integration. Support is via email.
- Pro: $15/month (first month is $5). Designed for teams, it offers 10 projects, 30 views per project, 10 connections per integration, and priority email support.
- Enterprise: Custom pricing. For larger organizations with needs for custom projects, views, connections, integrations, and support.
Databerry FAQ
Databerry Alternatives
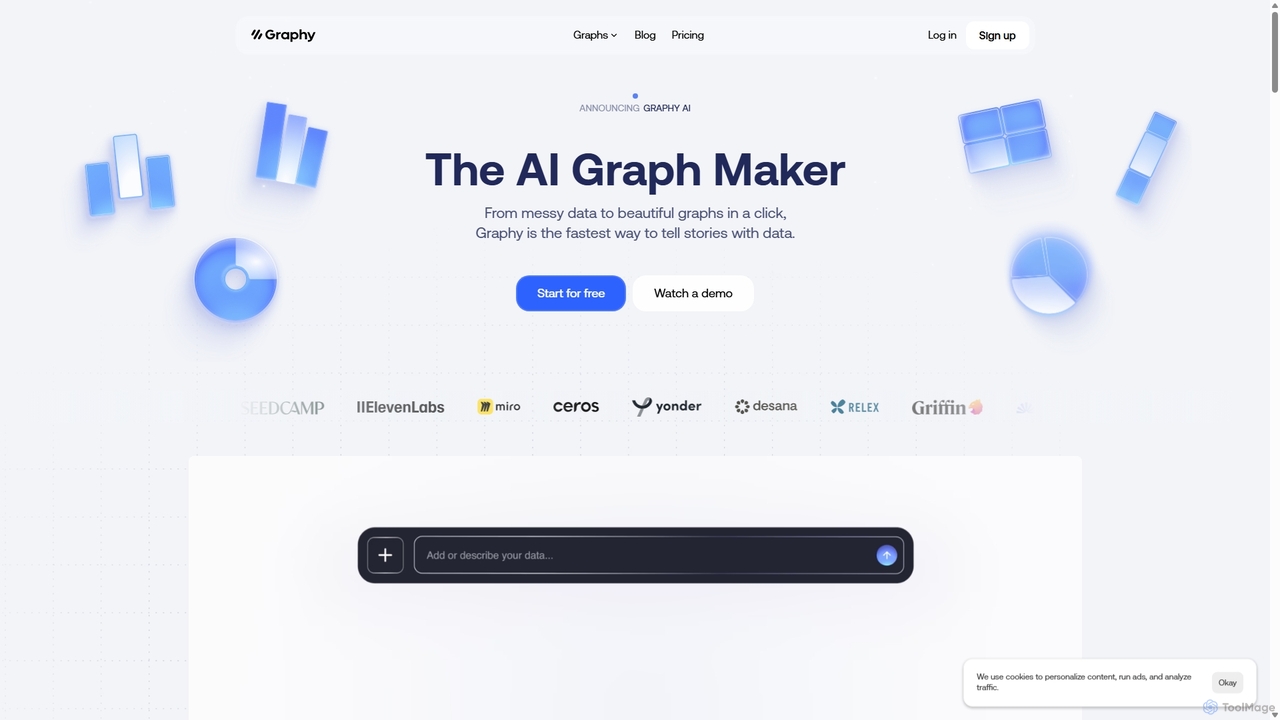
Graphy
Graphy is an AI-powered data visualization tool that transforms raw data into beautiful, interactive charts and graphs in seconds. It simplifies data storytelling by automatically identifying key insights, allowing users to chat with their data, and offering extensive customization. Ideal for marketers, analysts, and teams who need to create compelling visual reports and presentations without complex software.
3D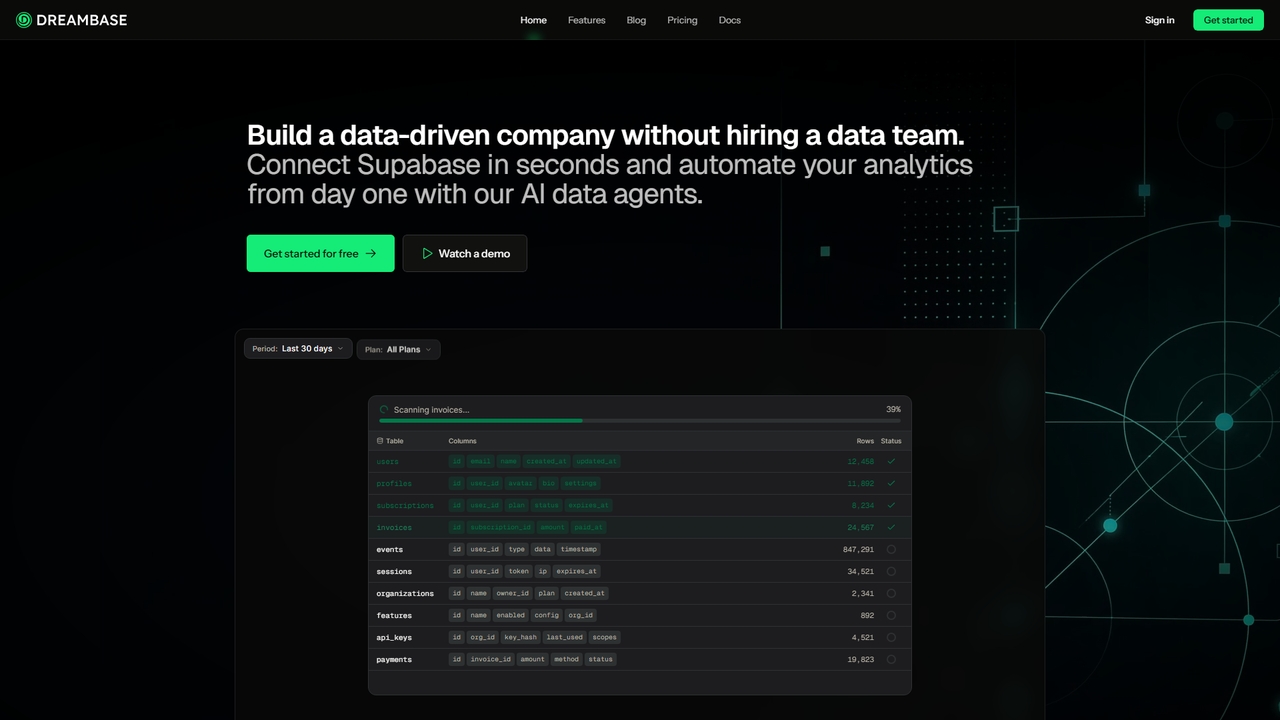

Meii
Meii is an enterprise-grade conversational AI platform that empowers businesses with cutting-edge agentic AI. It transforms raw data into instant, contextual insights, automates complex workflows, and facilitates seamless collaboration across departments. Designed for scalability and security, Meii helps enterprises make faster, smarter decisions and achieve a powerful AI strategy.
3D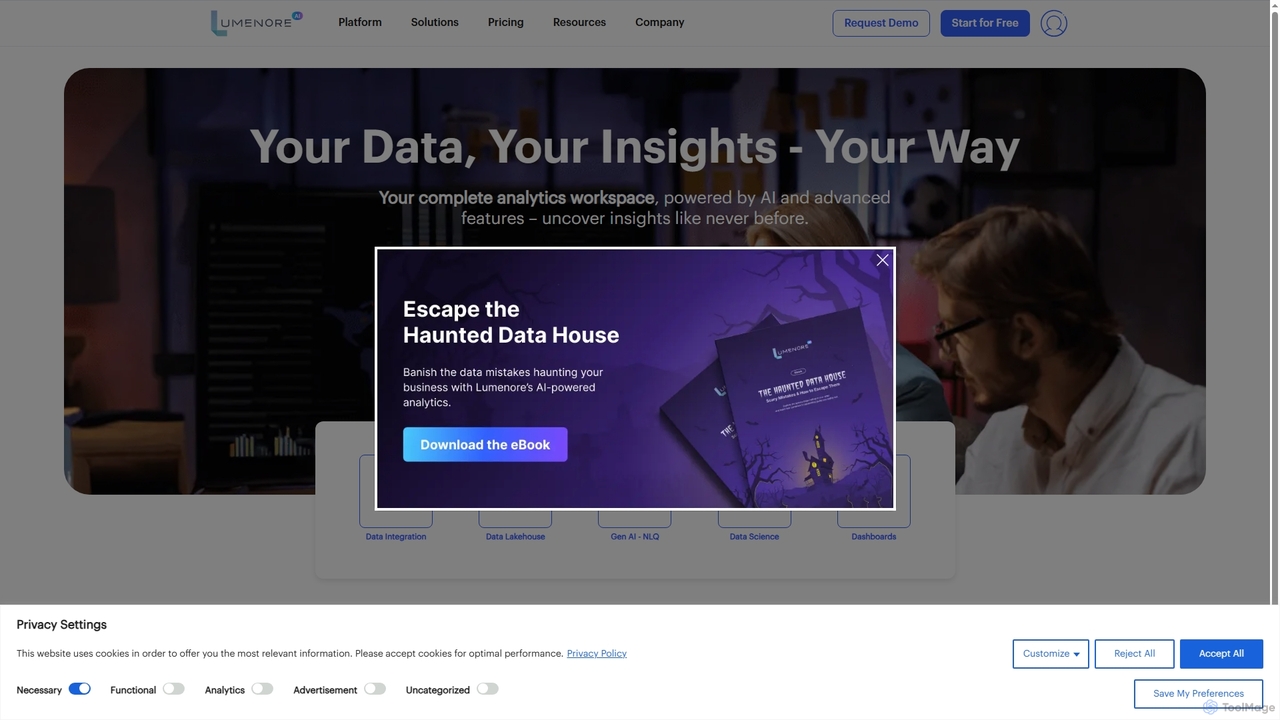
Lumenore
Lumenore is an AI-powered, no-code business intelligence and data analytics platform designed to transform complex data into actionable insights. It offers a complete analytics workspace with advanced features like Gen AI-powered Natural Language Query (NLQ), automated insights, and data storytelling, enabling businesses to make faster, informed decisions without requiring deep technical expertise.
3D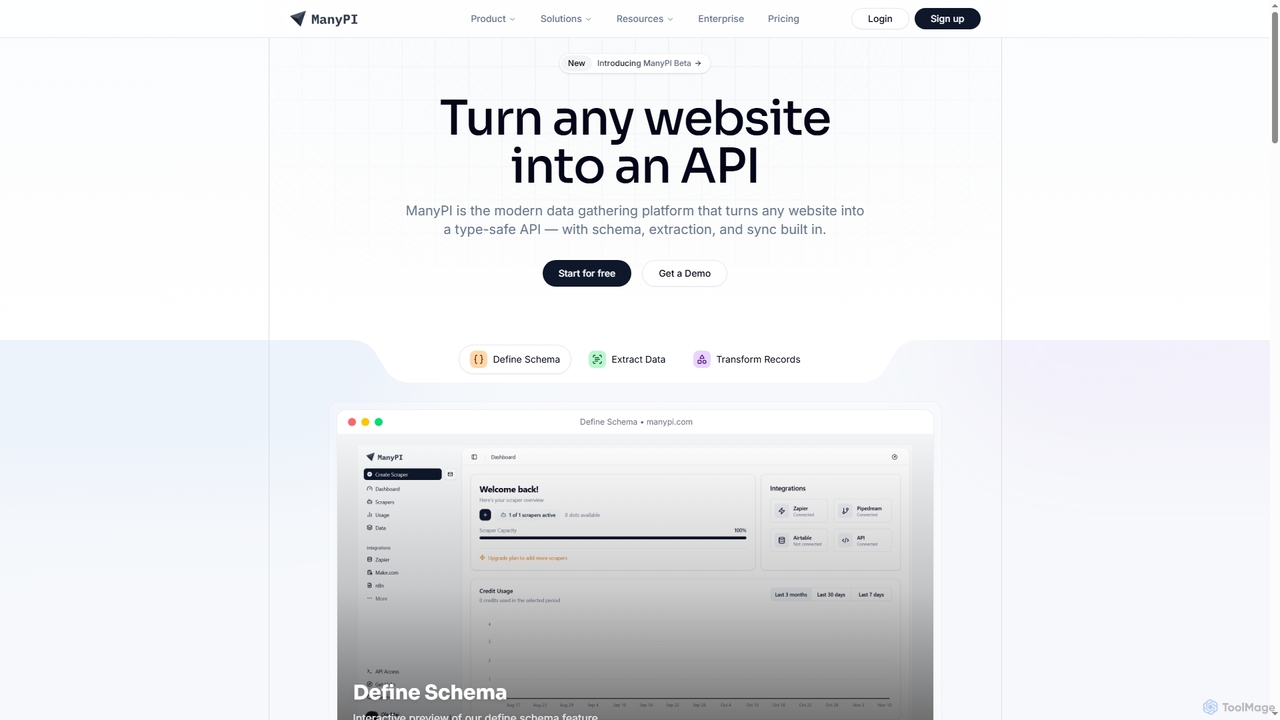
ManyPI
ManyPI is a modern data gathering platform that transforms any website into a type-safe API. It simplifies structured data extraction with built-in schema definition, data extraction, and record transformation, empowering developers and technical teams to reliably collect web data at scale.
3DDataberry Categories
Databerry Jobs
Databerry Embed Widget
Copy this embed code to place the badge on your blog, article, or product site and send readers directly to this ToolMage detail page.

Related AI tools
Dashup
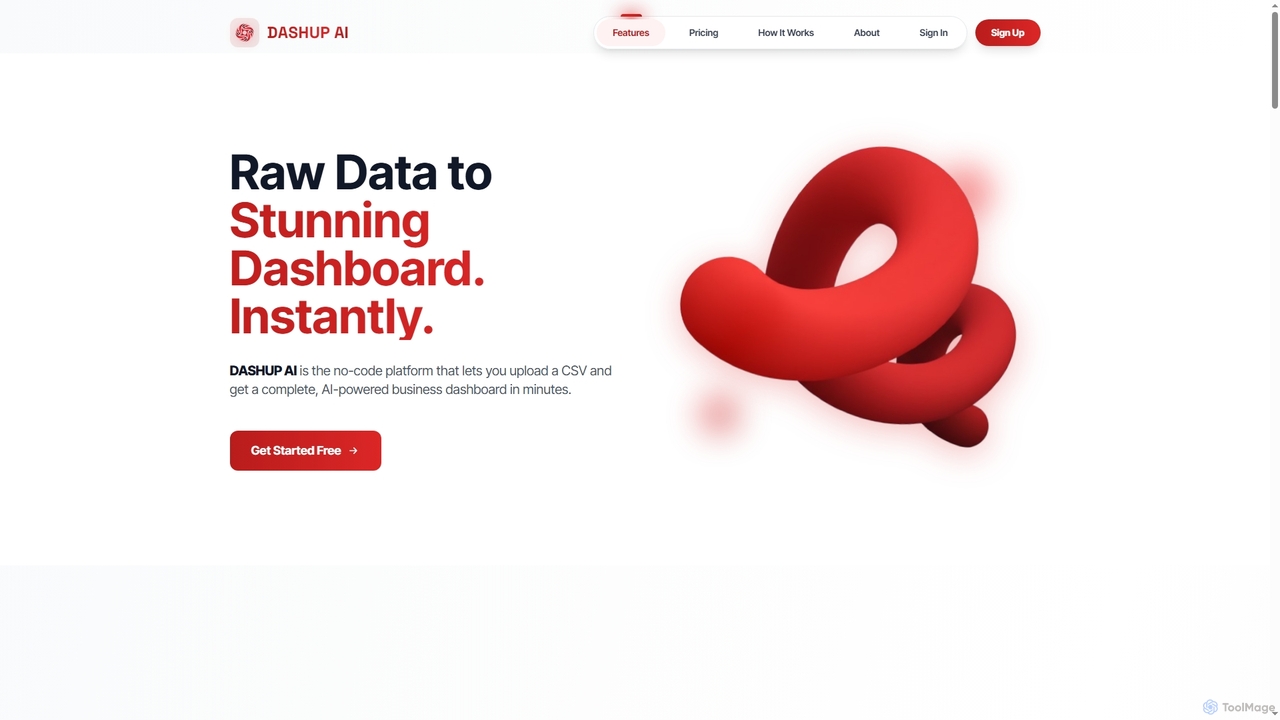
Dashup is a no-code AI platform that instantly transforms raw CSV data into stunning, interactive business dashboards. Simply upload your file, choose a template, and let the AI suggest key metrics and visualizations. No SQL or technical skills required. Go from spreadsheet to actionable insights in minutes, making data-driven decisions faster and easier.
Business Intelligence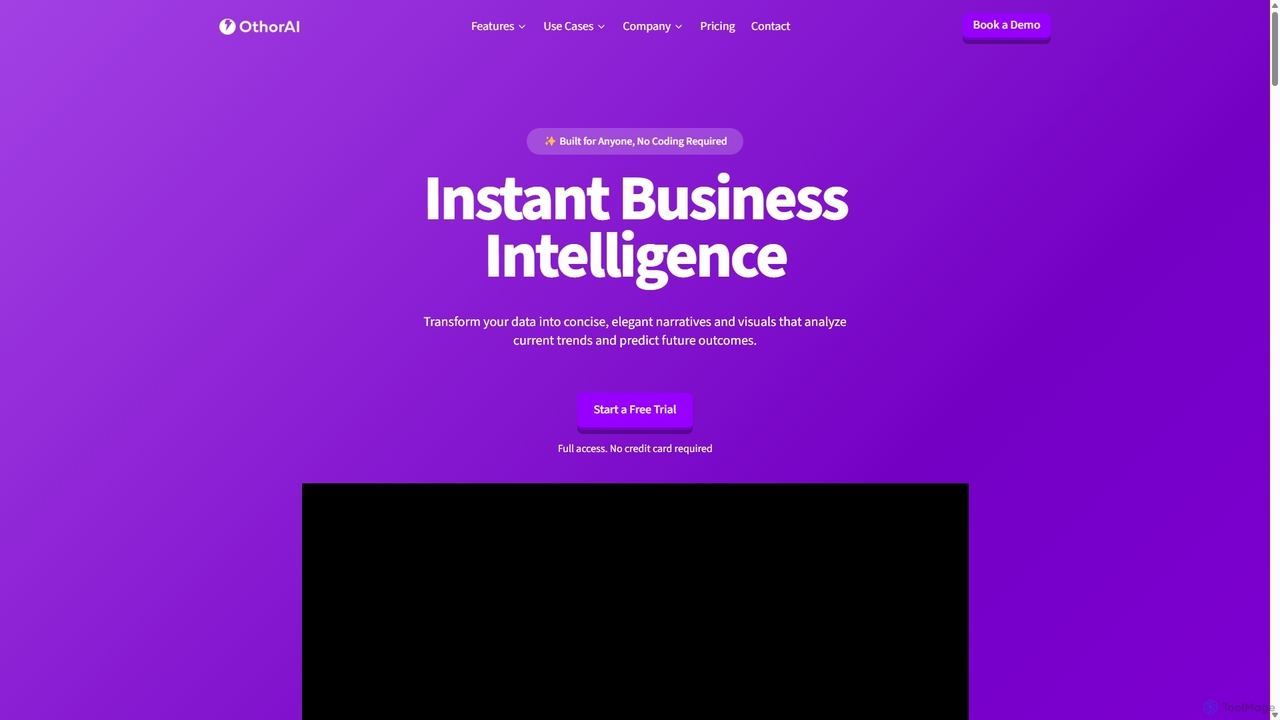
Othor AI
Othor AI is a no-code business intelligence platform that transforms your data into actionable insights in seconds. It automatically generates narrative-driven reports, smart charts, and predictive analytics, enabling anyone in your organization to make faster, data-driven decisions without technical expertise. Connect your data sources and get instant dashboards and executive summaries.
Business IntelligenceGraphy
Graphy is an AI-powered data visualization tool that transforms raw data into beautiful, interactive charts and graphs in seconds. It simplifies data storytelling by automatically identifying key insights, allowing users to chat with their data, and offering extensive customization. Ideal for marketers, analysts, and teams who need to create compelling visual reports and presentations without complex software.
3D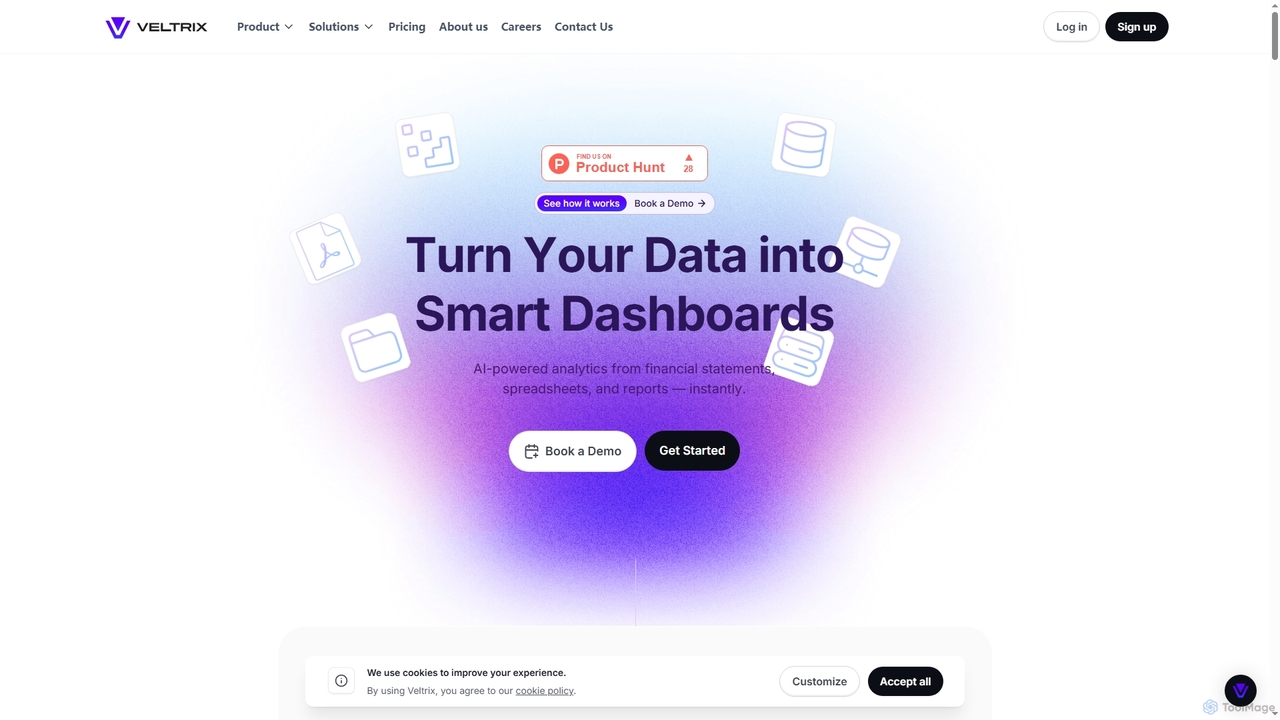
Veltrix
Veltrix is an AI-powered, no-code platform that transforms raw data from files and connected sources into interactive dashboards. Users can ask questions in plain language to get instant, visualized answers for business intelligence and financial analysis.
Business IntelligenceMeii
Meii is an enterprise-grade conversational AI platform that empowers businesses with cutting-edge agentic AI. It transforms raw data into instant, contextual insights, automates complex workflows, and facilitates seamless collaboration across departments. Designed for scalability and security, Meii helps enterprises make faster, smarter decisions and achieve a powerful AI strategy.
3D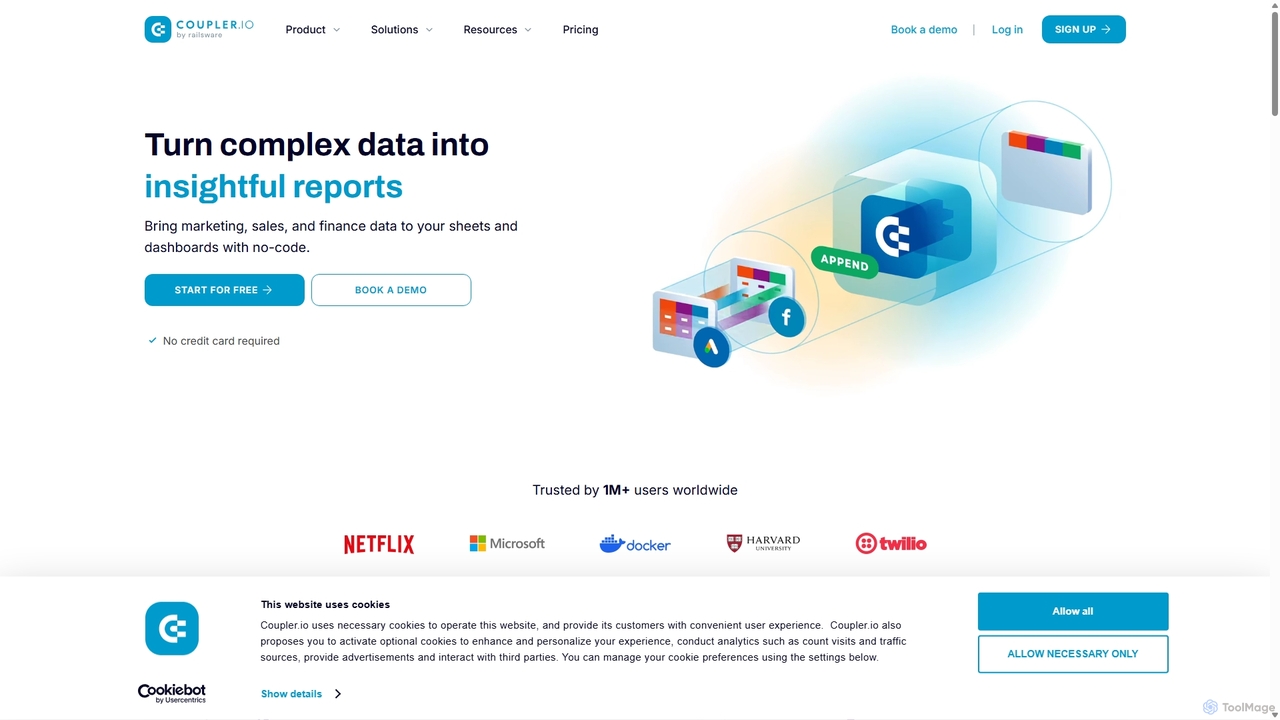
Coupler.io
Coupler.io is a no-code data analytics and automation platform that helps businesses connect disparate data sources from marketing, sales, and finance apps to spreadsheets, data warehouses, or BI tools. It automates data collection, transforms raw data into analysis-ready formats, and provides AI-powered insights and pre-built dashboard templates for faster, smarter decision-making.
Business Intelligence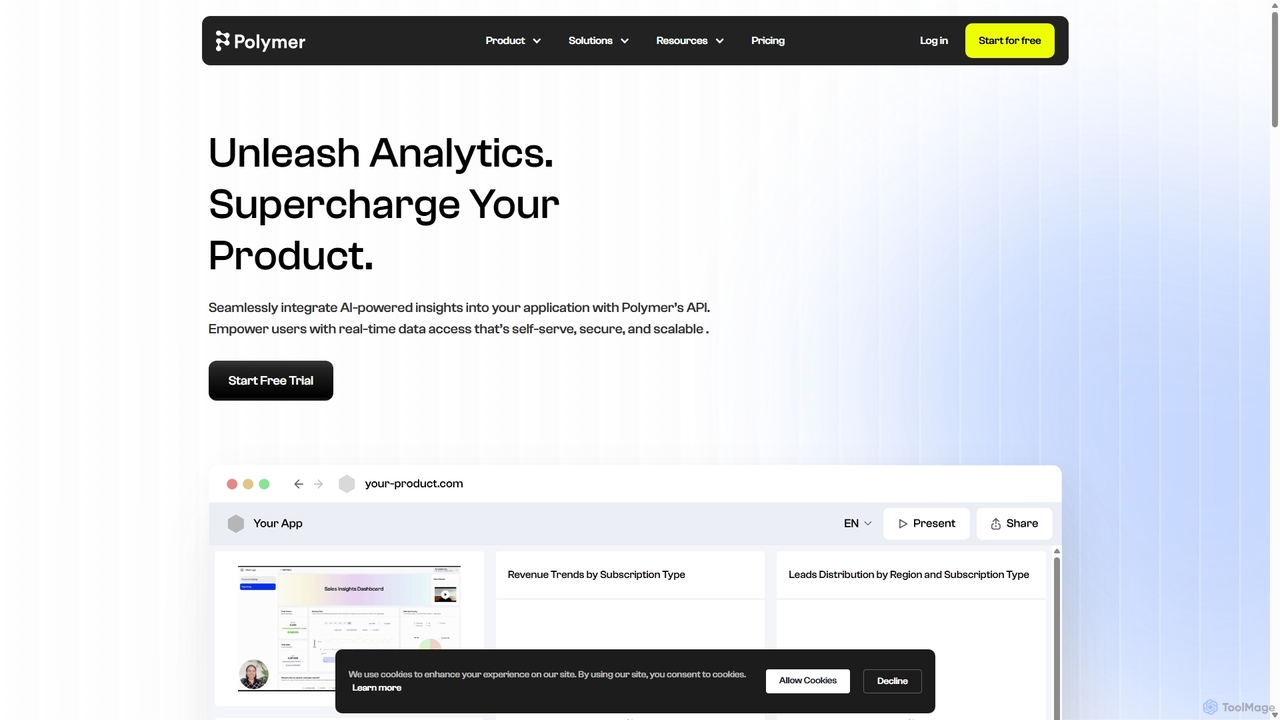
Polymer Search
Polymer Search is an AI-driven embedded analytics platform designed to supercharge products with powerful, white-labeled data visualizations. It enables seamless integration of beautiful dashboards and reports directly into your application, empowering users with self-serve analytics and AI-generated insights, all with minimal development effort.
Business Intelligence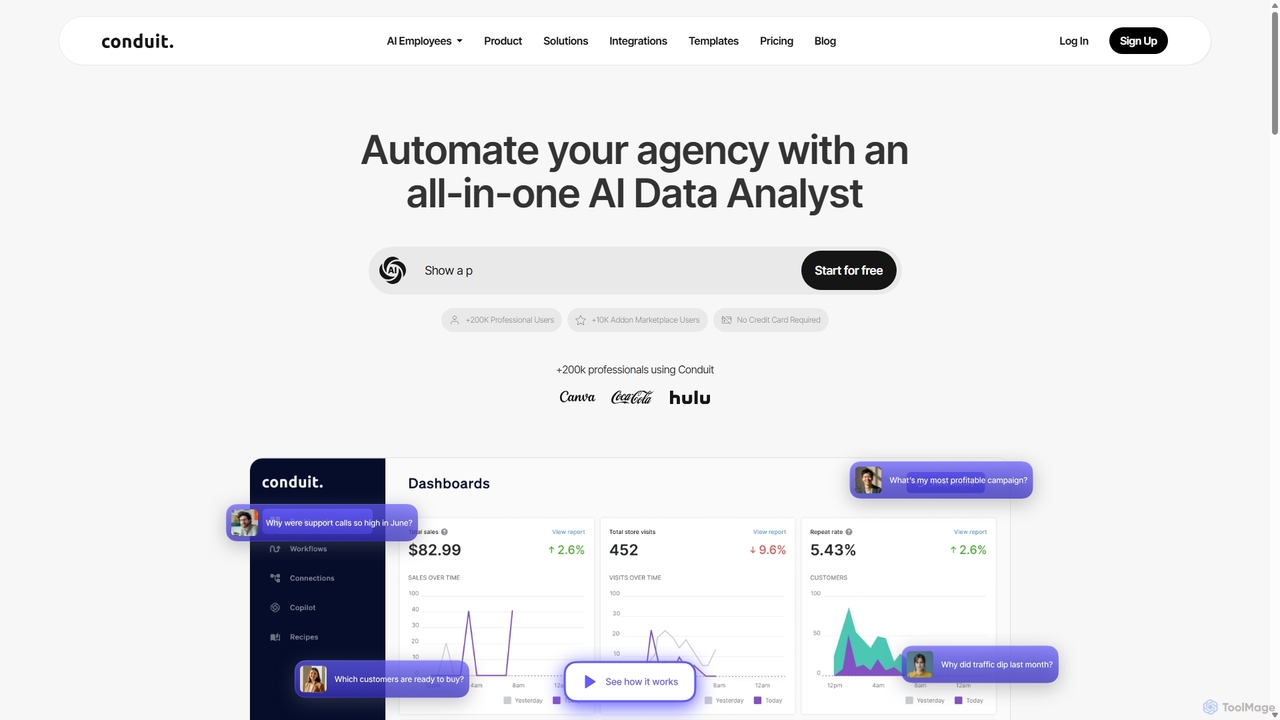
Conduit
Conduit is an all-in-one AI data analyst platform designed to automate agencies and businesses. It centralizes data from hundreds of sources like CRMs, ad platforms, and databases, enabling users to build automated workflows, create interactive dashboards, and query their data using a natural language AI copilot. It's built for marketing teams, data analysts, and developers to save time, improve accuracy, and make faster, data-driven decisions.
Business Intelligence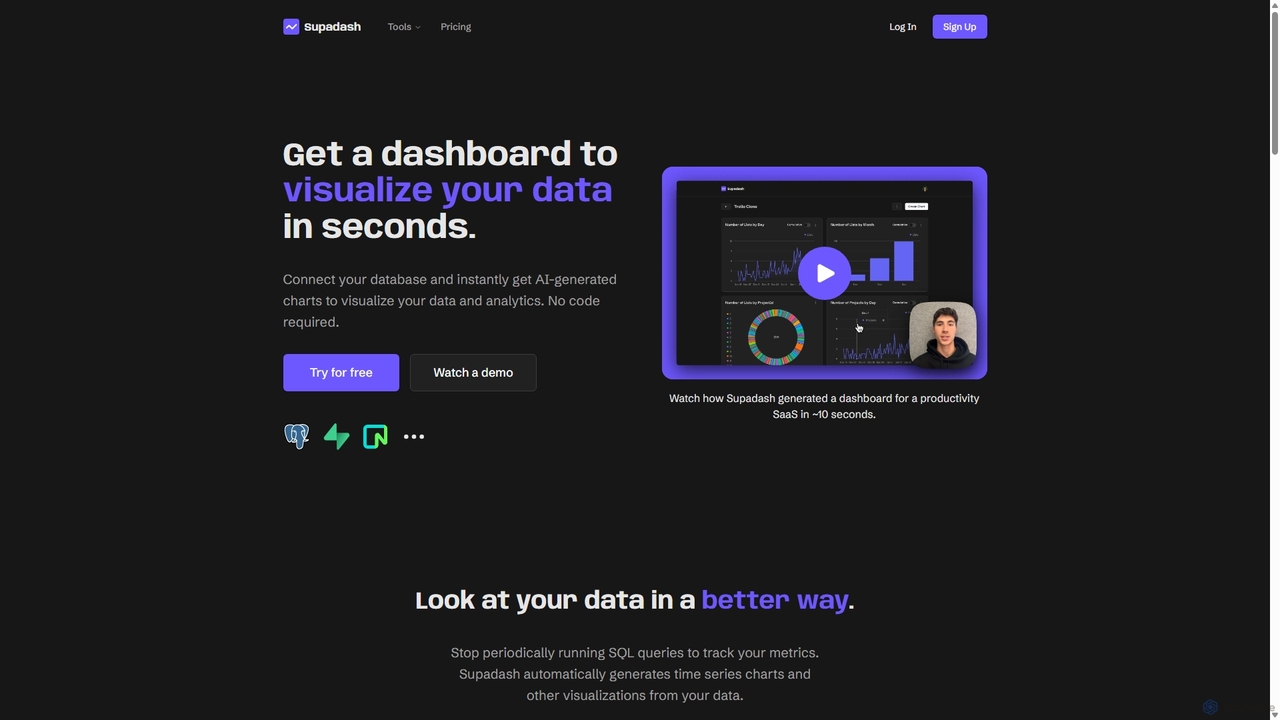
Supadash
Supadash is an AI-powered, no-code platform that instantly generates visual dashboards from your database. Connect your data source, and within seconds, Supadash's AI analyzes your tables and creates insightful charts and analytics. It's designed for developers, startups, and teams who need to track key metrics without writing complex SQL queries, transforming raw data into actionable insights effortlessly.
Business Intelligence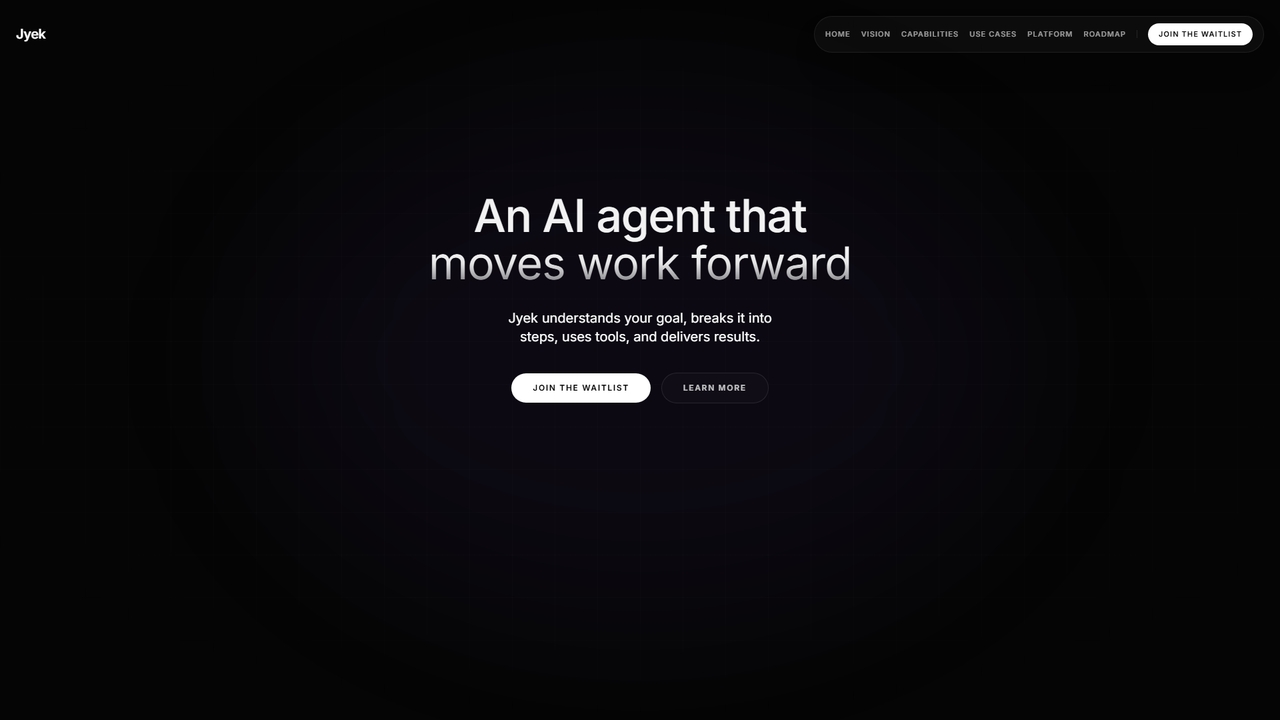
Jyek
Jyek is an AI agent platform that understands objectives, creates execution plans, uses tools, and delivers verifiable results for complex, multi-step tasks.
Automation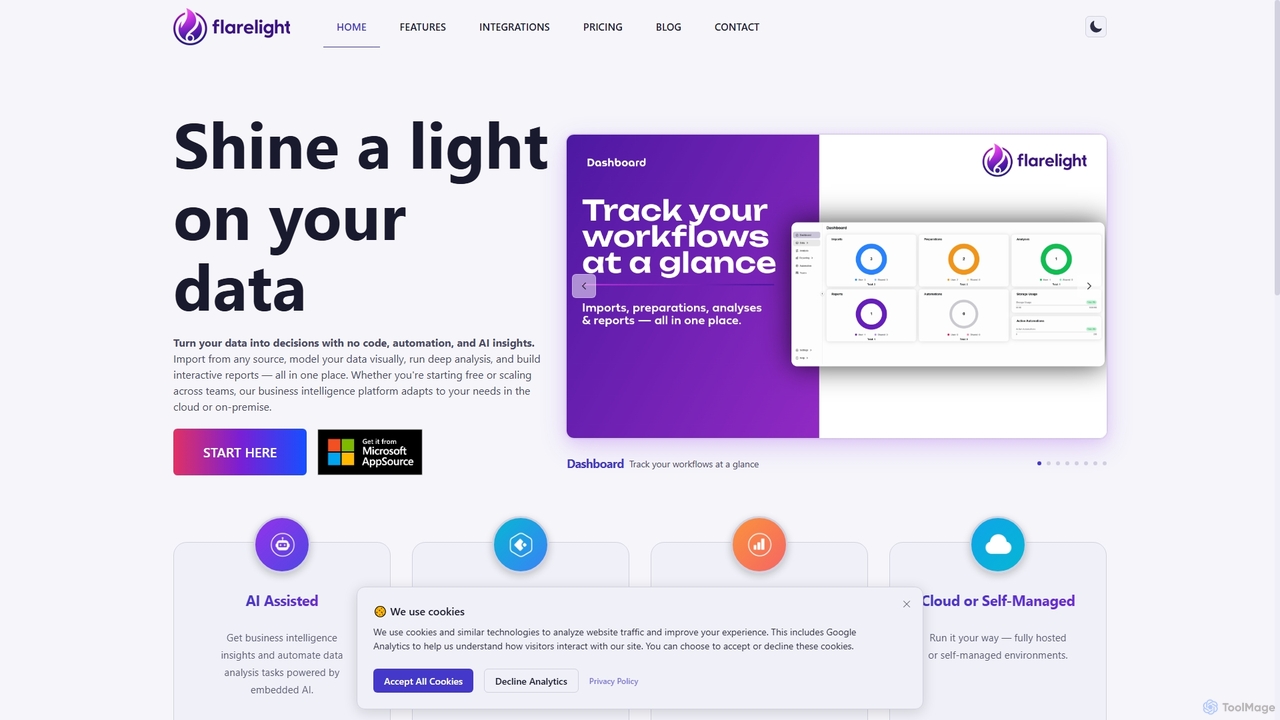
Flarelight
Flarelight is an AI-powered, no-code business intelligence platform for data analysis and visualization. It allows users to import data from any source, prepare it visually, perform deep analysis, and build interactive reports. The all-in-one tool supports both cloud and on-premise deployment, featuring workflow automation and natural language configuration to turn complex data into actionable decisions.
No Code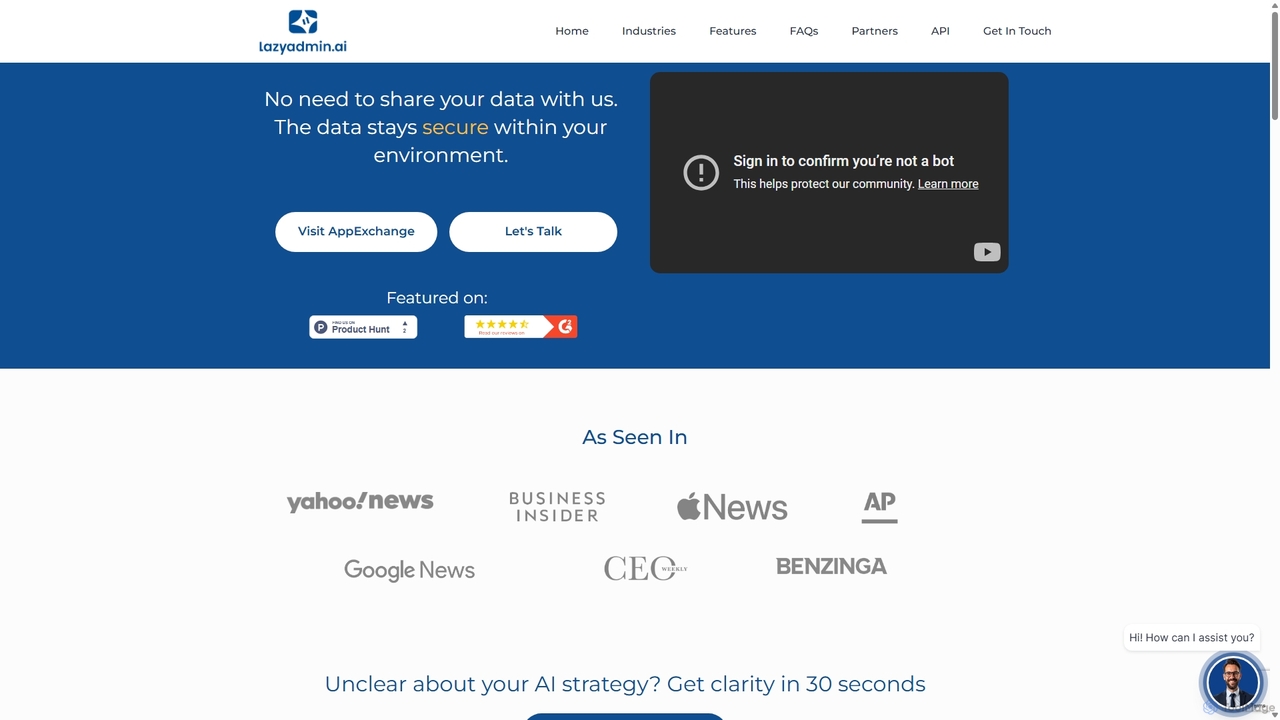
Lazy Admin
Lazy Admin is an AI-powered data analysis and reporting solution designed primarily for Salesforce. It enables users to query data, generate charts, and create dashboards using natural language. The tool emphasizes security by keeping all data within your environment and can be personalized to understand your specific business terminology, making data insights accessible to everyone on your team.
Business IntelligenceLumenore
Lumenore is an AI-powered, no-code business intelligence and data analytics platform designed to transform complex data into actionable insights. It offers a complete analytics workspace with advanced features like Gen AI-powered Natural Language Query (NLQ), automated insights, and data storytelling, enabling businesses to make faster, informed decisions without requiring deep technical expertise.
3D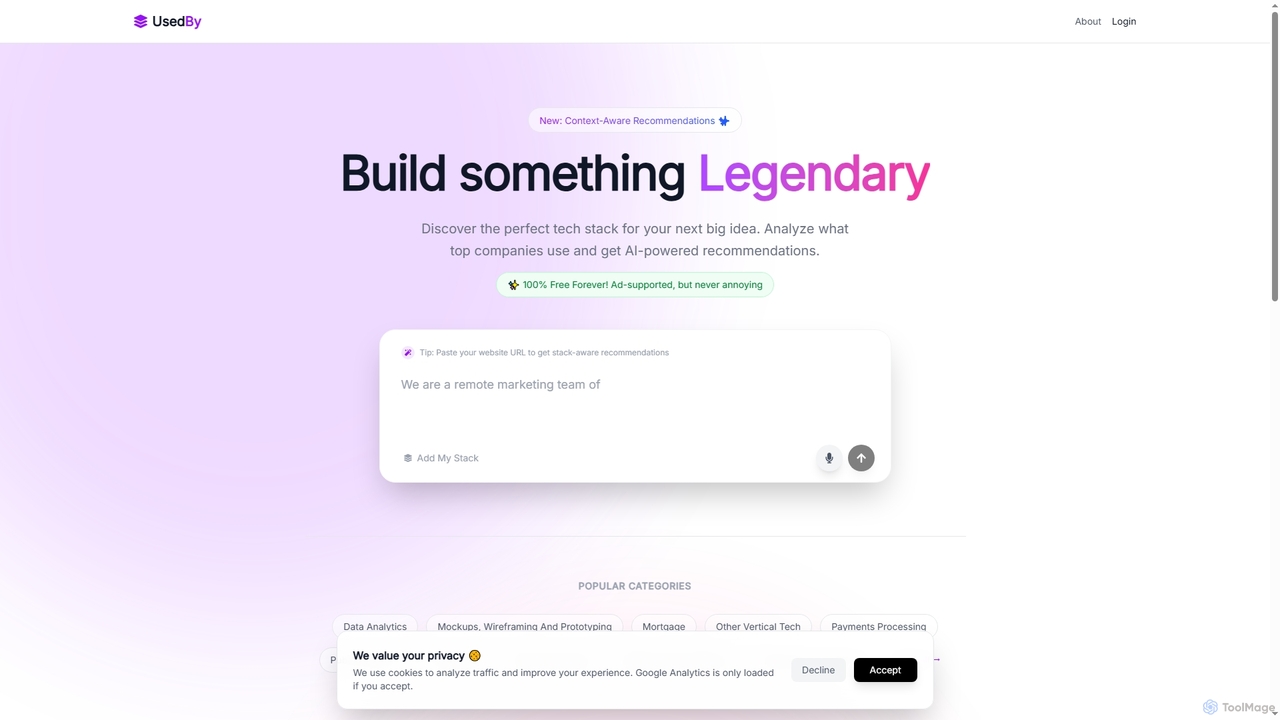
UsedBy
UsedBy is a free, AI-powered platform that helps businesses and startups discover the ideal tech stack by analyzing what top companies use. It provides context-aware recommendations, surfaces hidden gems, and aggregates real-time data from dynamic sources to ensure up-to-date and relevant tool suggestions for any business model or use case.
3D
Databerry Comments (0)
Sign in to comment.
Sign inNo comments yet.