Million
Million is an AI-powered developer tool designed to significantly boost the performance of React websites. It functions as …
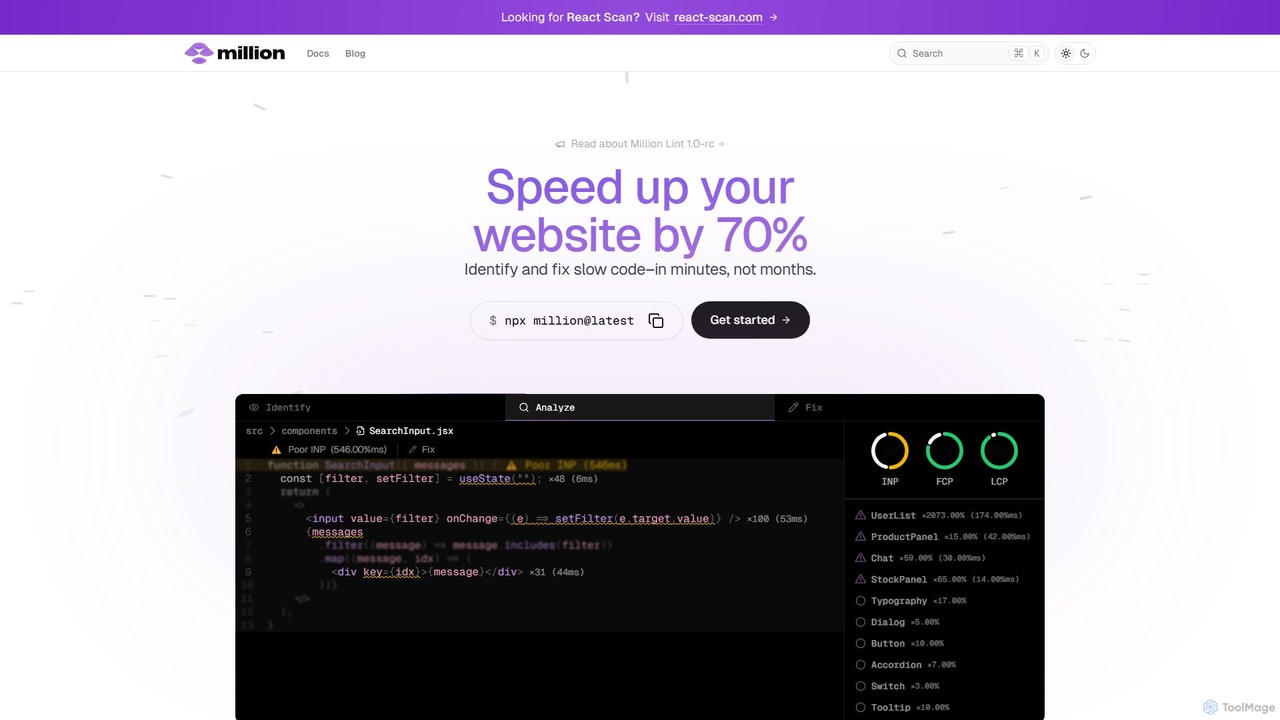
Million is an AI-powered developer tool designed to significantly boost the performance of React websites. It functions as a VSCode extension and compiler, automatically identifying slow code, unnecessary re-renders, and other performance bottlenecks directly within your IDE. Million provides actionable, automated fixes, helping developers optimize their applications by up to 70% in minutes, not months.
Kilo Code
Kilo Code is a powerful, open-source AI coding agent for VS Code. It features a multi-agent system (Orchestrator, …
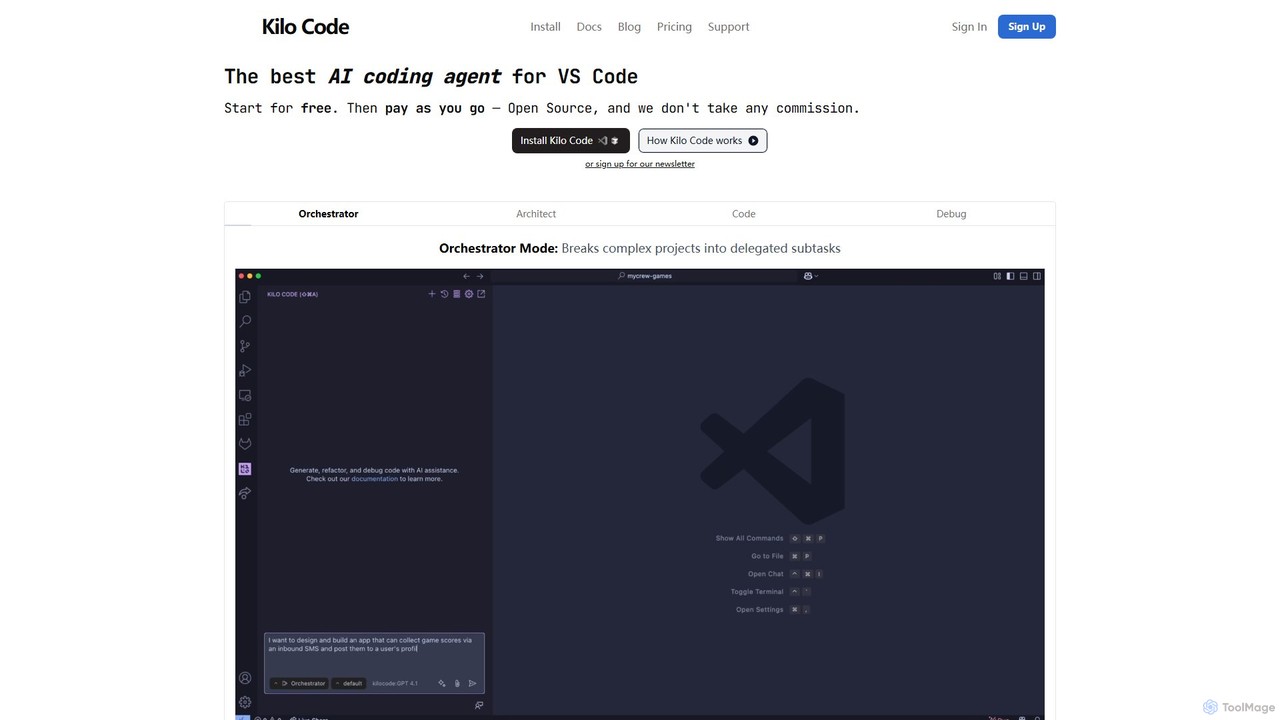
Kilo Code is a powerful, open-source AI coding agent for VS Code. It features a multi-agent system (Orchestrator, Architect, Code, Debug) to automate complex development tasks, from design to debugging. It's highly customizable, context-aware, and prioritizes user privacy with a "bring your own key" model and no data training.
AIDE
AIDE is an AI-powered debugging extension for VS Code that automatically analyzes errors, identifies their root causes, and …
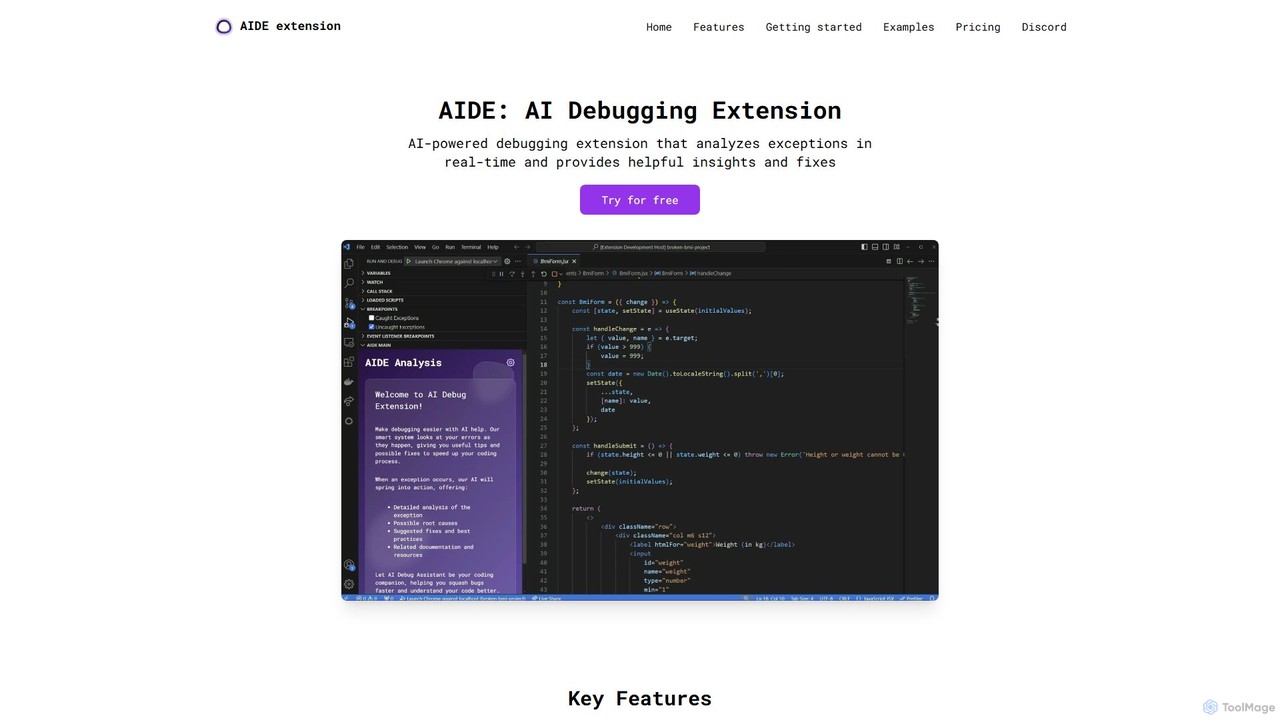
AIDE is an AI-powered debugging extension for VS Code that automatically analyzes errors, identifies their root causes, and suggests concrete code solutions. It streamlines the development workflow by providing instant, context-aware fixes for common issues in JavaScript, React, and more, directly within your editor.
About Debugging
AI Debugging tools are a specialized class of developer tools that use artificial intelligence to automate and enhance the process of finding, analyzing, and fixing errors in code. These tools leverage machine learning models trained on vast codebases to understand error patterns, suggest intelligent fixes, and even predict potential bugs before they occur. Their primary value lies in significantly reducing the time and manual effort required for troubleshooting, allowing developers to resolve complex issues more efficiently than with traditional methods. This approach transforms debugging from a reactive task to a proactive, AI-assisted process.
Core Features
- Intelligent Error Analysis: Automatically interprets stack traces and error messages, providing clear, human-readable explanations of the root cause.
- Automated Code Suggestions: Generates context-aware code snippets to fix identified bugs, which developers can review and apply directly.
- Predictive Bug Detection: Proactively scans code to identify logical flaws, potential race conditions, and performance bottlenecks before runtime.
- Natural Language Querying: Allows developers to ask questions about code behavior or errors in plain English, receiving detailed explanations.
Use Cases
AI Debugging tools are invaluable for software developers, QA engineers, and SREs working on large-scale applications, complex microservices, or legacy systems. They are particularly effective in diagnosing intermittent bugs in production environments and helping new developers quickly understand unfamiliar codebases by explaining logic and data flow.
How to Choose
When selecting an AI Debugging tool, consider its language and framework support to ensure compatibility with your tech stack. Evaluate its integration capabilities with your existing IDE (e.g., VS Code, JetBrains) and CI/CD pipeline. Assess the depth of its analysis—whether it's limited to static analysis or includes runtime insights. Finally, review the tool's data privacy and security policies, especially if it processes proprietary source code.
DebuggingUse Cases
Diagnosing Complex Production Errors
A backend developer is alerted to a critical, intermittent error in a production environment. The error logs are cryptic and difficult to reproduce. Instead of spending hours manually inserting log statements and redeploying, the developer feeds the stack trace into an AI debugging tool. The tool analyzes the error against the codebase, identifies the likely race condition causing the issue, and provides a detailed explanation of the interaction between two microservices. It also suggests a code modification using a proper locking mechanism, reducing diagnostic time from days to minutes.
Accelerating Onboarding with Legacy Code
A junior developer joins a team and is tasked with fixing a bug in a large, poorly documented legacy system. They struggle to understand the complex logic and data flow. Using an AI debugging assistant, they can highlight a function and ask in natural language, 'What is the purpose of this function and what are its side effects?'. The AI provides a concise summary, explains the variable transformations, and visualizes the call stack. This allows the new developer to become productive much faster and reduces the mentoring burden on senior engineers.
Proactive Performance Bottleneck Detection
During a code review process, a developer runs their new feature branch through a predictive AI debugging tool. The tool analyzes the code and flags a section that, while logically correct, contains an inefficient database query within a loop. It predicts that this will cause a significant performance bottleneck under heavy load. The tool also suggests an optimized approach by fetching the data in a single batch query before the loop begins. This proactive identification prevents a performance issue from ever reaching the production environment, saving future remediation costs.
Automated Generation of Bug-Fixing Tests
A QA engineer validates a bug fix submitted by a developer. To ensure the fix is robust and doesn't introduce regressions, they use an AI tool. They provide the tool with the original buggy code and the developer's patched code. The AI analyzes the changes and automatically generates a suite of unit and integration tests specifically designed to verify the fix and cover edge cases related to the change. This automates a crucial part of the quality assurance process, increases test coverage, and builds confidence in the stability of the release.
Refactoring Code for Readability and Maintenance
A senior developer is tasked with improving a critical but convoluted module. Instead of manually refactoring, they use an AI debugging and code analysis tool. The tool scans the module and identifies 'code smells' such as overly long functions, high cyclomatic complexity, and duplicated logic. It then suggests specific refactoring actions, like extracting methods or simplifying conditional statements, and even generates the refactored code for review. This AI-assisted approach ensures consistency, adheres to best practices, and significantly speeds up the process of improving code quality.
Debugging Asynchronous Code Issues
A frontend developer is debugging a race condition in a complex web application that heavily uses asynchronous JavaScript (promises and async/await). Using a traditional debugger is challenging due to the non-linear execution flow. They use an AI debugging tool that can visualize the event loop and the promise chain. The tool clearly illustrates how two separate asynchronous operations are conflicting. It explains the timing issue in simple terms and suggests restructuring the code with `Promise.all` to ensure the operations complete in the correct, predictable order, resolving the bug efficiently.