Million
Million is an AI-powered developer tool designed to significantly boost the performance of React websites. It functions as …
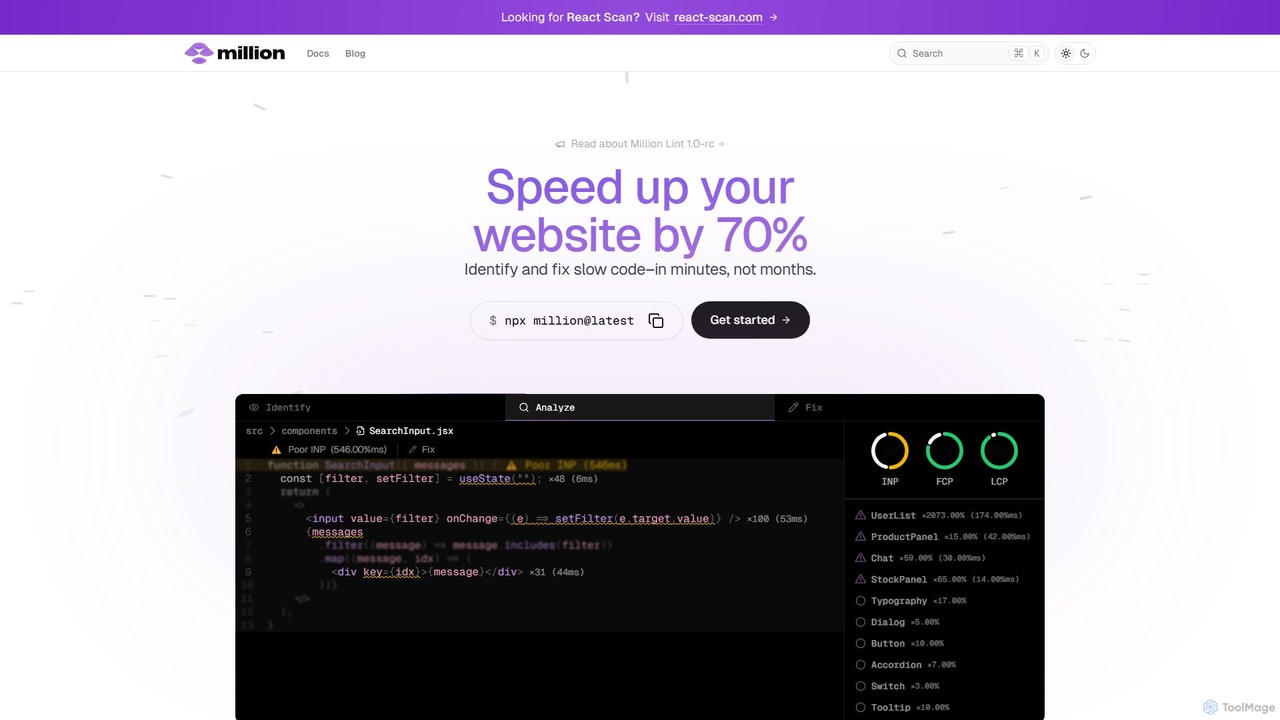
Million is an AI-powered developer tool designed to significantly boost the performance of React websites. It functions as a VSCode extension and compiler, automatically identifying slow code, unnecessary re-renders, and other performance bottlenecks directly within your IDE. Million provides actionable, automated fixes, helping developers optimize their applications by up to 70% in minutes, not months.
About Performance Optimization
Performance Optimization tools are a specialized class of developer utilities designed to analyze, diagnose, and enhance the speed, efficiency, and resource consumption of software applications. They operate by profiling code execution, monitoring memory usage, and identifying computational bottlenecks to provide actionable insights. The primary goal is to improve application responsiveness, reduce infrastructure costs, and ensure stability under heavy loads. Many modern tools leverage AI to predict potential issues and recommend specific code improvements automatically.
Core Features
- Code Profiling: Measures the execution time and frequency of functions to pinpoint slow code segments.
- Memory Leak Detection: Identifies memory that is allocated but never released, preventing application crashes and slowdowns.
- Bottleneck Analysis: Pinpoints specific components—such as database queries, API calls, or algorithms—that limit overall system performance.
- Load Testing & Simulation: Simulates high user traffic to test how an application behaves under stress and identify scalability limits.
- AI-Powered Recommendations: Provides intelligent, context-aware suggestions for refactoring code and optimizing configurations for better performance.
Use Cases
These tools are essential for software developers, DevOps engineers, and Quality Assurance (QA) teams throughout the entire software development lifecycle. They are used for optimizing web page load times, improving mobile app responsiveness, speeding up database queries, and ensuring backend services can handle high traffic volumes efficiently.
How to Choose
When selecting a performance optimization tool, consider its compatibility with your programming languages and frameworks. Evaluate the depth of its analysis capabilities, from high-level dashboards to line-by-line code profiling. Also, assess its integration potential with your existing CI/CD pipeline, IDEs, and monitoring systems, as well as its suitability for your deployment environment (cloud, on-premise, or containers).

Performance OptimizationUse Cases
Optimizing E-commerce Checkout Speed
An e-commerce developer is tasked with reducing cart abandonment rates, which are linked to a slow checkout process. Using a performance optimization tool, they run a code profiler on the payment gateway module. The tool quickly identifies a series of inefficient database queries that are executed for every transaction, causing significant delays. Based on the tool's analysis, the developer refactors the queries and implements caching. As a result, the checkout page load time is reduced by 60%, leading to a measurable increase in completed sales.
Enhancing Mobile App Responsiveness
A mobile app development team receives user feedback about their application becoming sluggish and occasionally crashing after prolonged use. They use a performance optimization tool with memory leak detection capabilities. By running the app in a debug session connected to the tool, they identify several objects that are not being properly deallocated from memory. The tool visualizes the memory allocation graph, allowing the team to trace the leaks back to their source code and fix them, resulting in a more stable and responsive user experience.
Preparing for a High-Traffic Marketing Campaign
A DevOps team needs to ensure their company's web application can handle a massive traffic surge expected from an upcoming marketing campaign. They employ a load testing tool to simulate thousands of concurrent users accessing the site. The tool's dashboard reveals that the API gateway becomes a bottleneck under heavy load. The team uses this data to scale the gateway resources and optimize its configuration ahead of the campaign, successfully preventing a potential outage and ensuring a smooth experience for all users.
Reducing Monthly Cloud Infrastructure Costs
A cloud engineer notices that the company's monthly bill for their SaaS application is steadily increasing. They use a performance optimization tool that integrates with their cloud provider. The tool analyzes resource utilization patterns and identifies several over-provisioned services and inefficient code paths that consume excessive CPU cycles. By following the tool's recommendations to right-size instances and optimize critical functions, the engineer reduces CPU consumption by 30%, leading to significant cost savings without impacting performance.
Automating Performance Checks in CI/CD Pipelines
A Quality Assurance (QA) team wants to prevent performance regressions from being deployed to production. They integrate a static analysis performance tool into their Continuous Integration/Continuous Deployment (CI/CD) pipeline. The tool automatically scans every new code commit for common performance anti-patterns, such as inefficient loops or excessive memory allocations. If a potential issue is detected, the pipeline fails, notifying the developer immediately. This proactive approach helps maintain high performance standards and reduces the need for manual performance testing.
Diagnosing Live Production Performance Issues
A Site Reliability Engineer (SRE) is alerted to a sudden spike in latency for a critical microservice. They use a real-time performance optimization tool that provides distributed tracing. The tool visualizes the entire request flow across multiple services, immediately highlighting that a downstream authentication service is the root cause of the delay. This allows the SRE to bypass the faulty service or focus their troubleshooting efforts in the right place, drastically reducing the Mean Time to Resolution (MTTR) and minimizing user impact.