Agenta
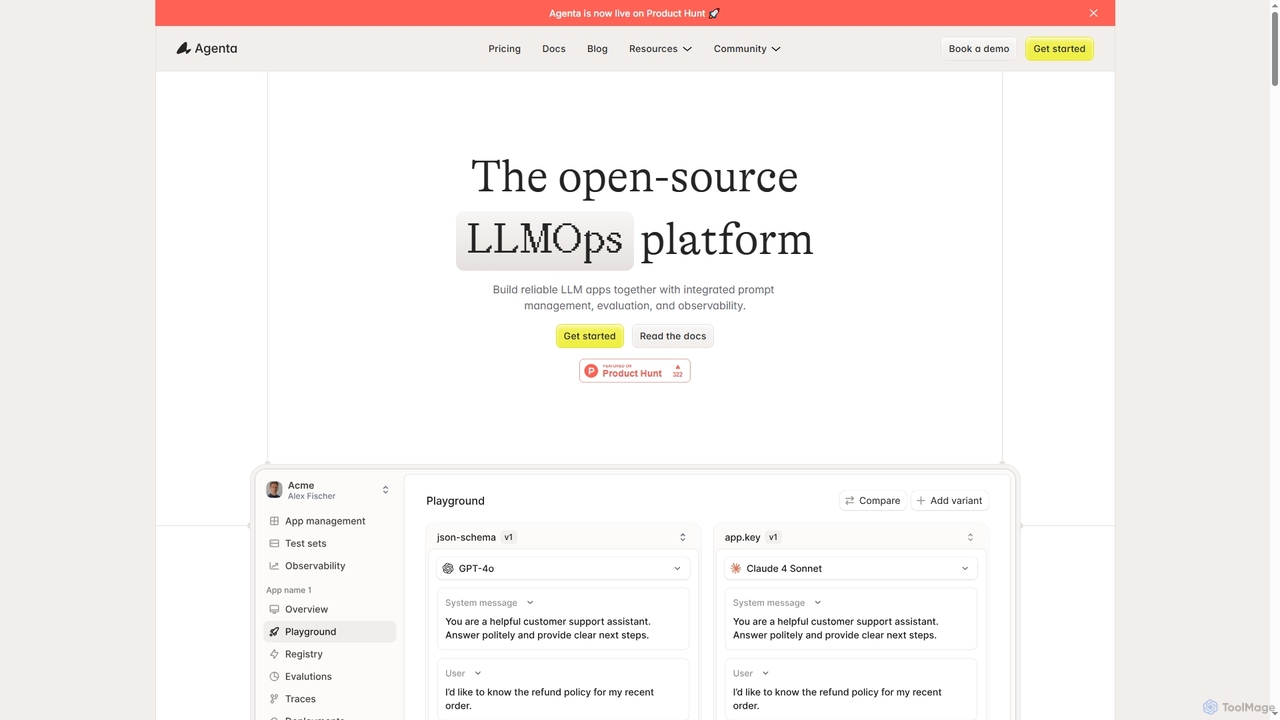
Agenta is an open-source LLMOps platform designed for teams to build reliable LLM applications. It integrates prompt management, …
Agenta is an open-source LLMOps platform designed for teams to build reliable LLM applications. It integrates prompt management, systematic evaluation, and observability into a single, collaborative workflow, helping developers, product managers, and domain experts move from scattered processes to structured development.
Kubiks
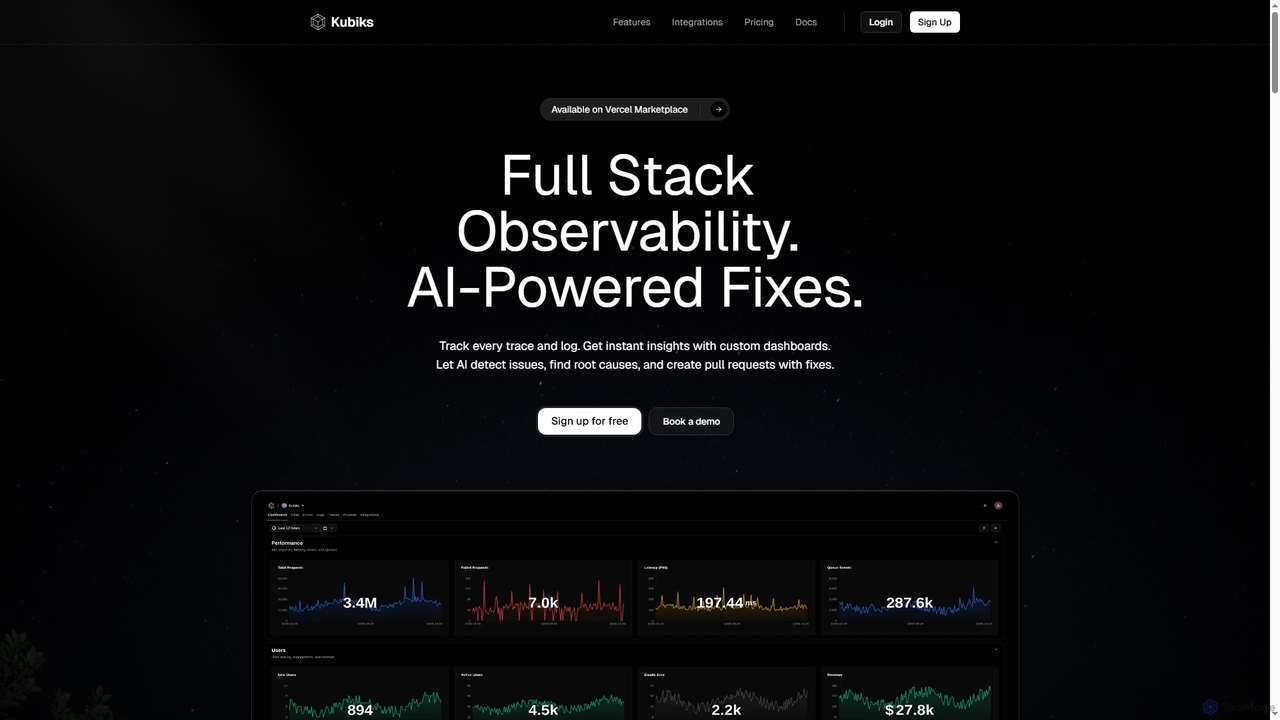
Kubiks is an AI-powered full-stack observability platform providing distributed tracing, logging, and custom dashboards. It automatically detects issues, …
Kubiks is an AI-powered full-stack observability platform providing distributed tracing, logging, and custom dashboards. It automatically detects issues, identifies root causes, and generates pull requests with fixes, helping engineering teams debug faster and proactively resolve problems.
Gammacode
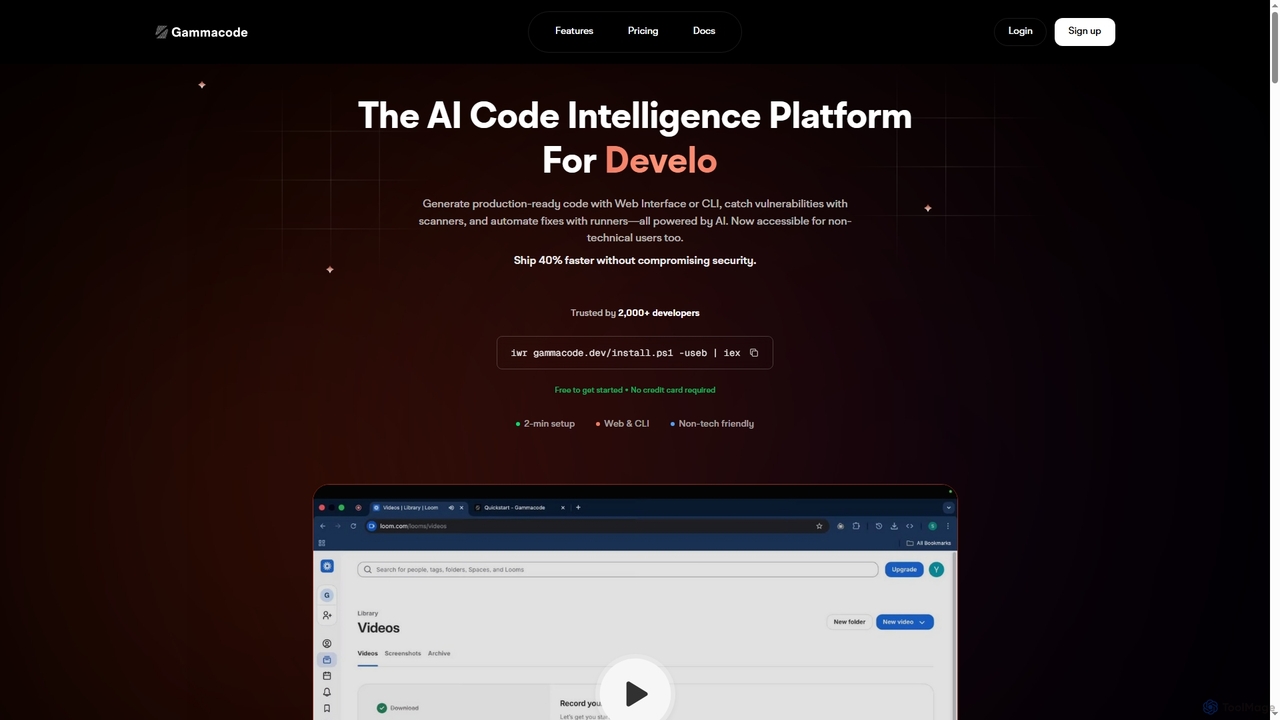
Gammacode is an AI-powered code intelligence platform designed to accelerate software development by generating production-ready code, detecting vulnerabilities, …
Gammacode is an AI-powered code intelligence platform designed to accelerate software development by generating production-ready code, detecting vulnerabilities, and automating fixes. It supports both technical and non-technical users through a web interface and CLI, emphasizing privacy and security.
Digma
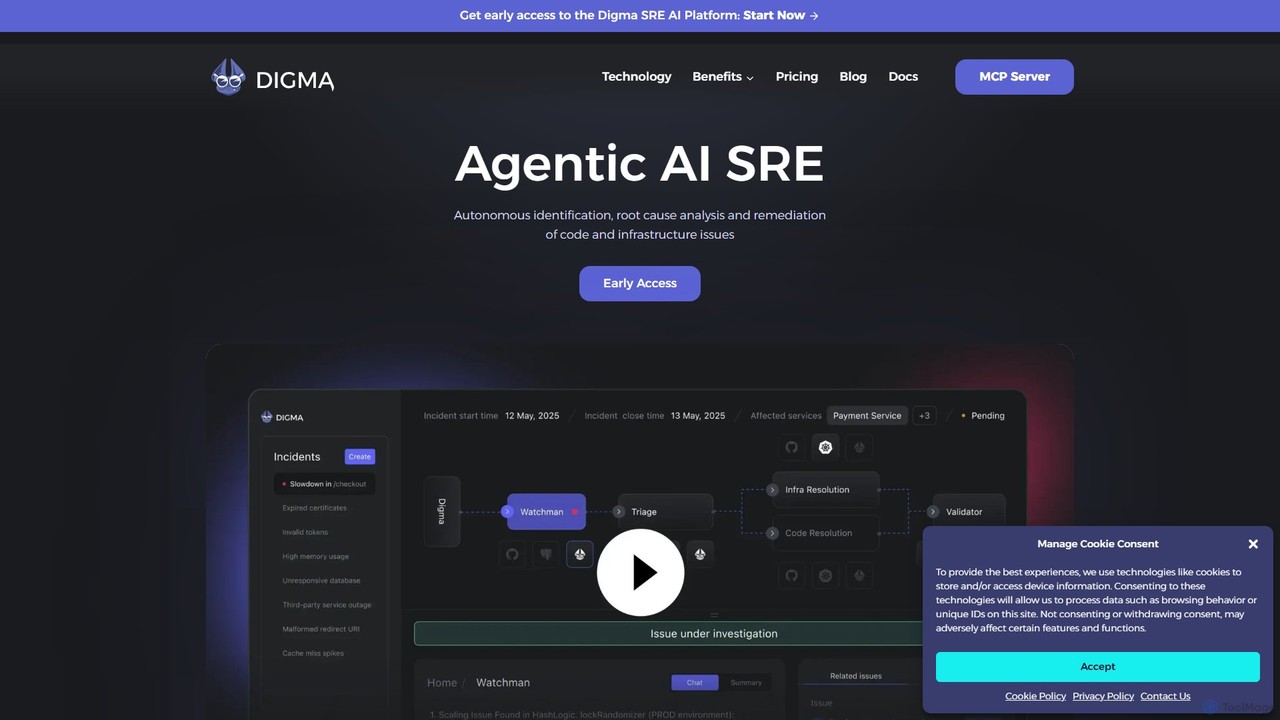
Digma is an agentic AI SRE platform that uses Dynamic Code Analysis (DCA) to autonomously identify, analyze, and …
Digma is an agentic AI SRE platform that uses Dynamic Code Analysis (DCA) to autonomously identify, analyze, and remediate code and infrastructure issues before they reach production. It integrates with your observability stack to provide real-time insights, prevent breaking changes, and optimize application performance, significantly reducing resolution time and engineering effort.
Instabug
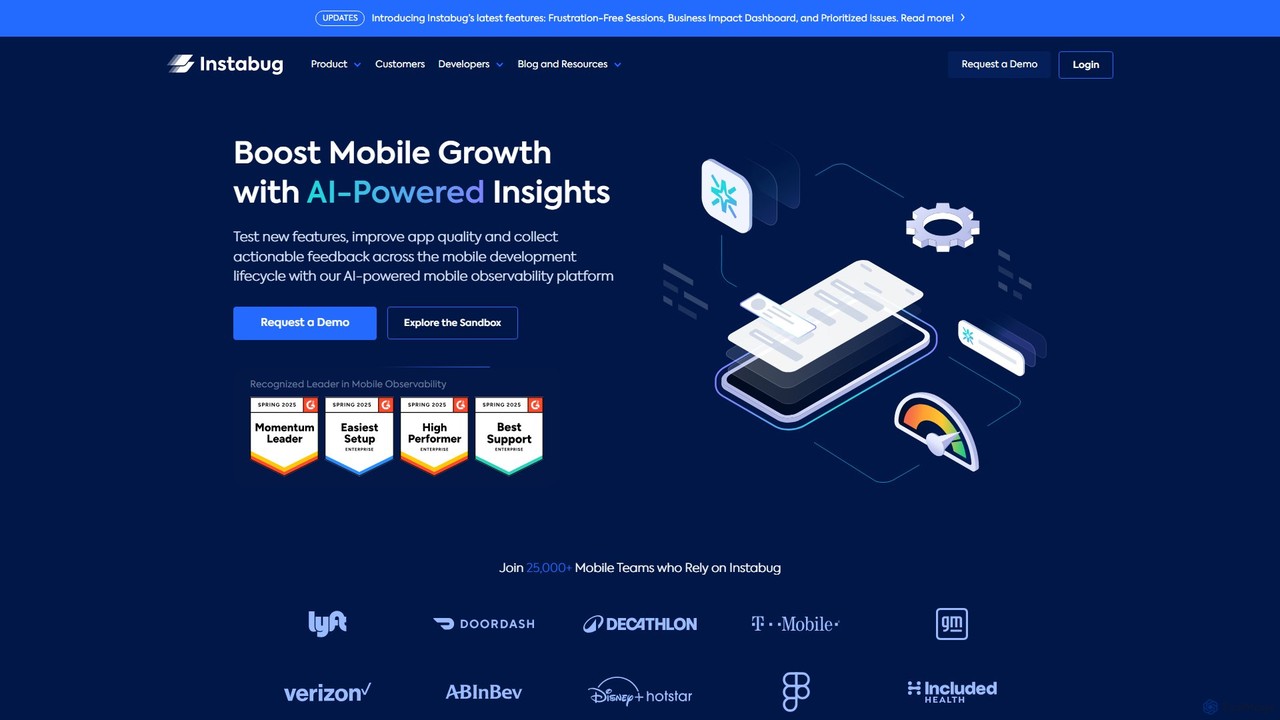
Instabug is an AI-powered mobile observability platform designed for developers and product teams. It provides comprehensive tools for …
Instabug is an AI-powered mobile observability platform designed for developers and product teams. It provides comprehensive tools for bug and crash reporting, app performance monitoring (APM), session replay, and user feedback, helping teams build stable, high-performance mobile applications and resolve issues faster.
Stately
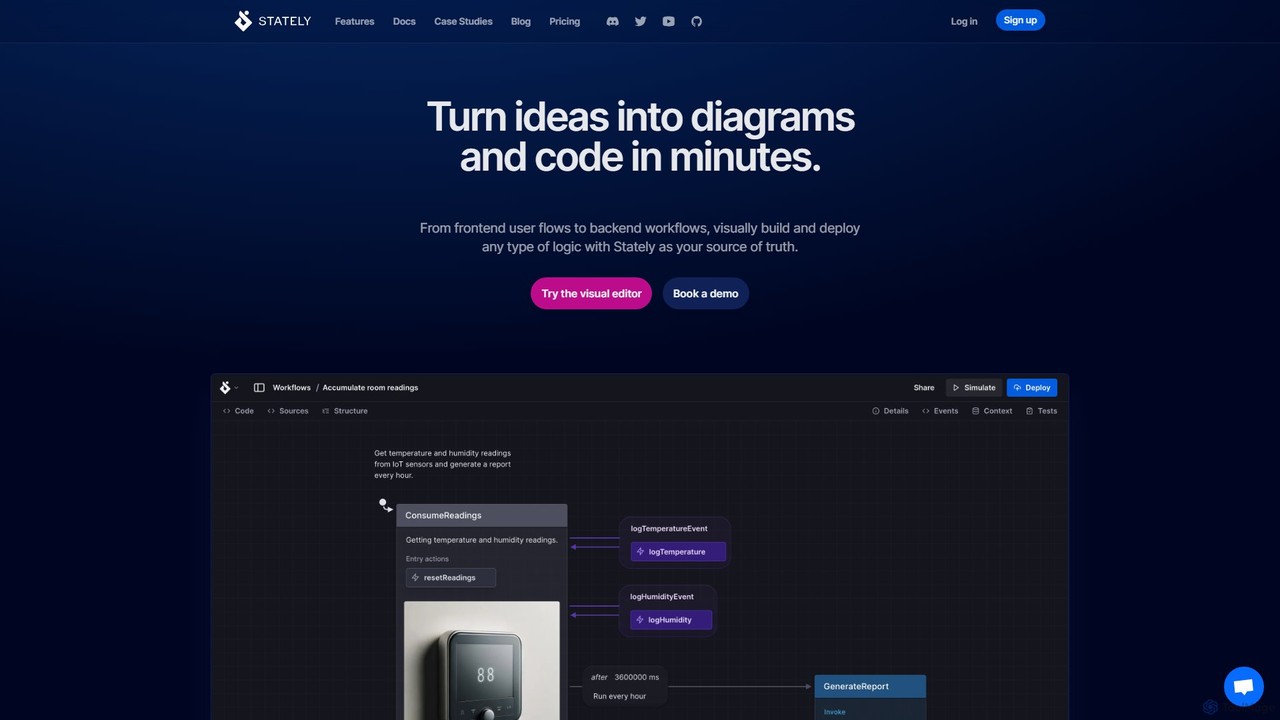
Stately is an intelligent platform for visually building, testing, and deploying complex application logic. Using state machines and …
Stately is an intelligent platform for visually building, testing, and deploying complex application logic. Using state machines and statecharts, it enables teams to turn ideas into executable diagrams and code, with AI assistance for scaffolding, test generation, and more. It bridges the gap between design and development.
About Debugging
Debugging tools are AI-powered solutions designed to identify, diagnose, and resolve errors and performance issues within artificial intelligence models, machine learning pipelines, and related codebases. These advanced tools go beyond traditional software debugging by offering specialized capabilities to inspect data flows, analyze model behaviors, and pinpoint the root causes of AI-specific problems like model drift, bias, or training convergence failures. They are crucial for ensuring the reliability, accuracy, and efficiency of AI systems throughout their development and deployment lifecycle.
Core Features
- Runtime Monitoring: Real-time tracking of model performance, resource utilization, and data transformations during training and inference.
- Data Inspection & Visualization: Tools to visualize input/output data, intermediate activations, and feature distributions to identify anomalies or inconsistencies.
- Error Localization: Advanced algorithms to automatically pinpoint the exact line of code or data point causing an error in complex AI pipelines.
- Model Explainability (XAI): Integration with techniques to interpret model predictions, helping developers understand "why" a model behaves in a certain way.
- Performance Profiling: Detailed analysis of computational bottlenecks and memory usage within AI workloads to optimize efficiency.
Applicable Scenarios
AI debugging tools are indispensable for data scientists, machine learning engineers, and MLOps teams. They are used extensively during model training to diagnose convergence issues, in data preprocessing to identify data quality problems, and in production environments to troubleshoot inference errors or performance degradation. These tools streamline the iterative process of developing robust and reliable AI applications.
How to Choose
When selecting an AI debugging tool, consider its compatibility with your existing ML frameworks (e.g., TensorFlow, PyTorch) and cloud platforms. Evaluate its visualization capabilities for data and model internals, the depth of its error localization features, and its support for real-time monitoring in production. Scalability for large datasets and complex models, along with integration into your CI/CD pipelines, are also critical factors.
DebuggingUse Cases
Diagnosing AI Model Training Failures
Data scientists utilize debugging tools to investigate why a deep learning model is failing to converge, producing NaN values, or exhibiting unexpected loss patterns during training. By monitoring gradients, activations, and data distributions in real-time, they can quickly identify issues like incorrect learning rates, vanishing/exploding gradients, or corrupted input data, accelerating the model development cycle.
Troubleshooting Production AI Inference Issues
MLOps engineers deploy debugging tools to monitor live AI models for performance degradation, high latency, or incorrect predictions. These tools help pinpoint the exact cause, whether it's a data schema mismatch, resource contention, or model drift, enabling rapid resolution and maintaining service reliability for critical applications.
Identifying Data Pipeline Anomalies
Data engineers leverage AI debugging tools to inspect data at various stages of the preprocessing pipeline. They can visualize data distributions, detect outliers, or identify missing values that could negatively impact model performance. This ensures data quality and integrity before it reaches the AI model, preventing "garbage in, garbage out" scenarios.
Optimizing Resource Utilization in ML Workloads
Developers use performance profiling features within debugging tools to analyze GPU/CPU usage, memory consumption, and I/O operations during model training and inference. This allows them to identify bottlenecks, optimize code, and fine-tune hardware configurations, leading to more efficient resource allocation and reduced operational costs for large-scale AI projects.
Explaining Unexpected Model Predictions
AI researchers and domain experts employ integrated explainability features to understand the rationale behind a model's counter-intuitive or biased predictions. By visualizing feature importance or activation maps, they can debug ethical concerns, build trust in AI systems, and refine model logic to align with desired outcomes, particularly in sensitive applications.
Automated Code Quality Checks for ML Projects
Software engineers integrate AI debugging tools into their CI/CD pipelines to perform automated static and dynamic analysis on machine learning codebases. This helps catch potential bugs, security vulnerabilities, and style inconsistencies early in the development process, ensuring higher code quality and reducing the likelihood of runtime errors in production AI systems.