ToolMage
Sign in

Best 2 Analytics AI tools for Sales

Popular Analytics AI tools in Sales include CloudPDF and SilkChart, helping you work more efficiently.

SilkChart
Freemium

SilkChart

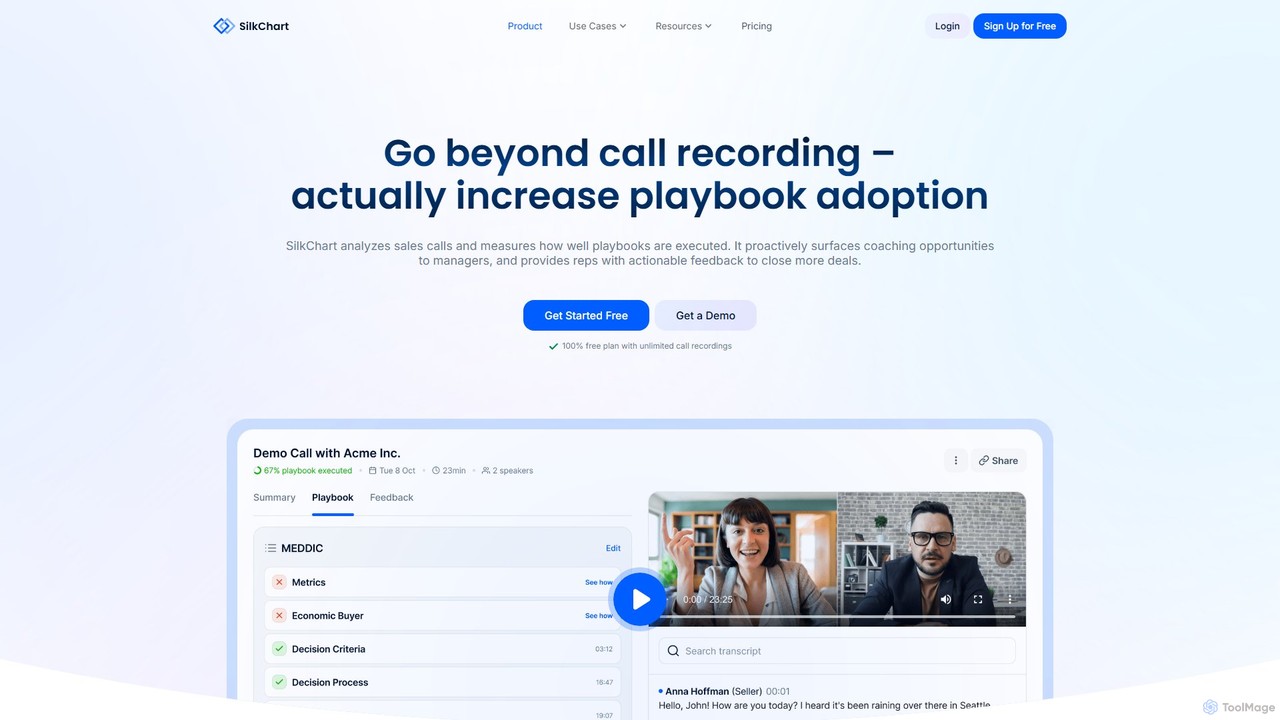
SilkChart is an AI-powered sales coaching and conversation intelligence platform designed for B2B SaaS teams. It analyzes sales calls, measures playbook adoption (like MEDDIC, SPIN), and provides reps with actionable feedback to improve performance and close more deals, all at a fraction of the cost of legacy tools.

Meeting Assistant
Visits 4.8KFavorites 94Likes 102
CloudPDF
Freemium

CloudPDF

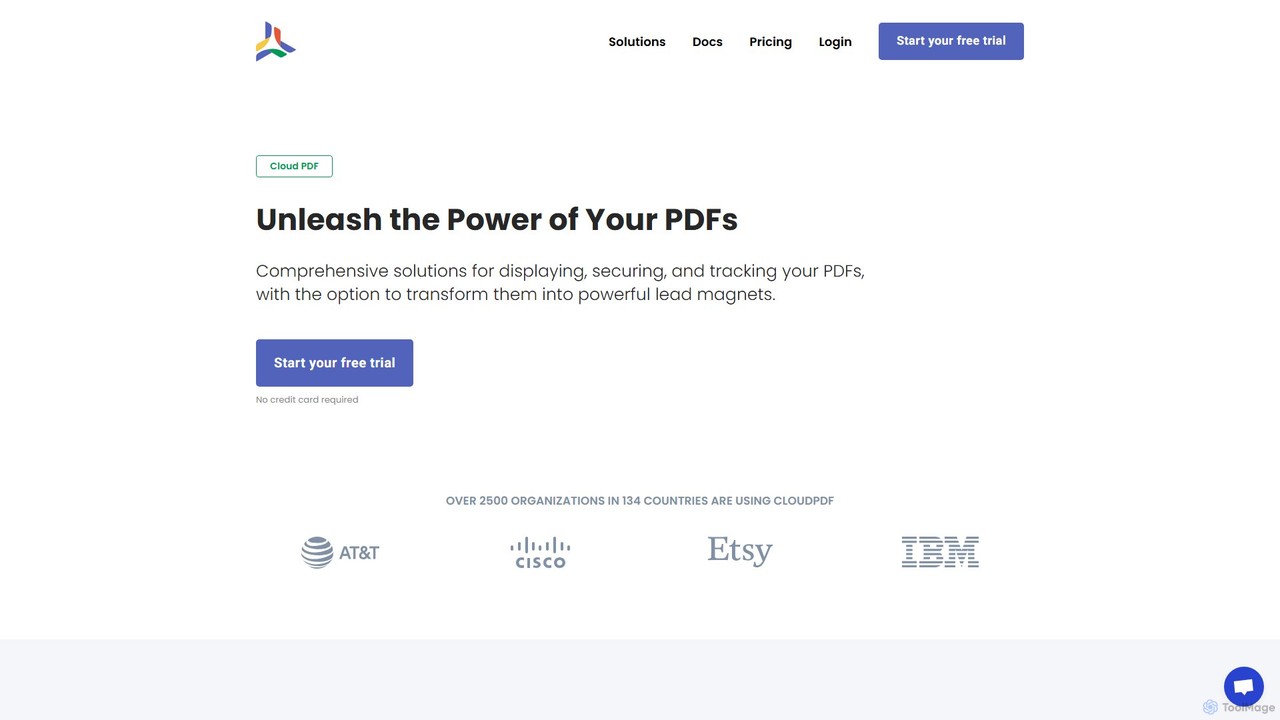
CloudPDF is a cloud-based platform for managing, displaying, securing, and tracking PDFs. It allows users to embed a customizable, fast-loading PDF viewer into websites, prevent unauthorized downloads, and capture leads with forms. A key feature is the AI-powered 'Chat with Your PDF', which transforms static documents into interactive conversational experiences. It's designed for marketers, sales teams, publishers, and developers.

Api & Sdks
Visits 10.7KFavorites 100Likes 108

About Analytics

Sales Analytics tools are a specialized category of software designed to analyze sales data and reveal actionable insights. These tools use AI, statistical models, and data visualization to process information from CRMs and other sales platforms. This enables sales teams to understand performance, forecast revenue accurately, and optimize strategies for better results. They transform raw sales data into a strategic asset for data-driven decision-making within the sales process.

Core Features

  • Sales Performance Dashboards: Visualize key performance indicators (KPIs) like quota attainment, win rates, and sales activity in real-time.
  • Predictive Forecasting: Utilize historical data and AI to generate accurate sales and revenue forecasts.
  • Pipeline Analysis: Identify bottlenecks, track deal velocity, and analyze conversion rates at each stage of the sales funnel.
  • Customer Segmentation: Group customers based on behavior, purchase history, and value to identify upselling opportunities.
  • Win/Loss Analysis: Aggregate and analyze data from closed deals to understand the key factors driving success and failure.

Use Cases

Sales Analytics tools are primarily used by sales managers, sales operations teams, and executive leadership. They are crucial in data-intensive industries like SaaS, finance, and enterprise technology for tracking team performance, optimizing the sales process, and making strategic business decisions based on reliable sales data.

How to Choose

When selecting a Sales Analytics tool, consider its integration capabilities with your existing CRM system. Evaluate the customization options for reports and dashboards to ensure they fit your specific KPIs. Assess the accuracy and methodology of its forecasting models. Finally, consider the user interface's ease of use for non-technical sales team members.

Featured tool rankings

Analytics use cases

1

Forecasting Quarterly Sales Revenue

A VP of Sales needs to provide an accurate revenue forecast to the board for the upcoming quarter. Using a Sales Analytics tool, they aggregate historical sales data, analyze the current pipeline's health, and apply AI-powered models that weigh factors like deal size, stage, and sales rep performance. The tool generates a detailed forecast with best-case, worst-case, and most-likely scenarios, enabling the company to make informed decisions on budgeting, hiring, and resource allocation, increasing forecast accuracy by up to 20%.

2

Identifying Sales Funnel Bottlenecks

A Sales Operations Manager notices a high drop-off rate in the sales pipeline. They use an analytics tool to visualize the entire sales funnel, from lead to close. The tool reveals that 40% of opportunities are lost after the 'Product Demo' stage. By drilling down, they discover that follow-up communication is inconsistent. Armed with this data, they implement a standardized follow-up cadence and provide additional training, resulting in a 15% improvement in conversion rates at that specific stage within a month.

3

Evaluating Sales Rep Performance

A sales manager wants to conduct objective performance reviews for their team. They use a sales analytics dashboard to track individual KPIs such as activities logged, pipeline generated, average deal size, and sales cycle length. The dashboard highlights a rep who has high activity but a low win rate. This insight allows the manager to focus coaching on qualification and closing skills rather than just activity metrics, leading to a more targeted and effective development plan for the employee.

4

Analyzing Customer Segments for Upselling

An Account Manager for a SaaS company wants to identify existing customers with high upsell potential. Using a sales analytics tool, they segment the customer base by product usage, contract value, and support ticket history. The analysis reveals a segment of mid-tier customers who are high-frequency users of a specific feature set. The manager then crafts a targeted campaign to introduce them to a premium plan with advanced capabilities for those features, resulting in a 10% increase in expansion revenue from that segment.

5

Conducting Data-Driven Win/Loss Analysis

A product marketing team wants to understand why they win or lose deals against a key competitor. They use a sales analytics tool to aggregate data from the CRM, including deal size, industry, and sales notes tagged with 'competitor X'. The tool identifies a pattern: they lose most deals in the financial services industry when the competitor offers a specific compliance feature. This data-driven insight allows them to prioritize developing a similar feature, directly addressing a known market gap and improving their competitive win rate.

6

Optimizing Sales Territory Planning

A national sales director is planning territories for the new fiscal year. Instead of relying on geography alone, they use a sales analytics tool to overlay historical sales data, market potential data, and lead distribution onto a map. The analysis reveals that some geographically small territories have a much higher density of high-value prospects. Based on this, the director rebalances the territories not by size, but by potential revenue, ensuring a more equitable distribution of opportunities and setting more realistic quotas for the sales team.

Analytics FAQ

What are Sales Analytics tools?

Sales Analytics tools are specialized software that collect, process, and visualize sales data to uncover actionable insights. They connect to data sources like CRMs to track KPIs, forecast revenue, and analyze sales pipeline health. Unlike a standard CRM which primarily stores data, these tools focus on deep analysis and prediction to help sales teams make data-driven decisions and improve performance.

How to choose the right Sales Analytics tool?

When selecting a Sales Analytics tool, consider these key factors:

  • CRM Integration: Ensure it seamlessly integrates with your existing CRM for accurate data syncing.
  • Customization: Check if you can create custom reports and dashboards tailored to your specific business KPIs.
  • Ease of Use: The tool should be intuitive for sales managers and reps who may not have a technical background.
  • Forecasting Accuracy: Evaluate the sophistication and reliability of its predictive forecasting models.
What's the difference between Sales Analytics and a CRM?

A CRM (Customer Relationship Management) system is primarily a system of record; it stores customer data, interactions, and deal information. A Sales Analytics tool is a system of intelligence; it ingests data from the CRM and other sources to perform deep analysis, identify trends, and generate predictive forecasts. In short, a CRM holds the 'what' (the data), while a Sales Analytics tool explains the 'why' and predicts the 'what's next'.

What key metrics can Sales Analytics tools track?

Sales Analytics tools can track a wide range of metrics. Some of the most common and valuable ones include:

  • Quota Attainment: The percentage of the sales team that is achieving their sales goals.
  • Sales Velocity: How quickly deals are moving through your pipeline from lead to close.
  • Win Rate: The percentage of sales opportunities that are successfully closed.
  • Average Deal Size: The average revenue generated from each closed-won deal.
  • Sales Cycle Length: The average time it takes for a sales rep to close a deal.
Who benefits most from Sales Analytics tools?

While the entire organization can benefit, the primary users are within the sales department. Sales Leaders (VPs, Directors) use them for strategic planning, forecasting, and overall performance monitoring. Sales Managers use them to coach their teams, track individual performance, and manage their pipeline. Sales Operations professionals use them to optimize processes, analyze funnel efficiency, and ensure data hygiene. Individual Sales Reps can also use them to monitor their own progress against goals and identify opportunities within their accounts.