ToolMage
Sign in
Gastrograph
Market Research · 1M monthly visits

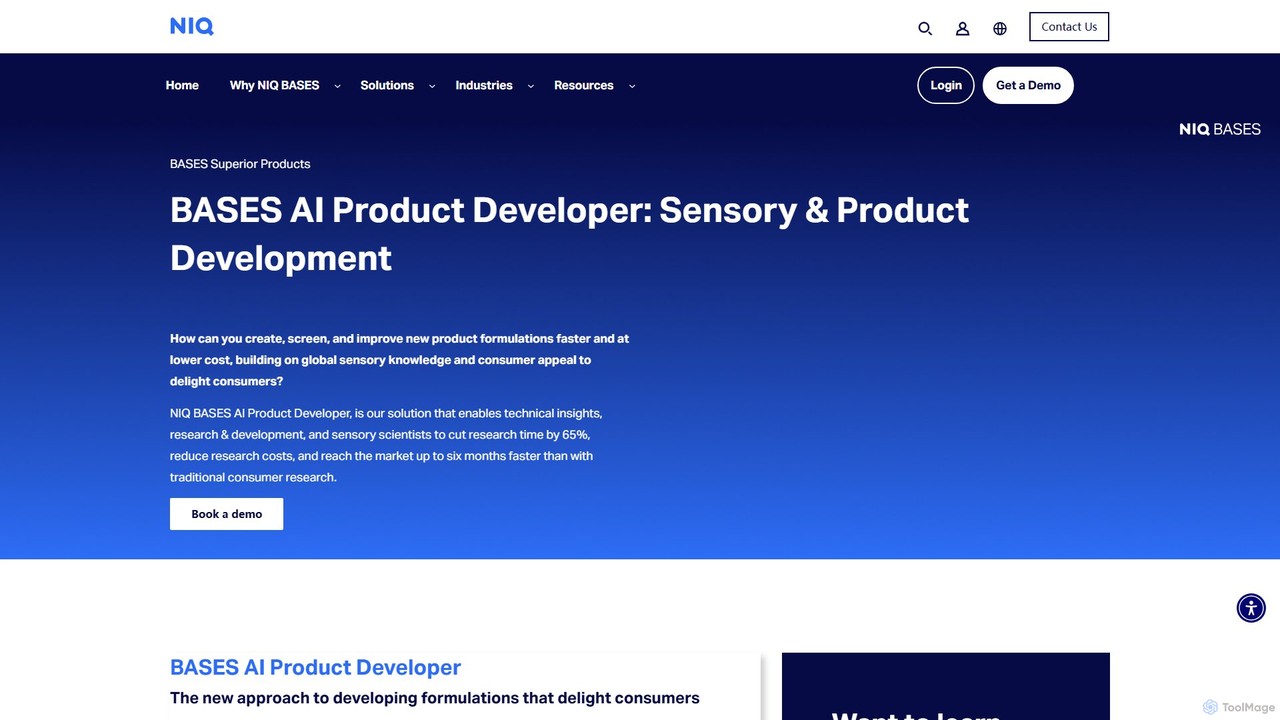
Gastrograph is an AI-powered platform, now part of NIQ's BASES suite, designed for the food and beverage industry. It models human sensory perception of flavor, aroma, and texture to predict consumer preferences. By analyzing vast datasets, the platform helps CPG companies optimize product formulations, reduce development time, and launch products that resonate with target demographics, ensuring market success.
VS
mapzot
Predictive Analytics · 5.7K monthly visits

MapZot.AI is an advanced AI-powered platform for retail site selection and market analysis. It provides businesses with deep location intelligence, including foot traffic insights, competitor analysis, and revenue forecasting. By leveraging real-time data and predictive analytics, MapZot helps industries like retail, real estate, and healthcare identify high-potential locations, optimize expansion strategies, and maximize ROI. The platform offers a comprehensive suite of tools for strategic growth and informed decision-making.

Gastrograph vs mapzot: pricing, features, traffic, and use cases

Compare Gastrograph and mapzot across positioning, pricing, traffic, and user feedback using structured factual data.

Updated Aug 18, 2026

Product overview

Gastrograph Product overview

Gastrograph is an AI-powered platform, now part of NIQ's BASES suite, designed for the food and beverage industry. It models human sensory perception of flavor, aroma, and texture to predict consumer preferences. By analyzing vast datasets, the platform helps CPG companies optimize product formulations, reduce development time, and launch products that resonate with target demographics, ensuring market success.

Preview

mapzot Product overview

MapZot.AI is an advanced AI-powered platform for retail site selection and market analysis. It provides businesses with deep location intelligence, including foot traffic insights, competitor analysis, and revenue forecasting. By leveraging real-time data and predictive analytics, MapZot helps industries like retail, real estate, and healthcare identify high-potential locations, optimize expansion strategies, and maximize ROI. The platform offers a comprehensive suite of tools for strategic growth and informed decision-making.

Preview

Detailed feature comparison

FeatureGastrographmapzot
Primary categoryMarket ResearchPredictive Analytics
Added2025-08-112025-08-09
PricingPaidPaid
Official websitenielseniq.comwww.mapzot.ai
Product typeWebsiteWebsite
Performance data
User ratingNot verifiedNot verified
Comments00
Monthly visits1M5.7K
Monthly growth-22.6%-12.8%
Favorites111139
DetailsView detailsView details

Gastrograph vs mapzot monthly traffic

Compare Gastrograph and mapzot by monthly reach, traffic trend, visit depth, top regions, and acquisition sources.

How to interpret the traffic data

In the Gastrograph vs mapzot monthly traffic comparison, Gastrograph currently shows 1M visits and mapzot shows 5.7K; Gastrograph has about 182.1 times the visible traffic of mapzot, an absolute difference of about 1M visits. This reflects visible reach, not feature quality or paid users.

Both tools provide verified traffic details, so monthly trends, visit depth, regions, and acquisition sources can be compared on the same basis.

Gastrograph is registered at the nielseniq.com/global/en/solutions/bases-ai-product-developer subpage. Because the current data does not state whether other host pages are excluded, treat this as domain-level context rather than independent traffic for one product or project.

Gastrograph monthly traffic:

Latest traffic

Monthly visits
1M
Avg. visit duration
2:59
Pages per visit
8.99
Bounce rate
31.92%
Data updated 2026-06-15

Monthly traffic trend

  • 2026/1: 1.3M Monthly visits
  • 2026/2: 1.2M Monthly visits
  • 2026/3: 1.4M Monthly visits
  • 2026/4: 1.3M Monthly visits
  • 2026/5: 1M Monthly visits

Top regions

Top 5 countries/regions
Country/regionPercentageTraffic
🇺🇸United States49.48%510K
🇬🇧United Kingdom15.24%157.1K
🇩🇪Germany15.05%155.1K
🇮🇳India12.88%132.8K
🇨🇴Colombia7.35%75.8K

Traffic sources

Source typePercentageTraffic
Direct63.72%656.8K
Referral32.19%331.8K
Email4.09%42.2K

Search keywords

nielsennielsen iqnielseniqnielseniq careersniq

mapzot monthly traffic:

Latest traffic

Monthly visits
5.7K
Avg. visit duration
0:16
Pages per visit
1.48
Bounce rate
55.49%
Data updated 2026-06-15

Monthly traffic trend

  • 2025/9: 4K Monthly visits
  • 2026/1: 4.7K Monthly visits
  • 2026/2: 6K Monthly visits
  • 2026/3: 8.5K Monthly visits
  • 2026/4: 6.5K Monthly visits
  • 2026/5: 5.7K Monthly visits

Top regions

Top 5 countries/regions
Country/regionPercentageTraffic
🇮🇳India48.05%2.7K
🇺🇸United States43.84%2.5K
🇩🇪Germany8.11%459

Search keywords

chick fil a transactions per daymapzotmapzot.aimapzot.ai vs placer.aiwhat percent of disney guests are african american?
Traffic-based selection guidance: Gastrograph is registered under a nielseniq.com subpath, so its large visible total may include the host platform. The current data does not justify choosing Gastrograph for traffic alone; shortlist by unique taxonomy and use case, then validate with the same tasks.

Usage comparison

Compare the core capabilities of Gastrograph and mapzot

Gastrograph Core features

Market Research
Product Development

mapzot Core features

Market Research
Predictive Analytics
Location Based
Site Selection

Use cases

Gastrograph Use cases

CPG
predictive analytics
consumer insights
flavor profiling
food and beverage
market research
NIQ
product development
sensory analysis

mapzot Use cases

CPG
predictive analytics
business expansion
competitor analysis
CRE
foot traffic
location intelligence
market analysis
real estate
retail analytics
revenue forecasting
site selection

Gastrograph vs mapzot:In-depth comparison and selection guidance

First decide whether the products solve the same kind of need

This in-depth Gastrograph vs mapzot comparison uses only the product records, taxonomy, audience, traffic, and community signals available on this page. Gastrograph is primarily listed under “Market Research”, while mapzot is primarily listed under “Predictive Analytics”, so the first decision is whether your actual task matches their recorded scope.

The structured fields currently show these decision-relevant differences: Primary category (Gastrograph: Market Research; mapzot: Predictive Analytics); Monthly visits (Gastrograph: 1M; mapzot: 5.7K); Monthly growth (Gastrograph: -22.6%; mapzot: -12.8%); Favorites (Gastrograph: 111; mapzot: 139); Website (Gastrograph: nielseniq.com; mapzot: www.mapzot.ai). These facts are more useful for selection than brand visibility alone.

What market visibility and monthly traffic mean

In the Gastrograph vs mapzot monthly traffic comparison, Gastrograph currently shows 1M visits and mapzot shows 5.7K; Gastrograph has about 182.1 times the visible traffic of mapzot, an absolute difference of about 1M visits. This reflects visible reach, not feature quality or paid users.

Both tools provide verified traffic details, so monthly trends, visit depth, regions, and acquisition sources can be compared on the same basis.

Gastrograph is registered at the nielseniq.com/global/en/solutions/bases-ai-product-developer subpage. Because the current data does not state whether other host pages are excluded, treat this as domain-level context rather than independent traffic for one product or project.

Gastrograph is registered under a nielseniq.com subpath, so its large visible total may include the host platform. The current data does not justify choosing Gastrograph for traffic alone; shortlist by unique taxonomy and use case, then validate with the same tasks.

Product positioning, use cases, and roles

Gastrograph and mapzot currently overlap in shared categories: Market Research; shared tags: CPG and predictive analytics. This can place both on the same shortlist, but it does not prove equal implementation, depth, or cost.

Gastrograph's unique categories/tags are Product Development, consumer insights, flavor profiling, food and beverage, market research, NIQ, product development, and sensory analysis; mapzot's are Predictive Analytics, Location Based, Site Selection, business expansion, competitor analysis, CRE, foot traffic, and location intelligence. These unique fields are the strongest differentiators: validate the product whose recorded scope matches the task instead of following traffic alone.

What ratings, comments, and favorites can tell you

Gastrograph has no verified rating, 0 comments, 111 favorites, and 108 likes;mapzot has no verified rating, 0 comments, 139 favorites, and 123 likes。

Neither product has enough rating or comment samples for a credible reputation ranking.

Selection guidance by actual need

When to evaluate Gastrograph first

Put Gastrograph on the priority trial list when the task aligns with “Market Research” and especially Product Development, consumer insights, flavor profiling, food and beverage, market research, and NIQ. This follows recorded positioning and does not imply unlisted capabilities are absent.

Gastrograph also currently records: pricing is paid, product type is website, 1M monthly visits shown for the registered host (subpage scope unknown), no verified user rating. Verify any hard requirement around price, platform, or reach before trial, and do not let sparse review data substitute for testing.

When to evaluate mapzot first

Put mapzot on the priority trial list when the task aligns with “Predictive Analytics” and especially Predictive Analytics, Location Based, Site Selection, business expansion, competitor analysis, and CRE. This follows recorded positioning and does not imply unlisted capabilities are absent.

mapzot also currently records: pricing is paid, product type is website, 5.7K verified monthly visits, no verified user rating. Verify any hard requirement around price, platform, or reach before trial, and do not let sparse review data substitute for testing.

How to validate the recommendation before deciding

The available data describes positioning, public visibility, and community signals, but it cannot prove output quality, speed, integration effort, privacy, or long-term cost in your workflow. Before deciding, run the same representative tasks in Gastrograph and mapzot, then record completion time, accuracy, manual corrections, and the real paid threshold. A like-for-like trial turns this comparison into a defensible adoption decision.

Comparison FAQ

How should I choose between Gastrograph and mapzot?
Compare positioning, pricing, taxonomy, and traffic maturity, then verify the latest details on each official website.
Where does this comparison data come from?
The factual baseline is derived from product, taxonomy, traffic, and community data. Reviewed editorial conclusions show their source and verification date.
What do unknown fields mean?
Unknown means there is not enough reliable evidence; the page does not fill gaps with assumptions.

Related AI tools

infiniteanalytics
Paid

infiniteanalytics

Infinite Analytics offers Sherlock AI, an enterprise-grade platform that provides deep consumer insights, marketing intelligence, and location analytics. By analyzing data from over 350 million consumers, it helps businesses understand their audience, optimize marketing campaigns across channels like Meta and Google, and make strategic decisions for site selection and retail strategy. It's designed for data-driven growth and enhanced profitability.

Location Intelligence
Visits 6.1KFavorites 136Likes 132
antuit.ai
Paid

antuit.ai

Antuit.ai, a Zebra Technologies company, is an AI-powered SaaS platform for the retail and CPG industries. It delivers highly accurate demand forecasting, inventory optimization, and pricing solutions. By leveraging advanced analytics and machine learning, Antuit.ai helps businesses improve forecast accuracy, optimize supply chains, and increase profitability through data-driven decisions.

Retail Analytics
Visits 53.1KFavorites 84Likes 81
Spate
Paid

Spate

Spate is an AI-driven market research and consumer trend forecasting platform. It analyzes billions of data points from search and social media to identify the next big consumer trends, helping brands make data-driven decisions for product development, marketing, and innovation.

Trend Analysis
Visits 22.8KFavorites 100Likes 111
Placer.ai
Freemium

Placer.ai

Placer.ai is a leading location intelligence and foot traffic analytics platform. It provides businesses with actionable insights into any physical location, helping them understand consumer behavior, analyze market trends, and make data-driven decisions for growth and competitive advantage.

Market Research
Visits 158.4KFavorites 107Likes 116
Nextatlas
Paid

Nextatlas

Nextatlas is an AI-powered trend forecasting and consumer insights platform. It analyzes billions of data points from social media innovators and early adopters to identify emerging trends before they become mainstream, providing businesses with predictive analytics for strategic planning, marketing, and innovation.

Market Research
Visits 7.7KFavorites 153Likes 159
Openhouse.ai
Paid

Openhouse.ai

Openhouse.ai is an AI-powered software platform designed for home builders to enhance profitability through data-driven decisions. It offers a suite of tools for predictive sales forecasting, personalized buyer engagement, and streamlined operations. By leveraging AI, Openhouse.ai helps builders accurately predict market demand, shorten sales cycles, and optimize cash flow, transforming raw data into actionable insights for a competitive edge in the real-estate market.

Sales Forecasting
Visits 9.7KFavorites 108Likes 117
Calton Datx

Calton Datx

Calton Datx is an AI-powered audience measurement and analytics platform that provides real-time insights into people and vehicle movements for Out-of-Home (OOH) advertising and retail environments. It leverages advanced computer vision and machine learning to transform complex data into actionable strategies, optimizing campaign performance and ROI.

Out Of Home Advertising
Visits 5.6KFavorites 119Likes 118
Glimpse
Freemium

Glimpse

Glimpse is a trend intelligence platform that analyzes billions of consumer signals from across the web to help you discover trends before they become mainstream. It provides absolute search volume, growth metrics, and predictive forecasting, making it a powerful alternative to Google Trends for marketers, researchers, and investors.

Market Research
Visits 217.7KFavorites 116Likes 127
Product Lab AI
Freemium

Product Lab AI

Product Lab AI is an all-in-one AI-powered platform designed for product managers, entrepreneurs, and teams. It streamlines the entire product lifecycle, from ideation and market research to writing specifications, creating roadmaps, and analyzing user feedback. Transform your product development process with data-driven insights and automated workflows.

Market Research
Visits 4.9KFavorites 135Likes 135
Zipsmart
Freemium

Zipsmart

An AI-powered real estate analytics platform providing predictive market forecasts, data-driven insights, and actionable buy/sell signals for the US housing market. It helps investors, agents, and homebuyers make smarter decisions by analyzing key metrics like price trends, inventory, and economic factors.

Predictive Modeling
Visits 4.7KFavorites 127Likes 130
Bytient
Paid

Bytient

Bytient is an AI-powered B2B data intelligence platform that leverages forensic intelligence and predictive analytics. It provides deep, real-time data on organizations, including potential buyers, competitors, and partners, complete with direct executive contact information and access to extensive investor and real estate databases.

Market Research
Visits 4.6KFavorites 107Likes 115
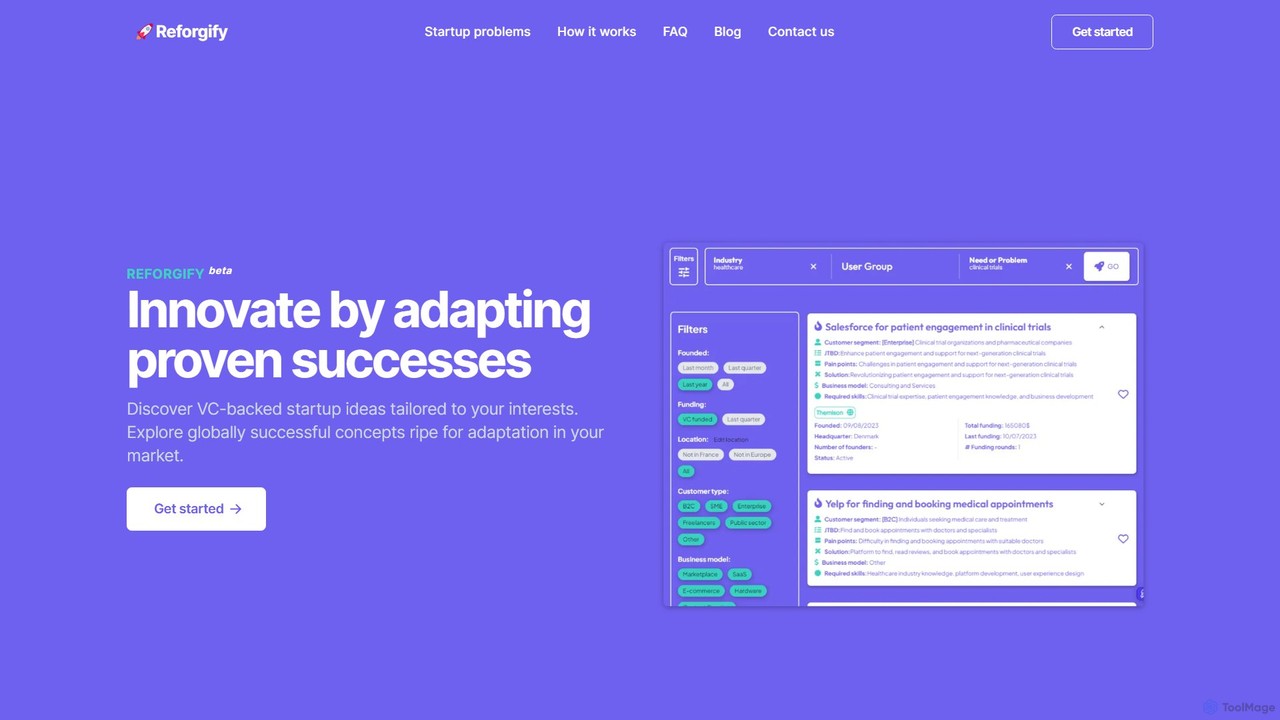
Reforgify
Freemium

Reforgify

Reforgify is an AI-driven innovation platform for entrepreneurs to discover, analyze, and adapt successful, VC-backed startup ideas from around the globe. It provides a curated database of business concepts, problems, and market trends to de-risk the ideation process and inspire local market innovation.

Market Research
Visits 4KFavorites 127Likes 129
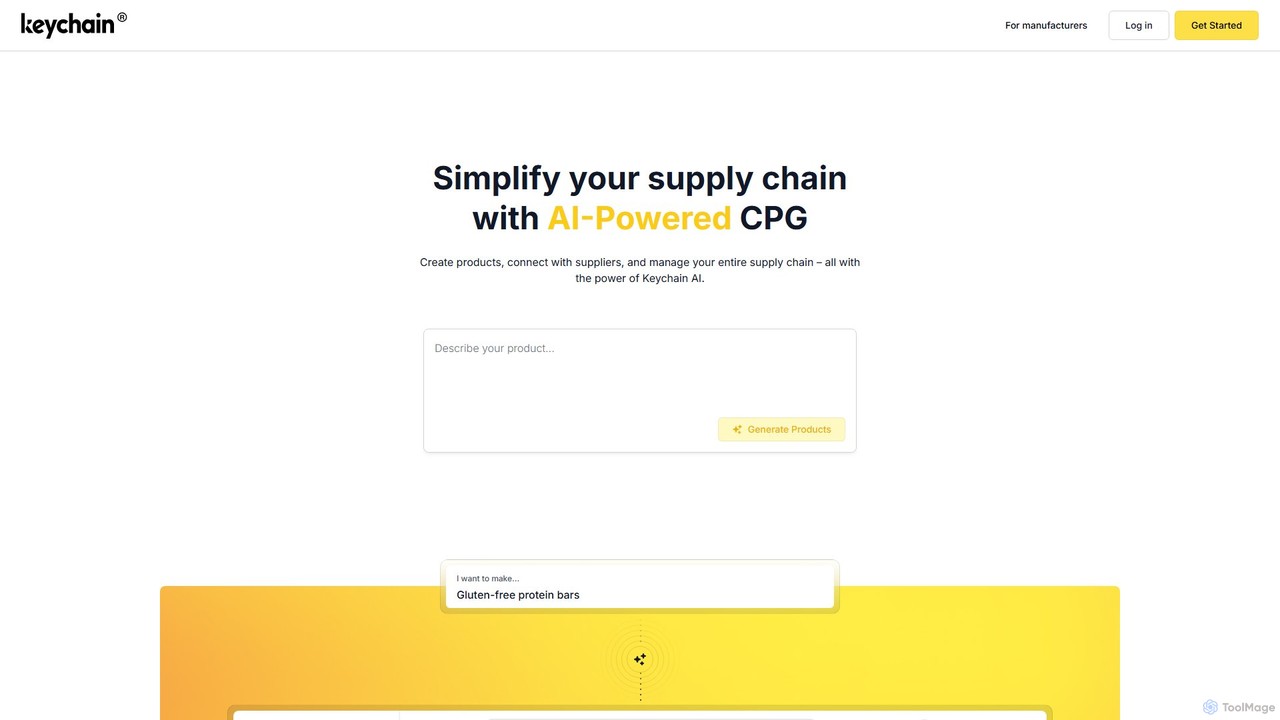
Keychain
Freemium

Keychain

Keychain is an AI-powered platform for the Consumer Packaged Goods (CPG) industry. It simplifies the supply chain by connecting brands and retailers with a vast network of over 30,000 vetted manufacturers, packagers, and ingredient suppliers. Using AI, brands can instantly generate product specifications and find perfect partners, streamlining the entire process from discovery to production. It's a comprehensive B2B marketplace designed to foster innovation and growth.

B2B
Visits 128.6KFavorites 91Likes 112
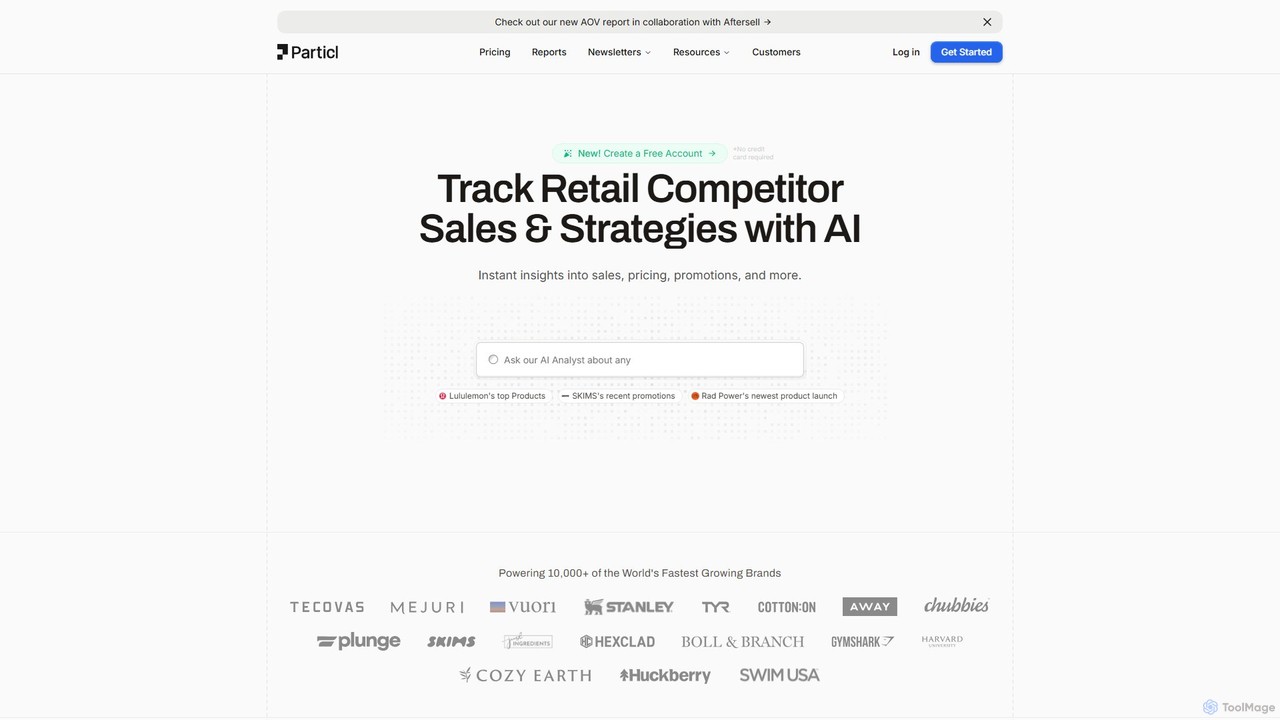
Particl
Freemium

Particl

Particl is an AI-powered competitor tracking platform for e-commerce and retail brands. It delivers real-time insights into competitor sales, pricing, promotions, product assortments, and market trends, enabling businesses to make data-driven decisions and gain a competitive edge.

Business Intelligence
Visits 99.5KFavorites 97Likes 123
Odeko

Odeko

Odeko is an AI-powered, all-in-one operations platform for cafes and coffee shops. It simplifies supply chain management by consolidating orders, providing next-day overnight delivery, and offering smart inventory insights. Using predictive analytics, Odeko helps businesses optimize stock levels, reduce waste, and increase profitability, allowing owners to focus on their customers and growth.

Inventory Management
Visits 63KFavorites 134Likes 142