


Hiddenq Overview
HiddenQ serves as an AI Business Performance Cockpit, specifically engineered for executives, business owners, and teams in small to mid-sized businesses. It addresses the common challenge of data being scattered across various tools like accounting software, CRMs, and operational files. By connecting these disparate sources, HiddenQ automatically restructures messy data into clean, understandable metrics. This enables users to track key performance indicators (KPIs) such as revenue, cash flow, and sales pipelines in a single, unified view. The platform's core innovation lies in its conversational AI, which allows users to ask questions in plain language and receive charts and answers in seconds, effectively acting as an on-demand data analyst.
How to use Hiddenq
To leverage HiddenQ, users start by connecting their data sources, which can include tools like CRMs and accounting software, or by uploading files such as Excel and CSVs. The platform's AI then ingests and cleans this data, mapping different formats to core business metrics. Once connected, HiddenQ automatically generates relevant dashboards. Users can then interact with their data by typing questions in natural language to gain immediate insights, track changes, and receive AI-generated summaries. These dashboards and insights can be shared with team members to foster collaboration during meetings and reviews.
Core Features of Hiddenq
- Data Unification: Connects to various tools and ingests files (Excel, CSV) to create a single, AI-ready performance view.
- Automated Reporting: Automatically builds dashboards and restructures messy data into clean metrics, reducing report preparation time.
- Conversational AI Analytics: Ask questions in plain language to chat with your data and receive charts and answers instantly.
- Real-Time Insights: Monitors the latest data to surface significant changes, anomalies, and important trends.
- AI Summaries: Provides concise summaries that explain key business changes over the last week or month.
- Collaborative Dashboards: Share live dashboards with team members, founders, and investors to ensure everyone is aligned.
- API Integration: Allows for data updates through API calls for more dynamic and automated data ingestion.
Use Cases for Hiddenq
HiddenQ is ideal for business leaders who need a clear, up-to-date picture of their company's performance without technical complexity. It's particularly useful for weekly check-ins, board reviews, and investor updates, providing a consistent and reliable data source. Finance and operations teams can use it to automate the consolidation of reports from various sources, track profitability, and monitor cash flow. Founders and CEOs can use the conversational AI to quickly validate hypotheses and make data-driven decisions on the fly.
Advantages of Hiddenq
The primary advantage of HiddenQ is its ability to democratize data analysis for SMBs, eliminating the need for a dedicated data team or a complex BI stack. It significantly reduces the manual effort involved in data preparation, with an average 30% reduction in time spent on reports. The platform's conversational interface makes sophisticated data queries accessible to non-technical users. Furthermore, it grows with a company, allowing businesses to start with a few key metrics and add more data sources as their operations expand, ensuring a scalable and long-term solution.
Hiddenq Frequently Asked Questions
Hiddenq Comments (0)
Log in to post comments
Log in nowHiddenq Alternatives
View All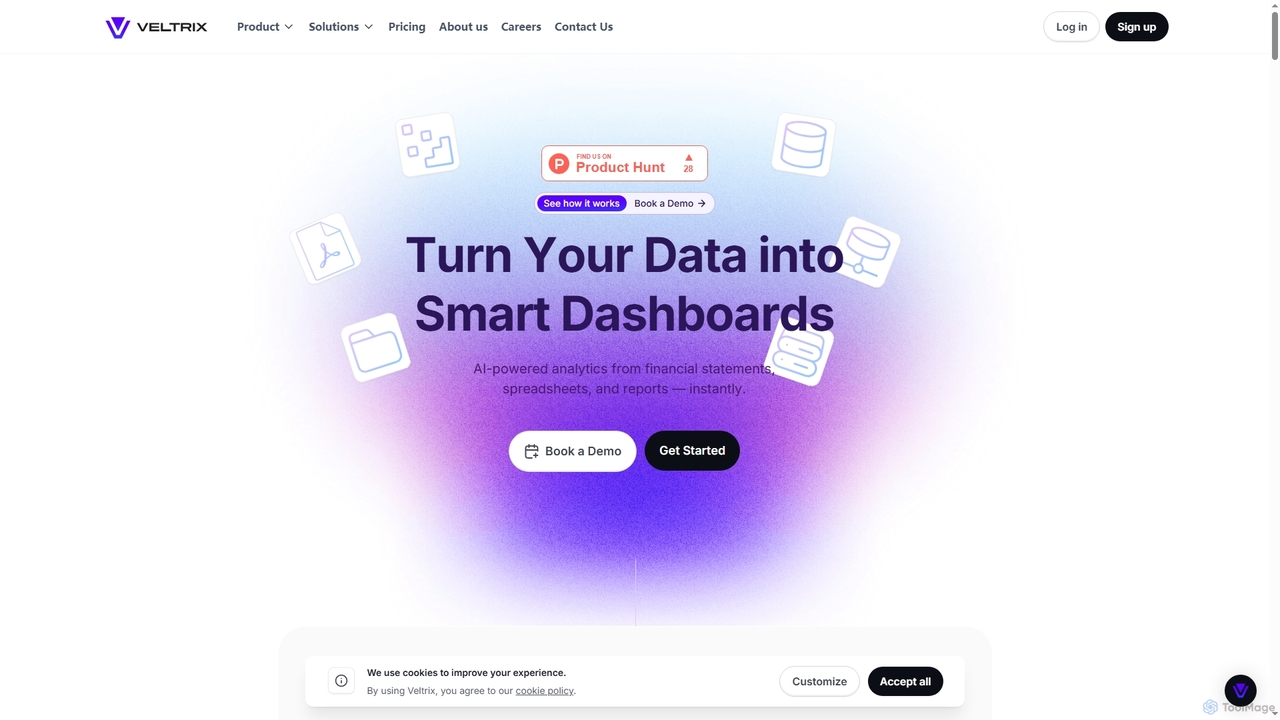
Veltrix
Veltrix is an AI-powered, no-code platform that transforms raw data from files and connected sources into interactive dashboards. …
Veltrix is an AI-powered, no-code platform that transforms raw data from files and connected sources into interactive dashboards. Users can ask questions in plain language to get instant, visualized answers for business intelligence and financial analysis.
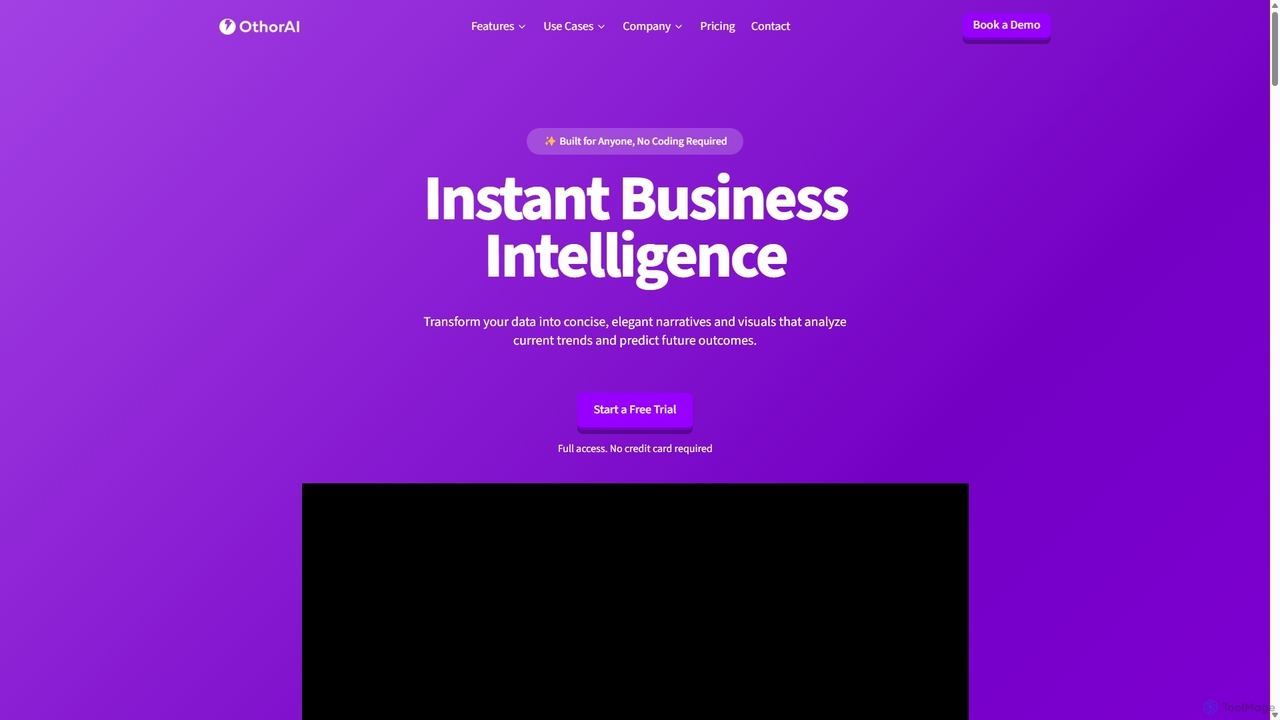
Othor AI
Othor AI is a no-code business intelligence platform that transforms your data into actionable insights in seconds. It …
Othor AI is a no-code business intelligence platform that transforms your data into actionable insights in seconds. It automatically generates narrative-driven reports, smart charts, and predictive analytics, enabling anyone in your organization to make faster, data-driven decisions without technical expertise. Connect your data sources and get instant dashboards and executive summaries.
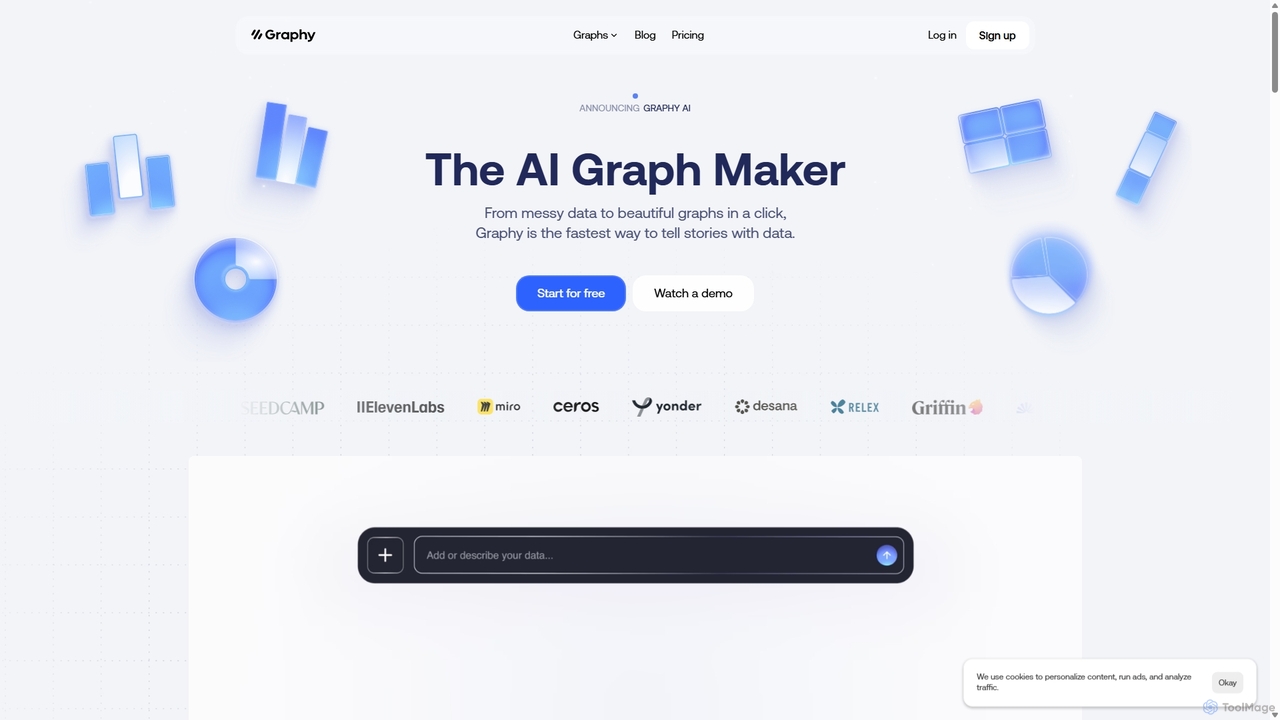
Graphy
Graphy is an AI-powered data visualization tool that transforms raw data into beautiful, interactive charts and graphs in …
Graphy is an AI-powered data visualization tool that transforms raw data into beautiful, interactive charts and graphs in seconds. It simplifies data storytelling by automatically identifying key insights, allowing users to chat with their data, and offering extensive customization. Ideal for marketers, analysts, and teams who need to create compelling visual reports and presentations without complex software.

Sisense
Sisense is an AI-powered embedded analytics platform that enables businesses to infuse analytics into their products, applications, and …
Sisense is an AI-powered embedded analytics platform that enables businesses to infuse analytics into their products, applications, and workflows. It provides a comprehensive suite of tools for data integration, visualization, and delivering actionable insights to both internal users and customers.

Microsoft Power BI
Microsoft Power BI is a leading business analytics and data visualization platform that empowers users to connect to, …
Microsoft Power BI is a leading business analytics and data visualization platform that empowers users to connect to, model, and visualize their data. It leverages AI-powered features like natural language Q&A and automated insights to uncover hidden patterns, create interactive reports and dashboards, and facilitate data-driven decision-making across an organization.
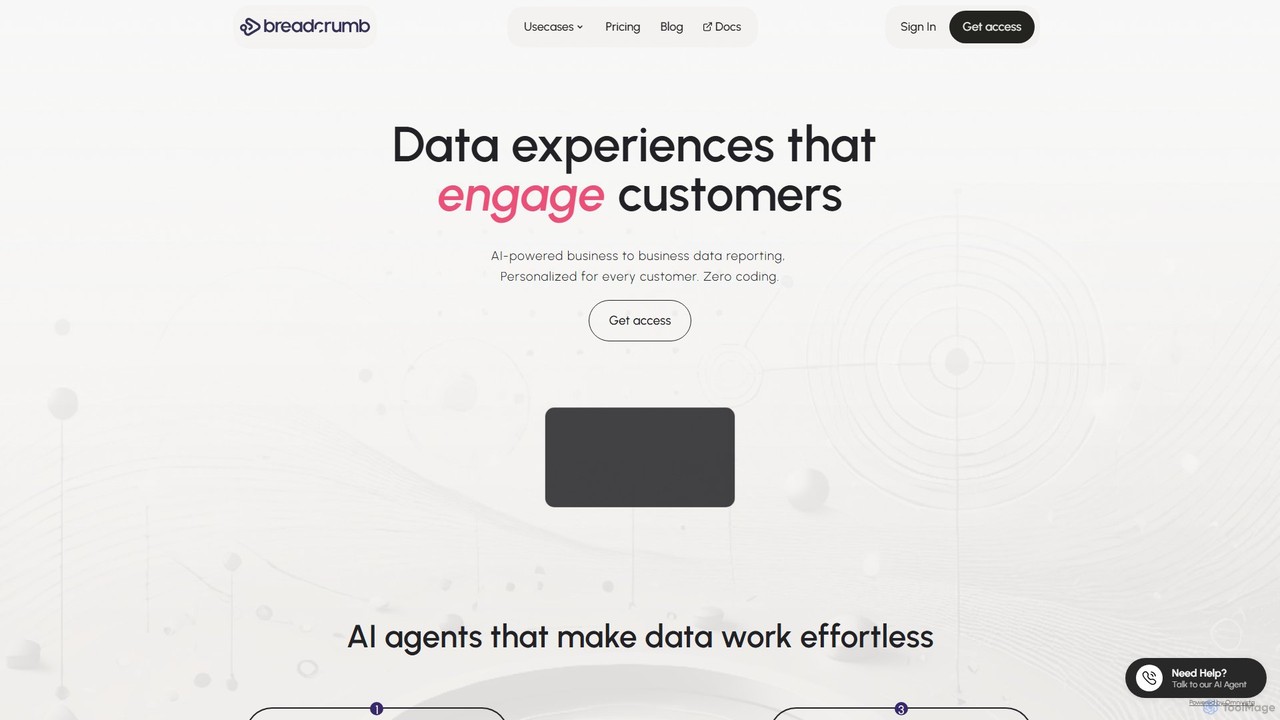
Breadcrumb.ai
Breadcrumb.ai is an AI-powered, no-code platform for scalable B2B data reporting. It automates the entire data workflow, from …
Breadcrumb.ai is an AI-powered, no-code platform for scalable B2B data reporting. It automates the entire data workflow, from ingestion and cleaning to analysis and visualization. Users can ask questions in natural language to generate interactive, narrative-driven reports and embed them directly into websites or applications, empowering customers with self-serve insights.
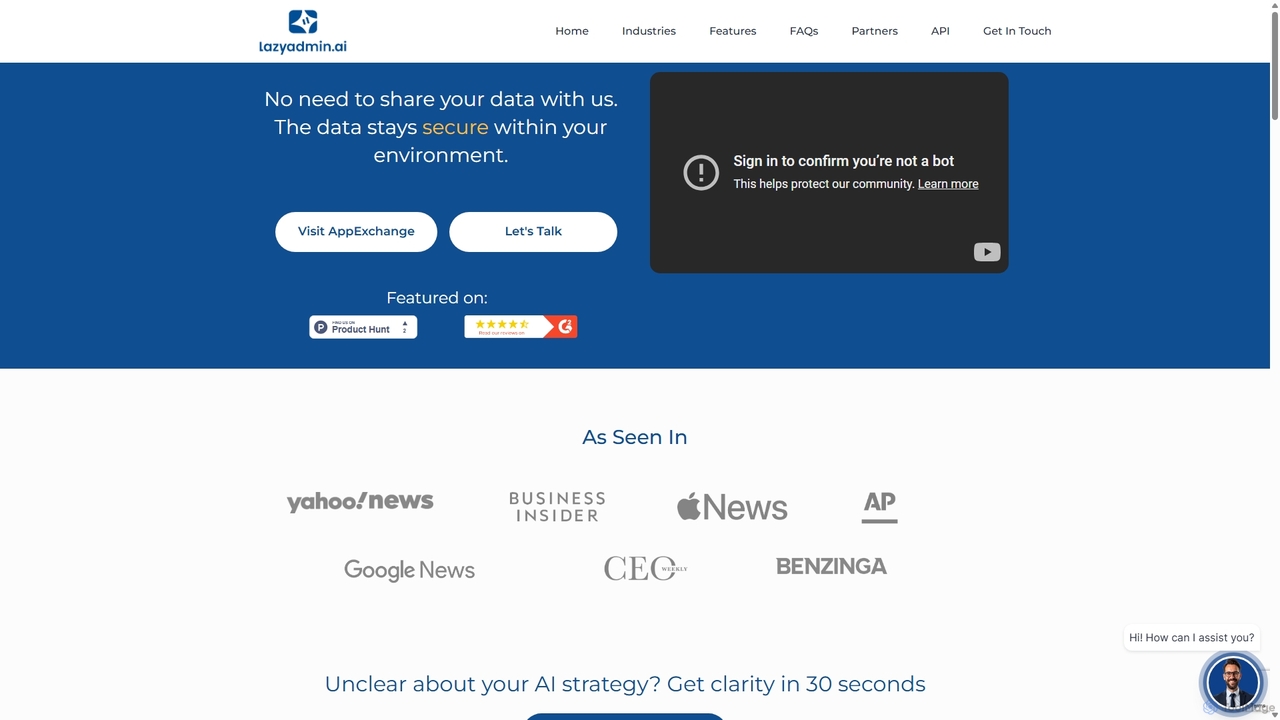
Lazy Admin
Lazy Admin is an AI-powered data analysis and reporting solution designed primarily for Salesforce. It enables users to …
Lazy Admin is an AI-powered data analysis and reporting solution designed primarily for Salesforce. It enables users to query data, generate charts, and create dashboards using natural language. The tool emphasizes security by keeping all data within your environment and can be personalized to understand your specific business terminology, making data insights accessible to everyone on your team.
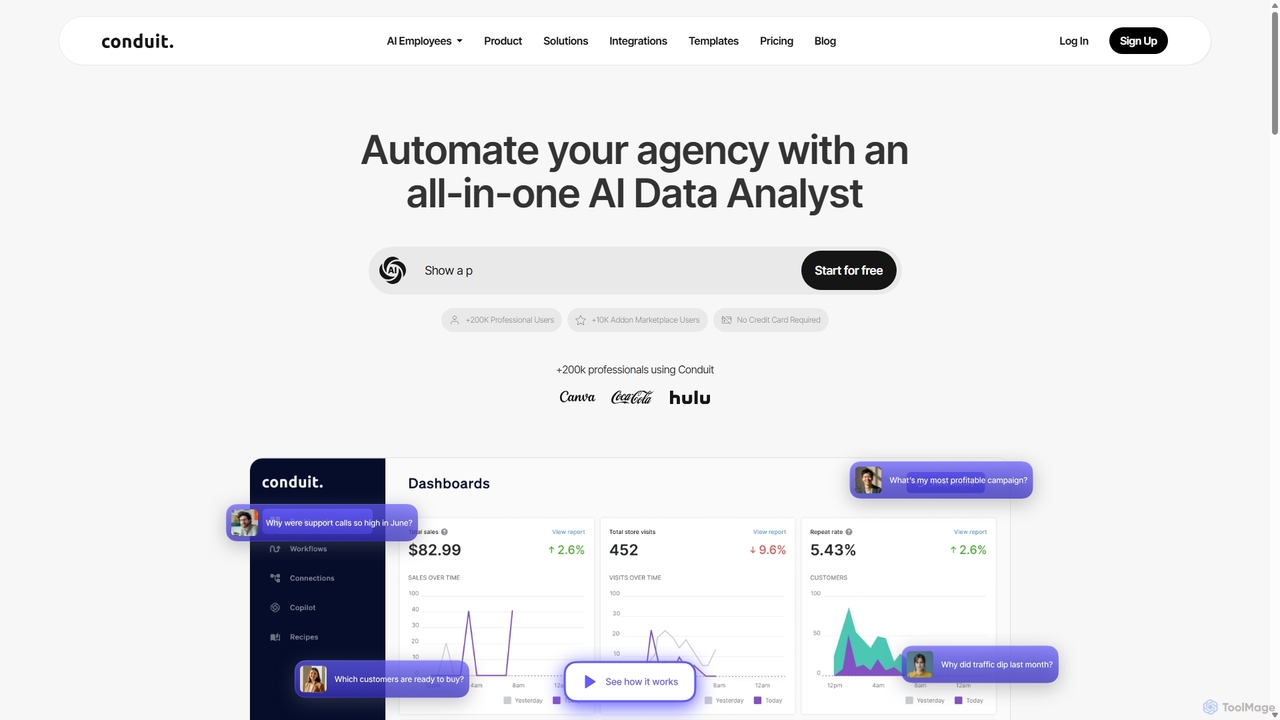
Conduit
Conduit is an all-in-one AI data analyst platform designed to automate agencies and businesses. It centralizes data from …
Conduit is an all-in-one AI data analyst platform designed to automate agencies and businesses. It centralizes data from hundreds of sources like CRMs, ad platforms, and databases, enabling users to build automated workflows, create interactive dashboards, and query their data using a natural language AI copilot. It's built for marketing teams, data analysts, and developers to save time, improve accuracy, and make faster, data-driven decisions.
GenRPT
GenRPT is an AI-powered platform that transforms data from SQL, PDF, and Excel into actionable insights and reports. …
GenRPT is an AI-powered platform that transforms data from SQL, PDF, and Excel into actionable insights and reports. Connect your data sources, ask questions in natural language, and receive instant analysis, summaries, and visualizations to accelerate data-driven decision-making.
Morph Ai Era
Morph Ai Era is an AI-powered, interactive data analytics dashboard. It enables users to upload data, create a …
Morph Ai Era is an AI-powered, interactive data analytics dashboard. It enables users to upload data, create a wide range of visualizations, and leverage AI tools for automated insights, growth forecasting, and anomaly detection. It's designed to transform raw data into actionable business intelligence.
Hiddenq Category
Hiddenq Tag
Hiddenq Applicable Job
Hiddenq AI Tool Comparison
Hiddenq Embed Feature
Just copy the embed code below and paste this beautiful badge on your blog, article, or official app website to drive traffic directly to this tool's detail page and quickly boost your exposure and user count!

No comments yet, be the first to comment!