Morph Ai Era
Visit Website


Morph Ai Era Overview
Morph Ai Era is a comprehensive web-based platform designed for interactive data analysis and visualization. It empowers users to upload their datasets and transform them into insightful dashboards featuring a multitude of chart types. The platform integrates powerful AI tools to provide automated summaries, detect anomalies, forecast future trends, and perform advanced analytics like customer segmentation, making data-driven decision-making more accessible and efficient.
How to use Morph Ai Era
To begin using Morph Ai Era, start by signing up for an account or logging in. Once in the dashboard, upload your data file. You can then interact with your data by selecting from an extensive list of chart types to build your visualizations. For deeper analysis, navigate to the analytics toolkit to apply AI features like forecasting or health checks. Users can save their customized dashboard views for later access and download their findings as a Smart PDF report.
Core Features of Morph Ai Era
- Interactive Visualization: Offers a vast library of chart types including bar, line, pie, scatter, maps, funnel, and waterfall charts.
- AI-Powered Analytics: Features automated insights, anomaly detection, 3-month forecasting, and customer segmentation through clustering.
- Data Preparation: Includes tools to handle missing data and process dates for cleaner analysis.
- Advanced Metrics & Scenarios: Provides financial calculations like profit margin and a "What-If" scenario planner to simulate the impact of changes like price increases.
- Custom Dashboards: Users can save and load different dashboard views to track specific metrics.
- Smart Reporting: Allows for the download of analyses and visualizations as a "Smart PDF".
- Geospatial Intelligence: Automatically generates map visualizations when data includes a "Country" column.
Use Cases for Morph Ai Era
Ideal for business analysts tracking sales and profit trends, marketing teams performing customer segmentation and analyzing campaign performance, and financial planners forecasting revenue and simulating business scenarios. It can also be used by managers to create comprehensive performance dashboards and generate data-backed reports for stakeholder meetings.
Advantages of Morph Ai Era
Morph Ai Era centralizes data visualization and advanced AI analysis into a single, user-friendly platform. Its strength lies in the breadth of its visualization options and its automated, AI-driven insights which save significant time and expertise. The ability to perform "What-If" analysis and generate smart reports makes it a practical tool for strategic business planning.
Morph Ai Era Frequently Asked Questions
Morph Ai Era Comments (1)
Log in to post comments
Log in nowMorph Ai Era Alternatives
View All
Othor AI
Othor AI is a no-code business intelligence platform that transforms your data into actionable insights in seconds. It …
Othor AI is a no-code business intelligence platform that transforms your data into actionable insights in seconds. It automatically generates narrative-driven reports, smart charts, and predictive analytics, enabling anyone in your organization to make faster, data-driven decisions without technical expertise. Connect your data sources and get instant dashboards and executive summaries.
Lazy Admin
Lazy Admin is an AI-powered data analysis and reporting solution designed primarily for Salesforce. It enables users to …
Lazy Admin is an AI-powered data analysis and reporting solution designed primarily for Salesforce. It enables users to query data, generate charts, and create dashboards using natural language. The tool emphasizes security by keeping all data within your environment and can be personalized to understand your specific business terminology, making data insights accessible to everyone on your team.
SimplyPut
SimplyPut is a conversational AI data analytics platform that empowers anyone to get instant, trustworthy answers from their …
SimplyPut is a conversational AI data analytics platform that empowers anyone to get instant, trustworthy answers from their data. By asking questions in natural language, users can bypass static dashboards and complex queries, making data-driven decision-making accessible to all teams, from marketing to finance.
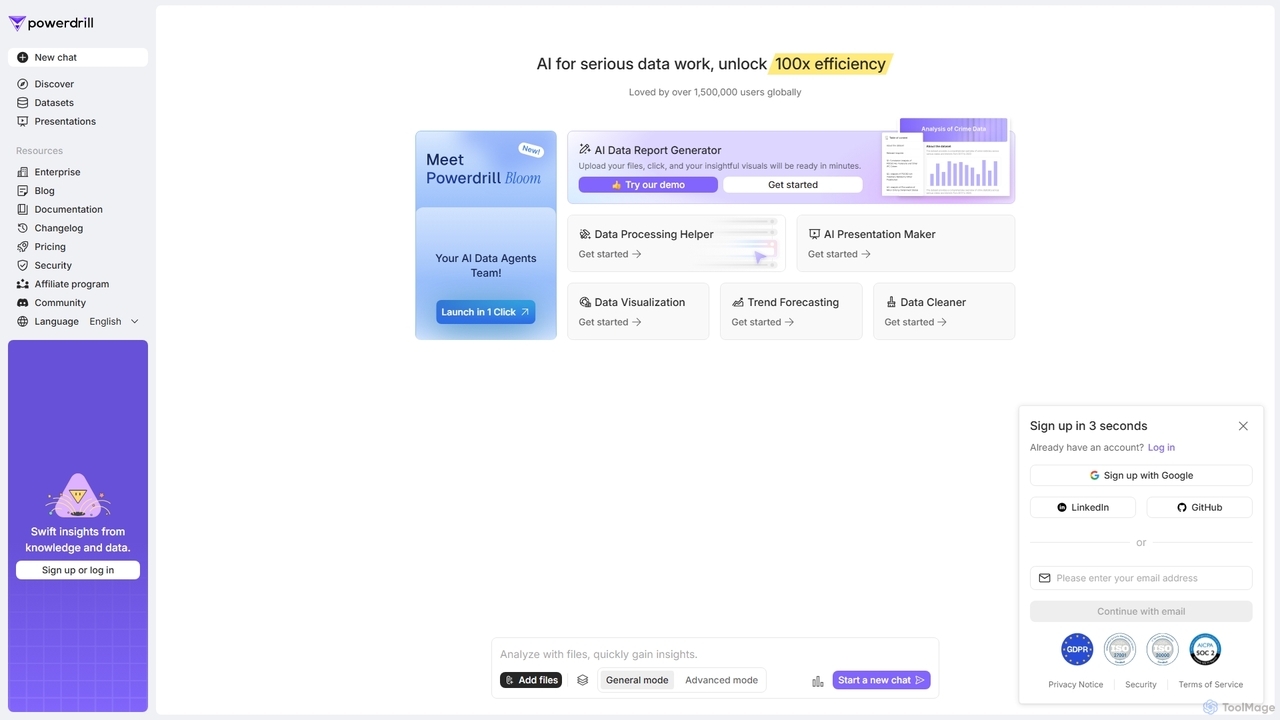
Powerdrill
Powerdrill is an AI-powered data analysis platform designed for serious data work, enabling users to unlock 100x efficiency. …
Powerdrill is an AI-powered data analysis platform designed for serious data work, enabling users to unlock 100x efficiency. It automates the entire process from data processing and cleaning to visualization, report generation, and trend forecasting. Simply upload your files (Excel, CSV, PDF) or connect to a database, and let the AI generate actionable insights, interactive charts, and comprehensive presentations in minutes.
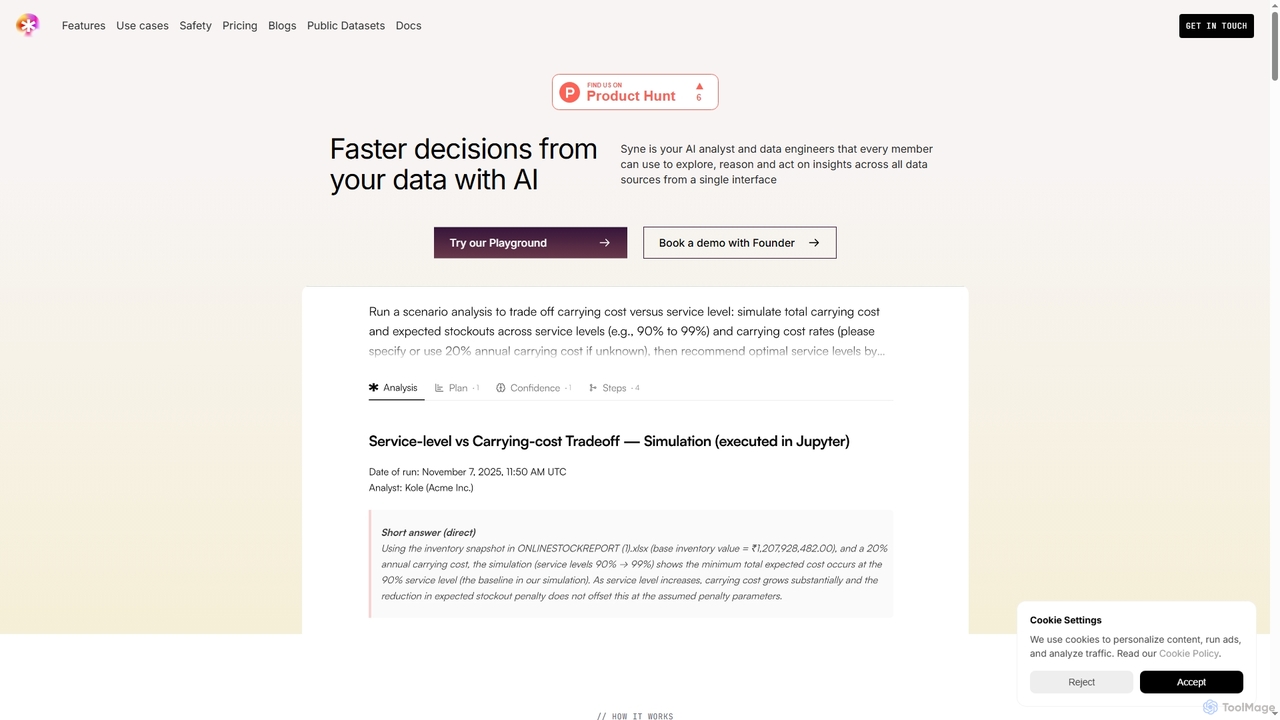
Syne
Syne is an AI-powered data analytics platform that functions as an AI analyst and data engineer. It enables …
Syne is an AI-powered data analytics platform that functions as an AI analyst and data engineer. It enables all team members to explore, analyze, and act on insights from over 100 data sources using natural language queries through a single interface, eliminating the need for complex SQL knowledge for basic inquiries.
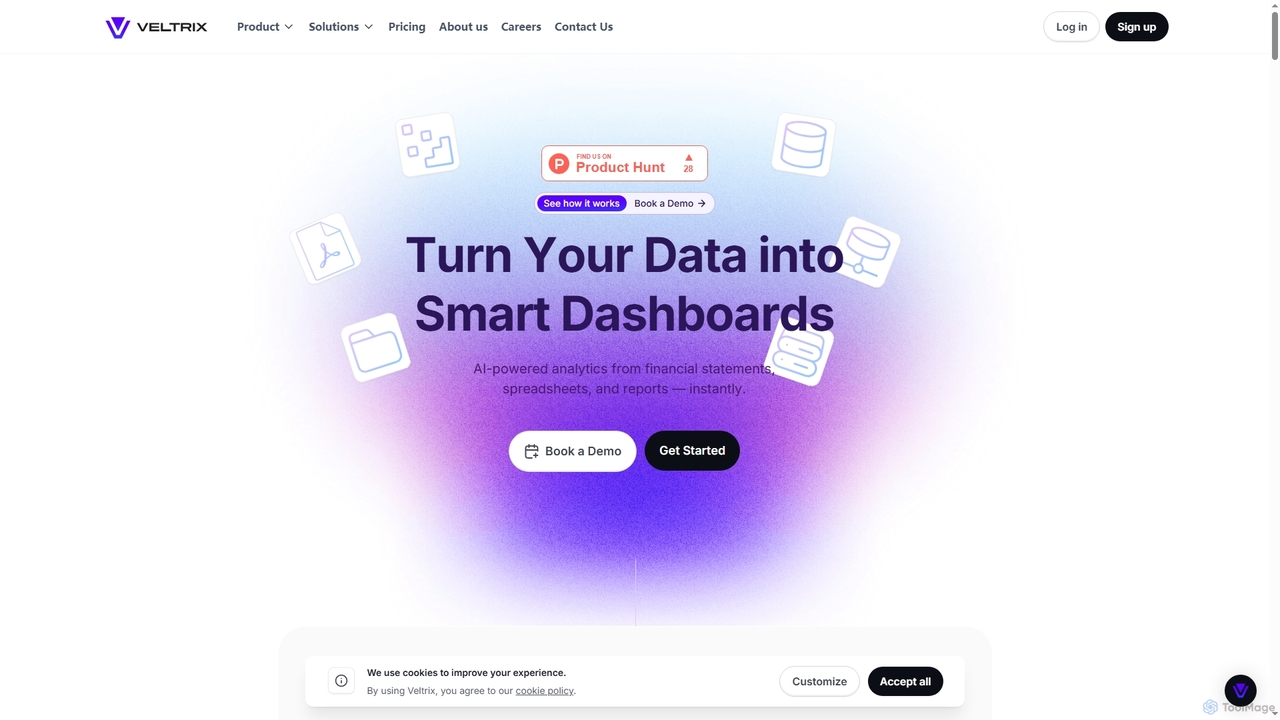
Veltrix
Veltrix is an AI-powered, no-code platform that transforms raw data from files and connected sources into interactive dashboards. …
Veltrix is an AI-powered, no-code platform that transforms raw data from files and connected sources into interactive dashboards. Users can ask questions in plain language to get instant, visualized answers for business intelligence and financial analysis.
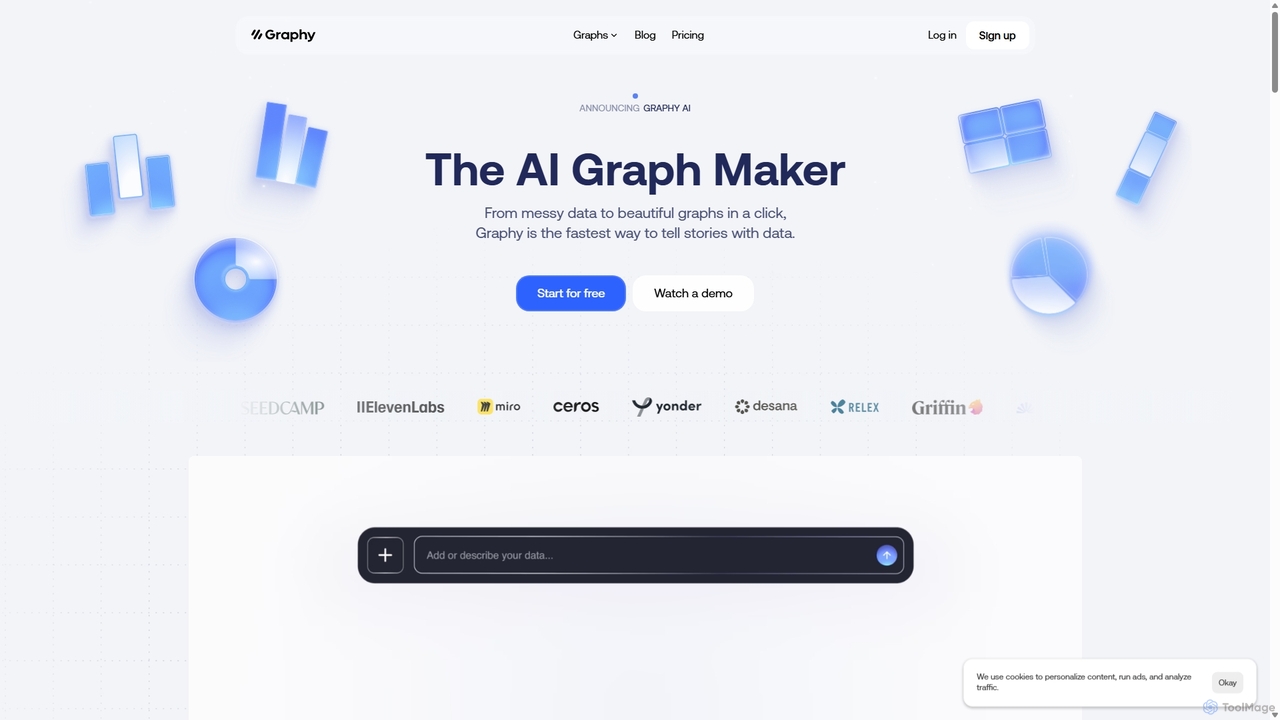
Graphy
Graphy is an AI-powered data visualization tool that transforms raw data into beautiful, interactive charts and graphs in …
Graphy is an AI-powered data visualization tool that transforms raw data into beautiful, interactive charts and graphs in seconds. It simplifies data storytelling by automatically identifying key insights, allowing users to chat with their data, and offering extensive customization. Ideal for marketers, analysts, and teams who need to create compelling visual reports and presentations without complex software.
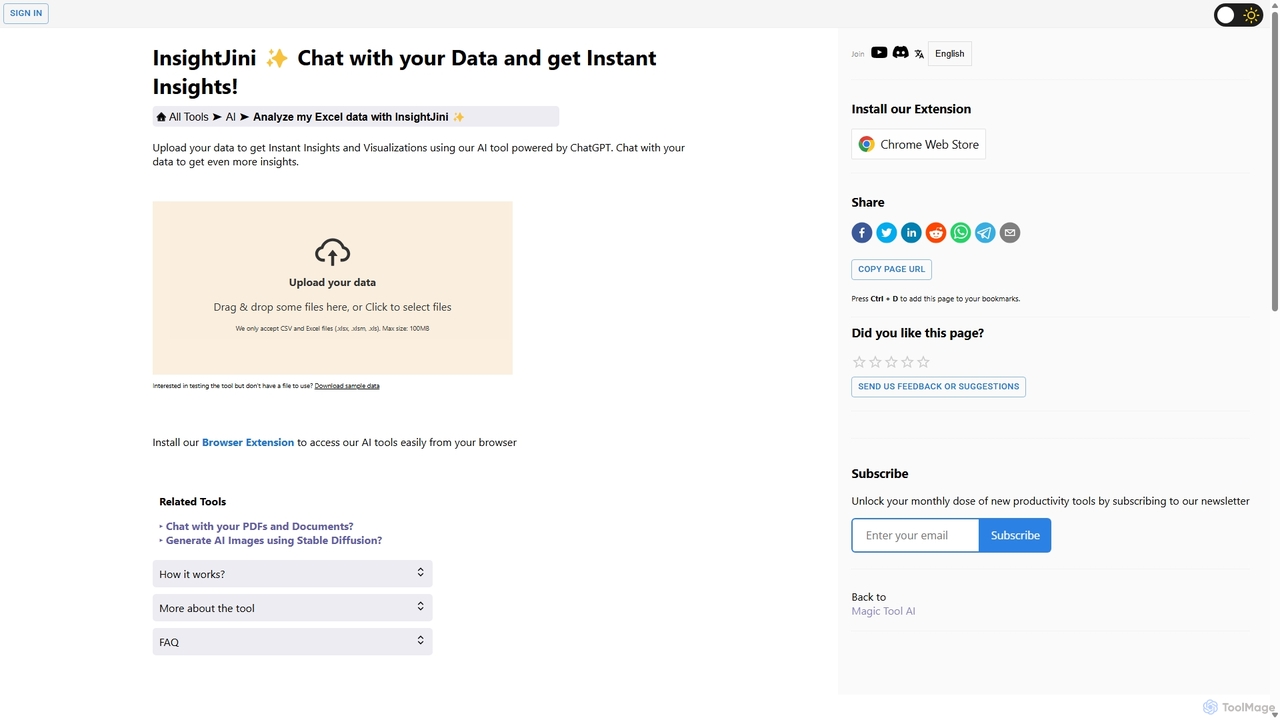
InsightJini
InsightJini is an AI-powered data analysis tool that lets you chat with your Excel and CSV files. Upload …
InsightJini is an AI-powered data analysis tool that lets you chat with your Excel and CSV files. Upload your data to instantly generate visualizations and insights without any coding. Its conversational interface, powered by ChatGPT, makes data exploration intuitive and accessible for everyone.

TigerEye
TigerEye is an AI-powered Go-To-Market (GTM) Business Intelligence platform designed to unify sales, marketing, and finance teams. It …
TigerEye is an AI-powered Go-To-Market (GTM) Business Intelligence platform designed to unify sales, marketing, and finance teams. It provides instant answers to complex business questions, accelerates report and dashboard creation, and offers powerful tools for territory planning and performance tracking, enabling smarter, faster revenue growth.
Flarelight
Flarelight is an AI-powered, no-code business intelligence platform for data analysis and visualization. It allows users to import …
Flarelight is an AI-powered, no-code business intelligence platform for data analysis and visualization. It allows users to import data from any source, prepare it visually, perform deep analysis, and build interactive reports. The all-in-one tool supports both cloud and on-premise deployment, featuring workflow automation and natural language configuration to turn complex data into actionable decisions.
Morph Ai Era Category
Morph Ai Era Tag
Morph Ai Era Applicable Job
Morph Ai Era AI Tool Comparison
Morph Ai Era Embed Feature
Just copy the embed code below and paste this beautiful badge on your blog, article, or official app website to drive traffic directly to this tool's detail page and quickly boost your exposure and user count!

Wow if I share real comment so yes, it is good for making Dashboards, but I didn't get another tool which were able to make graphs so simply so for this case I will give 10/10 but if you say overall tool so I will give 6/10 as some points it is looking like it is building tool not completed tool...