Wudpecker
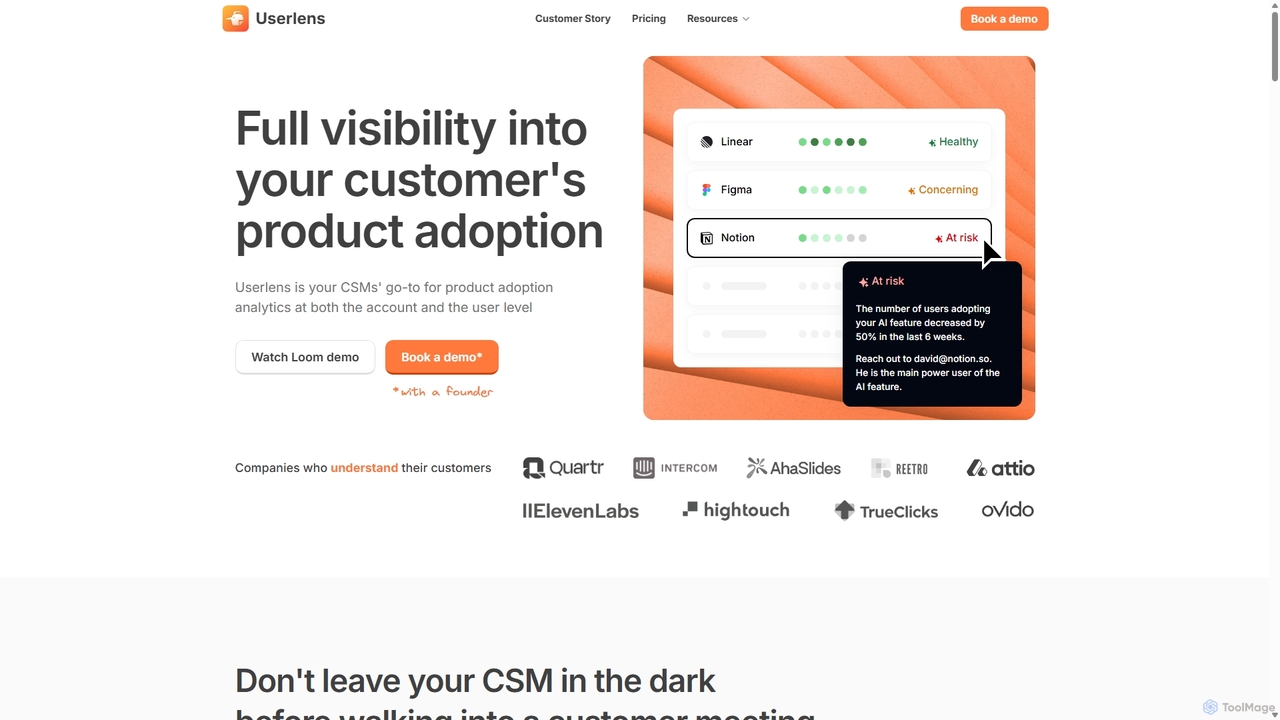
Wudpecker is an AI-powered platform offering two core solutions: an AI Meeting Assistant for automated recording, transcription, and …
Wudpecker is an AI-powered platform offering two core solutions: an AI Meeting Assistant for automated recording, transcription, and summarization, and Userlens, a product analytics tool for customer success teams to monitor user adoption, assess account health, and prevent churn. It streamlines meeting productivity and provides deep customer insights.

Seline
Seline is a privacy-first, lightweight, and user-friendly website and product analytics platform. As a cookieless alternative to Google …
Seline is a privacy-first, lightweight, and user-friendly website and product analytics platform. As a cookieless alternative to Google Analytics, it offers real-time insights through an intuitive dashboard, visitor journey tracking, conversion funnels, and AI-powered chat. Designed for simplicity and performance, Seline helps businesses, SaaS companies, and e-commerce stores understand user behavior without compromising on privacy or site speed. It's GDPR compliant and easy to integrate in minutes.
June
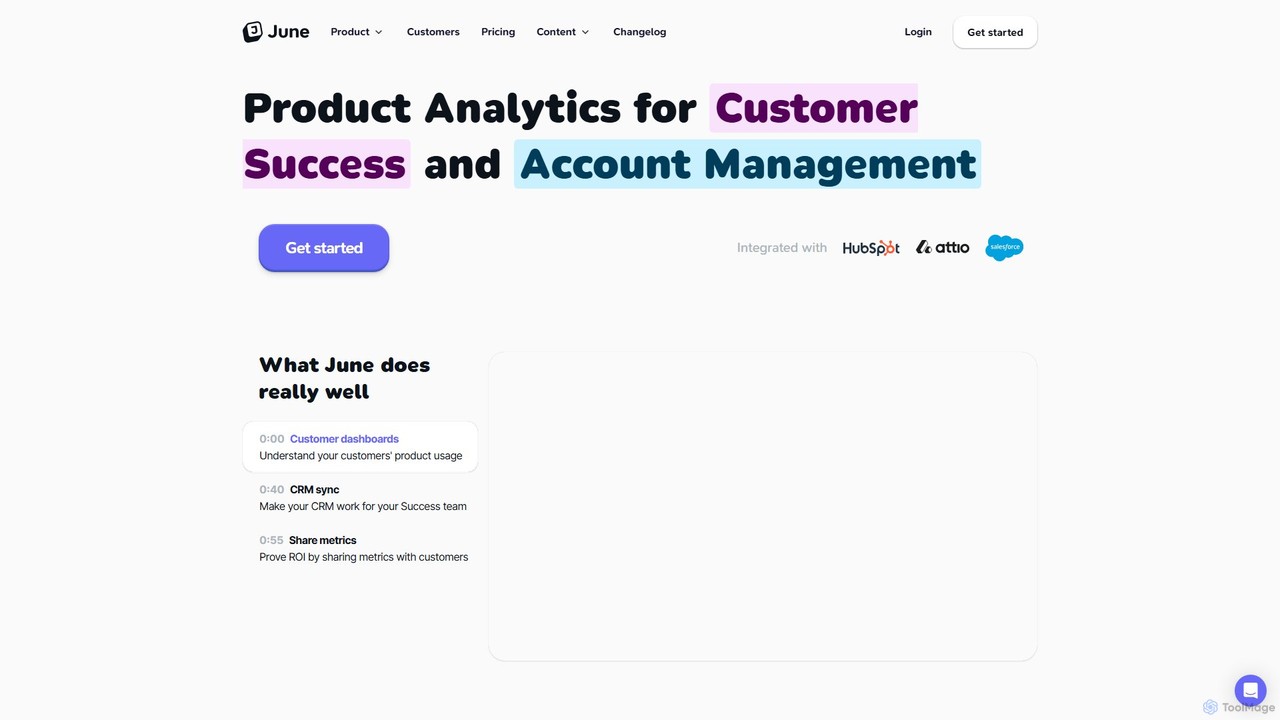
June is a product analytics platform designed for B2B SaaS companies. It helps customer success and account management …
June is a product analytics platform designed for B2B SaaS companies. It helps customer success and account management teams understand product usage at the account level, proactively prevent churn, and identify expansion opportunities. By integrating with CRMs like HubSpot and Salesforce, June enriches customer data with actionable usage insights, enabling teams to build health scores and have more contextual conversations.
Heap
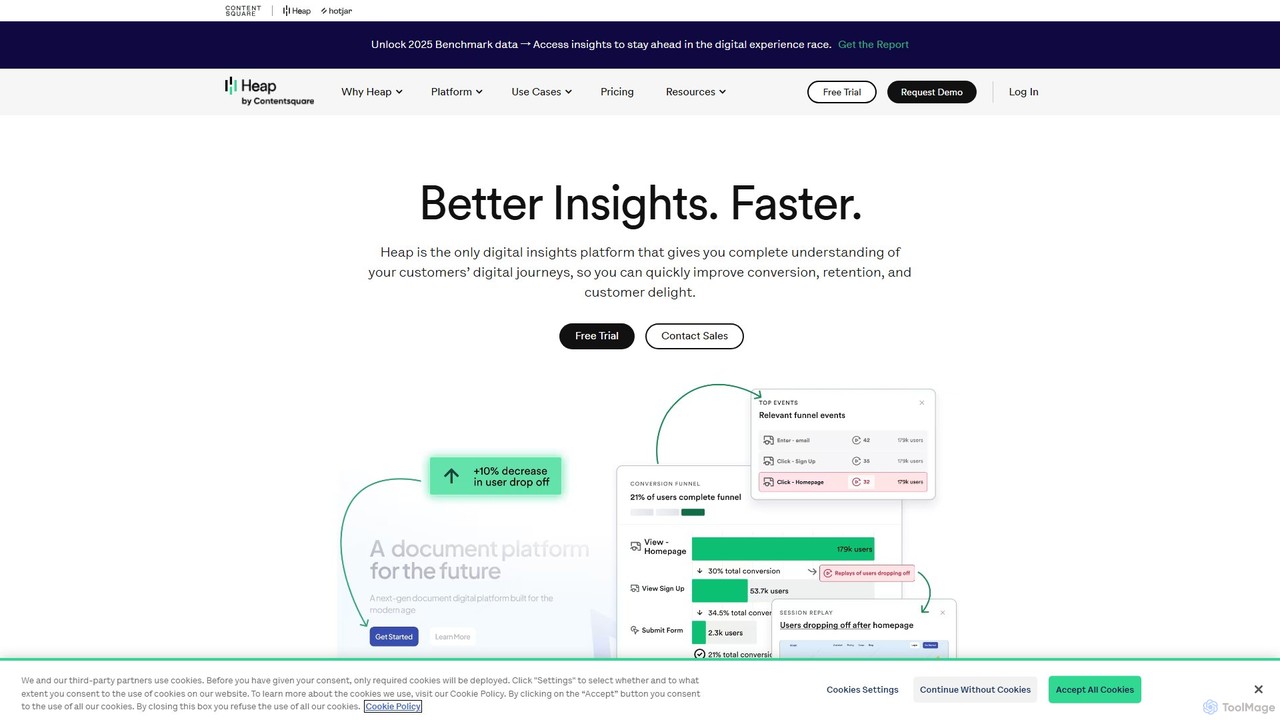
Heap is a leading digital insights platform that automatically captures all user interactions across web and mobile. Powered …
Heap is a leading digital insights platform that automatically captures all user interactions across web and mobile. Powered by AI, it provides a complete understanding of the customer journey, enabling teams to improve conversion, retention, and user experience without manual event tracking.
About Product Analytics
Product Analytics tools are a specialized class of software for capturing, analyzing, and visualizing user interaction data within a digital product or application. They utilize event-based tracking to monitor specific user actions, such as clicks, feature usage, and navigation paths, providing granular insights into behavior. This data helps product teams understand how users engage, identify friction points, and make informed decisions to improve user experience, feature adoption, and retention. Unlike broader web analytics, their primary focus is on the in-product journey rather than traffic acquisition.
Core Features
- Event-Based Tracking: Capture detailed user interactions as discrete events, such as 'Button Clicked' or 'Video Played', for granular analysis.
- Funnel Analysis: Visualize the steps users take to complete a key action, identifying where they drop off in the process.
- User Segmentation: Group users into cohorts based on behavior, demographics, or custom attributes to compare their engagement and retention.
- Retention Analysis: Measure how many users return to the product over time, helping to understand long-term value and stickiness.
- Behavioral Cohorts: Create dynamic user groups based on actions they have or have not taken to personalize experiences or target campaigns.
Use Cases
These tools are essential for product managers, UX/UI designers, and growth marketers in SaaS companies, mobile app development, and e-commerce platforms. They are used to optimize user onboarding flows, prioritize feature development based on actual usage data, and measure the impact of A/B tests on user behavior. For instance, a product team can identify which features are most used by their power users and promote those workflows to new customers.
How to Choose
When selecting a Product Analytics tool, consider its data model (event-based is standard), ease of implementation (SDKs, no-code options), and integration capabilities with your existing tech stack (e.g., CRM, data warehouse). Also evaluate the depth of its analysis features, such as cohort and funnel analysis, and ensure its pricing model (often based on monthly tracked users or events) aligns with your growth projections.
Product AnalyticsUse Cases
Optimize User Onboarding Funnels
A product manager for a SaaS platform notices a high drop-off rate during the user onboarding process. By implementing a product analytics tool, they create a funnel to visualize the entire journey, from sign-up to initial feature use. The data reveals a 60% drop-off at the 'Connect to third-party integration' step. By analyzing session recordings for users who drop off, they identify a confusing UI element. After redesigning the step and running an A/B test, they successfully increase the onboarding completion rate by 35%, directly improving user activation.
Prioritize Feature Development with Data
A mobile app development team has limited resources and needs to decide which feature to build next: 'Advanced Reporting' or 'Team Collaboration'. Instead of relying on intuition, they use a product analytics tool to analyze current behavior. They discover that 85% of their power users frequently use the 'Export Data' function, while only 15% have ever invited a team member. This data strongly suggests a high demand for better reporting capabilities. The team confidently prioritizes 'Advanced Reporting', ensuring their development effort aligns with proven user needs.
Reduce Churn by Identifying At-Risk Users
A subscription-based e-learning platform wants to proactively reduce customer churn. The growth team uses their product analytics tool to create a behavioral cohort of 'at-risk' users, defined as users who haven't completed a lesson in the last 14 days but were previously active. The analysis shows this segment is 4 times more likely to churn in the next month. They then set up an automated in-app notification campaign targeted specifically at this cohort, offering a discount on their next month or suggesting a new, popular course. This targeted intervention reduces churn within this specific segment by 20%.
Measure the Impact of a New Feature Launch
A project management software company launches a highly anticipated 'Gantt Chart View' feature. The product team needs to measure its success beyond initial announcements. Using product analytics, they track key metrics: 1) Adoption Rate: the percentage of active users who try the new view within the first 30 days. 2) Usage Frequency: how often users switch to this view. 3) Impact on Retention: they compare the 3-month retention rate of users who adopt the Gantt view versus those who don't. The data shows a 25% higher retention rate for adopters, providing clear evidence of the feature's value and a strong ROI for the development effort.
Personalize User Experience with Behavioral Segments
An e-commerce site's marketing team wants to move beyond simple demographic targeting. They use a product analytics tool to create dynamic behavioral segments. For example, they create a 'Bargain Hunters' segment for users who frequently apply coupons and sort by 'Price: Low to High', and a 'Brand Loyalists' segment for users who repeatedly purchase from the same brand. By integrating this data with their marketing automation platform, they can send targeted emails: 'Bargain Hunters' receive special discount offers, while 'Brand Loyalists' get early access to new products from their favorite brand, increasing engagement and conversion rates.
Validate Product Decisions with A/B Testing Data
A UX designer proposes changing the main call-to-action button on a landing page from green to orange, hypothesizing it will increase sign-ups. Instead of making a subjective decision, the team runs an A/B test. They integrate their A/B testing tool with their product analytics platform. This allows them to not only measure the click-through rate but also track the downstream behavior of users from each variant. The product analytics data shows that while the orange button gets 5% more clicks, users from the green button variant have a 10% higher rate of completing the full sign-up process. Based on this deeper insight, the team decides to keep the green button, avoiding a local optimization that would have hurt their primary business goal.