ToolMage
Sign in

Best 1 Bi Tools for Development

Popular Bi Tools in Development include Claribi, helping you work more efficiently.

Claribi
Paid

Claribi

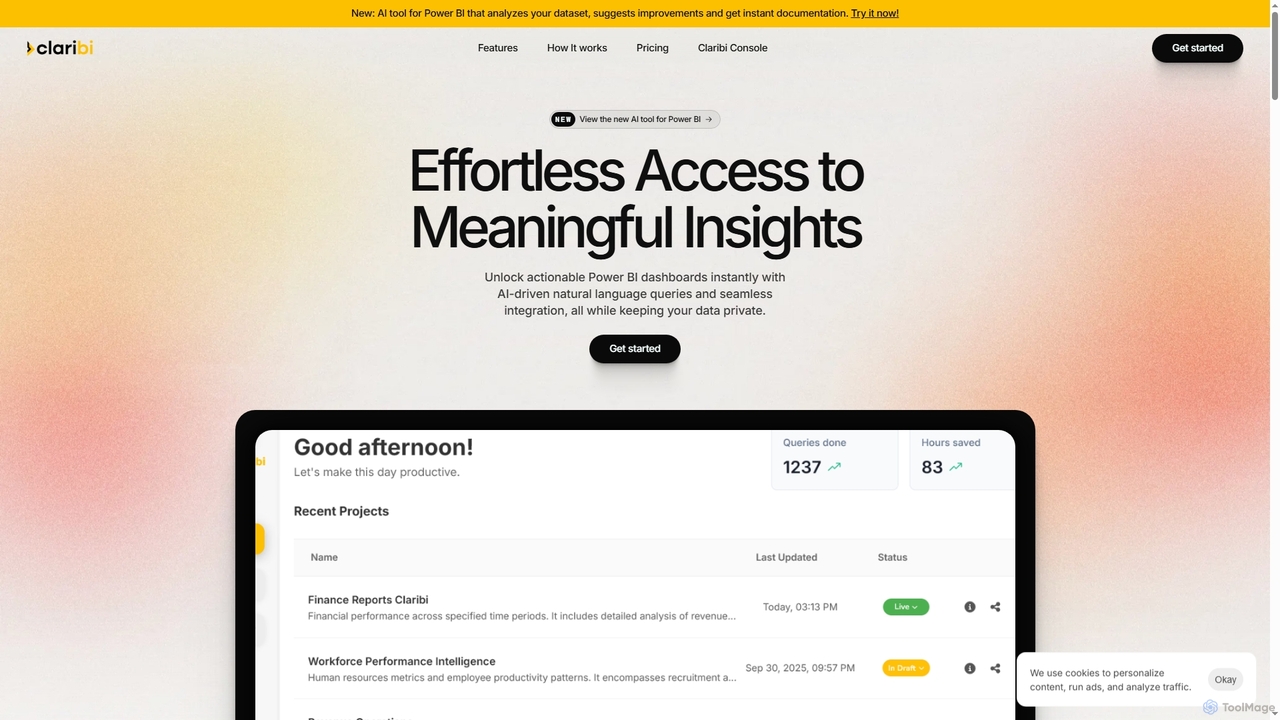
Claribi is an AI-powered tool that transforms Power BI usage by enabling natural language queries, automating documentation, and providing intelligent assistance for report creation and debugging. It offers effortless access to meaningful insights, cross-report discovery, and ensures enterprise-grade data security by working exclusively with metadata.

3D
Visits 6.6KFavorites 133Likes 124

About Bi Tools

BI Tools (Business Intelligence Tools) are a category of software designed to collect, process, analyze, and visualize business data, enabling data-driven decision-making. These tools leverage advanced analytics and reporting capabilities to transform raw data from various sources into actionable insights. They empower organizations to monitor performance, identify trends, and gain a deeper understanding of their operations, contributing significantly to strategic development within the broader development ecosystem.

Core Features

  • Data Integration: Connects to diverse data sources (databases, spreadsheets, cloud services) for unified analysis.
  • Data Warehousing: Stores and manages large volumes of historical and real-time data for efficient querying.
  • Interactive Dashboards: Creates dynamic, customizable visual representations of key performance indicators (KPIs) and metrics.
  • Ad-hoc Reporting: Allows users to generate custom reports on demand, exploring specific data sets without IT intervention.
  • Predictive Analytics: Utilizes statistical algorithms and machine learning to forecast future trends and outcomes.

Applicable Scenarios

BI Tools are essential for various roles across industries. Marketing teams use them to analyze campaign performance and customer behavior. Sales departments leverage dashboards to track revenue, identify top-performing products, and manage pipelines. Finance professionals rely on BI for budgeting, forecasting, and detailed financial reporting, ensuring fiscal health and strategic resource allocation.

How to Choose

When selecting a BI Tool, consider its data integration capabilities with your existing systems, the intuitiveness of its user interface for your team, and the scalability to handle growing data volumes. Evaluate the range of visualization options, reporting features, and the level of support for advanced analytics like machine learning. Finally, assess the pricing model and community support for long-term viability.

Bi Tools use cases

1

Optimizing Sales Performance & Identifying Growth Opportunities

Sales managers use BI dashboards to monitor real-time sales figures, track individual and team performance against targets, and identify top-selling products or regions. By visualizing trends and anomalies, they can quickly adjust strategies, allocate resources more effectively, and pinpoint new market opportunities, leading to improved revenue generation and market share.

2

Enhancing Marketing Campaign Effectiveness

Marketing analysts leverage BI Tools to consolidate data from various channels (social media, email, website analytics) to measure campaign ROI. They analyze customer demographics, engagement rates, and conversion paths to understand what drives success. This enables data-driven optimization of future campaigns, personalization of content, and more efficient budget allocation.

3

Streamlining Financial Reporting & Budgeting

Finance departments utilize BI Tools to automate the aggregation of financial data from ERP systems, accounting software, and other sources. They create interactive reports for profit & loss, balance sheets, and cash flow, and develop accurate budget forecasts. This provides stakeholders with transparent, up-to-date financial insights for strategic planning and compliance.

4

Improving Operational Efficiency

Operations managers deploy BI dashboards to track key operational metrics such as production output, inventory levels, and supply chain performance. By visualizing process flows and identifying bottlenecks or inefficiencies, they can make informed decisions to optimize resource utilization, reduce waste, and streamline workflows, ultimately enhancing overall productivity and cost-effectiveness.

5

Understanding Customer Behavior & Personalization

Product and customer experience teams use BI Tools to analyze vast amounts of customer data, including purchase history, website interactions, and support tickets. This helps them segment customers, understand preferences, and predict future needs. The insights gained are crucial for developing personalized product recommendations, targeted promotions, and improving customer satisfaction and retention.

6

Optimizing Supply Chain & Inventory Management

Supply chain professionals use BI Tools to gain end-to-end visibility into their logistics, from procurement to delivery. They analyze supplier performance, inventory turnover rates, and transportation costs. By identifying inefficiencies and forecasting demand more accurately, they can optimize stock levels, reduce carrying costs, prevent stockouts, and improve overall supply chain resilience.

Bi Tools FAQ

What are BI Tools?

BI Tools (Business Intelligence Tools) are software applications designed to collect, process, analyze, and visualize business data to support informed decision-making. They typically feature data integration capabilities, interactive dashboards, and reporting functions. Common use cases include performance monitoring, trend analysis, and strategic planning, transforming raw data into actionable insights for businesses.

How do BI Tools help businesses?

BI Tools significantly help businesses by providing a clear, comprehensive view of their operations and market landscape. They enable organizations to identify key trends, pinpoint areas for improvement, and make data-driven decisions that enhance efficiency, reduce costs, and uncover new opportunities. This leads to better strategic planning, improved customer satisfaction, and a competitive advantage in the market.

What are the key features to look for in a BI Tool?

When evaluating BI Tools, look for robust data integration capabilities to connect with all your data sources. Essential features include interactive dashboards for dynamic visualization, comprehensive reporting options, and strong data governance for security and compliance. Also consider scalability, ease of use for non-technical users, and support for advanced analytics like predictive modeling to meet future needs.

What's the difference between BI Tools and traditional reporting tools?

Traditional reporting tools primarily generate static, pre-defined reports based on historical data, offering limited interactivity. BI Tools, however, provide dynamic, interactive dashboards and ad-hoc query capabilities, allowing users to explore data in real-time, identify trends, and perform deeper analysis. BI Tools focus on understanding *why* things happened and *what might happen*, whereas traditional reporting focuses on *what* happened.

Who typically uses BI Tools?

BI Tools are used by a wide range of professionals across an organization. This includes executives for strategic oversight, sales and marketing teams for performance analysis, finance departments for budgeting and forecasting, and operations managers for efficiency monitoring. Data analysts and business users also leverage these tools to gain insights, create custom reports, and support their daily decision-making processes.