Daylit
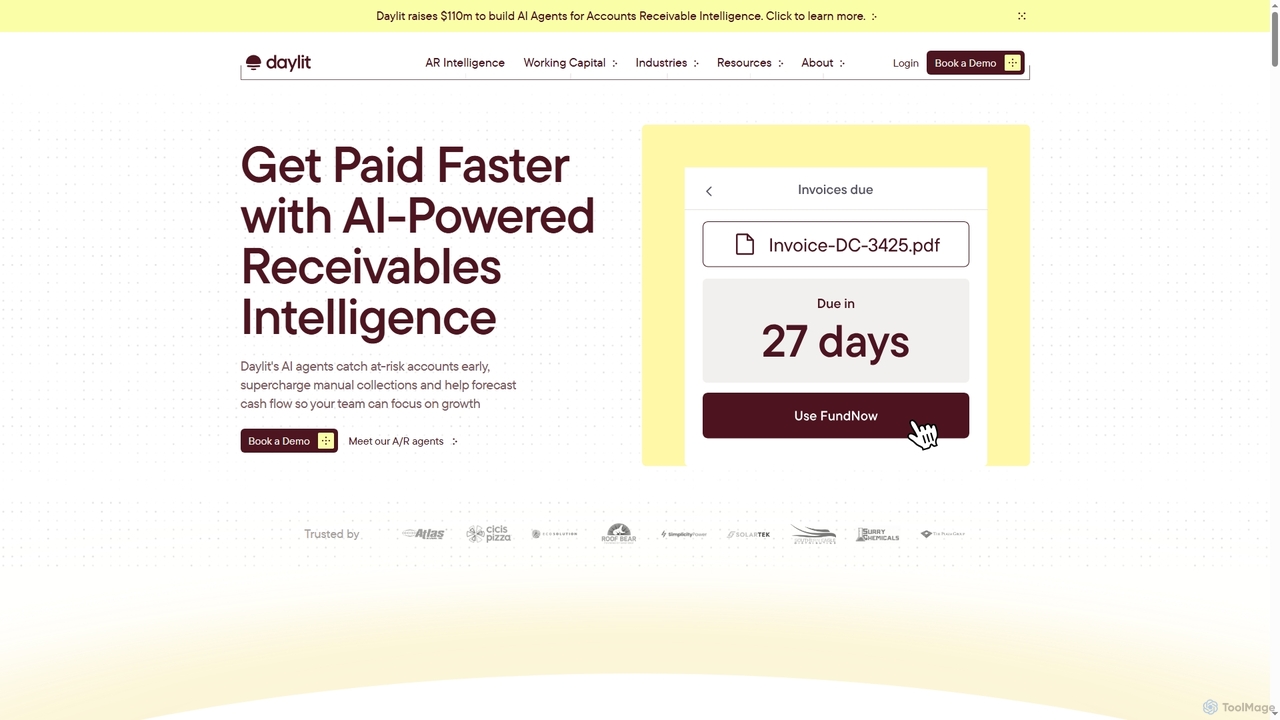
Daylit is an AI-powered platform for accounts receivable intelligence and working capital solutions. It uses AI agents to …
Daylit is an AI-powered platform for accounts receivable intelligence and working capital solutions. It uses AI agents to automate collections, track receivables, forecast cash flow, and identify at-risk accounts, helping businesses get paid faster and optimize financial operations.
Kensho
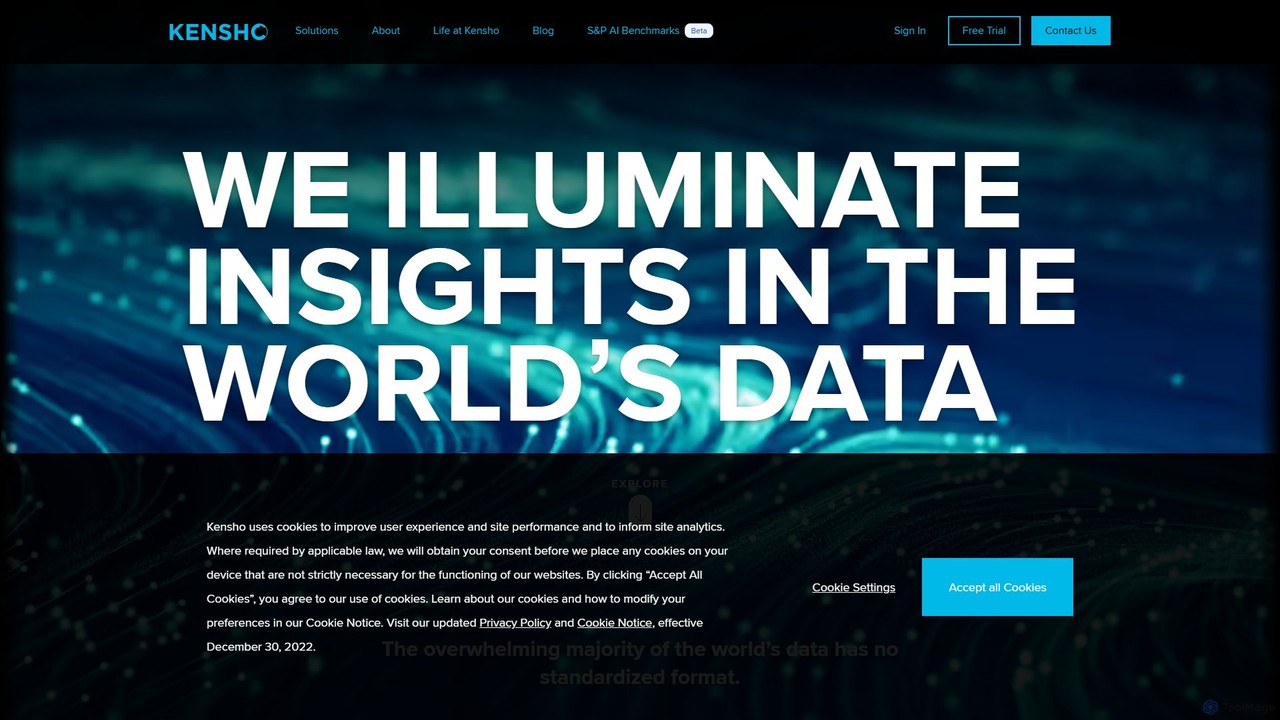
Kensho, the AI and innovation hub for S&P Global, provides a suite of advanced AI solutions to structure …
Kensho, the AI and innovation hub for S&P Global, provides a suite of advanced AI solutions to structure unstructured data. Its tools offer high-accuracy audio transcription (Scribe), named entity recognition (NERD), PDF data extraction (Extract), and company data linking (Link), primarily for the finance and business sectors.

ProfitLeap
ProfitLeap combines AI-powered dashboards, fractional CFO services, and expert financial guidance to help small and medium-sized businesses increase …
ProfitLeap combines AI-powered dashboards, fractional CFO services, and expert financial guidance to help small and medium-sized businesses increase profitability and scale smarter. It offers a complete outsourced finance department, including bookkeeping, payroll, and strategic planning, tailored to your specific needs.
About Business Intelligence
Business Intelligence (BI) tools are a class of AI-powered software designed to analyze business data and present actionable insights. Leveraging machine learning, these tools automate the process of data collection, analysis, and visualization, transforming raw data into interactive dashboards and comprehensive reports. They empower organizations, particularly within finance and operations, to make data-driven decisions by uncovering patterns and forecasting trends. Unlike traditional BI, AI-enhanced platforms offer predictive analytics and allow users to query data using simple conversational language.
Core Features
- Interactive Dashboards: Visualize key performance indicators (KPIs) and business metrics in real-time with dynamic charts and graphs.
- Predictive Analytics: Utilize machine learning models to forecast future trends, sales, and market changes based on historical data.
- Natural Language Query (NLQ): Enable users to ask questions about their data in plain language and receive instant answers, charts, or reports.
- Automated Reporting: Schedule and automatically generate and distribute detailed reports on a daily, weekly, or monthly basis.
- Data Integration: Consolidate data from various sources such as databases, CRM systems, ERPs, and cloud applications into a single view.
Use Cases
AI-powered Business Intelligence tools are widely used across various departments including finance, sales, marketing, and operations. Financial analysts use them for budget forecasting and variance analysis. Sales managers track team performance against targets, while marketing teams measure campaign ROI. Executives rely on high-level dashboards for a holistic view of business health, enabling faster and more informed strategic decisions.
How to Choose
When selecting a Business Intelligence tool, consider several factors. Evaluate its data source connectivity to ensure it integrates with your existing systems (e.g., Salesforce, SQL databases). Assess the ease of use for non-technical users versus the advanced capabilities for data analysts. Consider its scalability to handle growing data volumes and user numbers. Finally, review the pricing model—whether it's per-user, usage-based, or a flat subscription—to align with your budget.
Business IntelligenceUse Cases
Real-Time Financial Performance Tracking
A Chief Financial Officer (CFO) uses an AI-powered BI tool to monitor the company's financial health. By integrating data from accounting software, ERPs, and sales platforms, the tool provides a real-time dashboard showing revenue, profit margins, and cash flow. The CFO can use natural language queries like 'Compare Q1 revenue this year vs. last year by region' to get instant visualizations, eliminating the need for manual report creation and enabling faster strategic adjustments.
Sales Funnel Optimization
A sales manager connects their CRM system to a BI tool to analyze the entire sales pipeline. The tool automatically visualizes conversion rates at each stage of the funnel, identifying bottlenecks where leads are dropping off. Its predictive analytics feature can score leads based on their likelihood to close, helping the sales team prioritize their efforts on high-potential prospects and improving overall sales efficiency.
Marketing Campaign ROI Analysis
A marketing team uses a BI tool to consolidate data from Google Ads, Facebook, and their email marketing platform. The tool creates a unified dashboard that tracks key metrics like click-through rate, cost per acquisition (CPA), and return on investment (ROI) across all channels. This allows marketers to quickly identify the most effective campaigns and channels, and reallocate their budget in real-time for maximum impact.
Supply Chain and Inventory Management
An operations manager for a retail company uses a BI tool for demand forecasting and inventory control. By analyzing historical sales data, seasonality, and current market trends, the tool's predictive models forecast future product demand with high accuracy. This helps the company optimize stock levels, reduce carrying costs, and prevent stockouts, ensuring a smoother supply chain and higher customer satisfaction.
Customer Behavior and Churn Analysis
A subscription-based service provider uses a BI tool to understand customer behavior and reduce churn. By analyzing user engagement data, support ticket history, and usage patterns, the tool identifies customers at high risk of churning. It can also segment customers based on their behavior, allowing the marketing team to create targeted retention campaigns and the product team to prioritize features that improve user satisfaction.
Executive-Level Strategic Decision Making
A CEO uses a BI tool on their tablet to get a high-level, 360-degree view of the entire business. The dashboard consolidates key metrics from finance, sales, marketing, and operations into a single, easy-to-digest interface. They can drill down into specific areas of concern, compare performance against historical data, and use predictive forecasts to inform long-term strategic planning, all without needing to request reports from different departments.