PageOn
vs
Venngage
A comprehensive comparison of the core features, performance, user experience, and pricing strategies of two excellent AI tools
Providing objective and detailed selection advice based on real data and user feedback
Overview
PageOn Overview
Discover PageOn, the AI-native tool that automates research and design for stunning presentations. Create interactive slides, charts, and 3D models effortlessly.

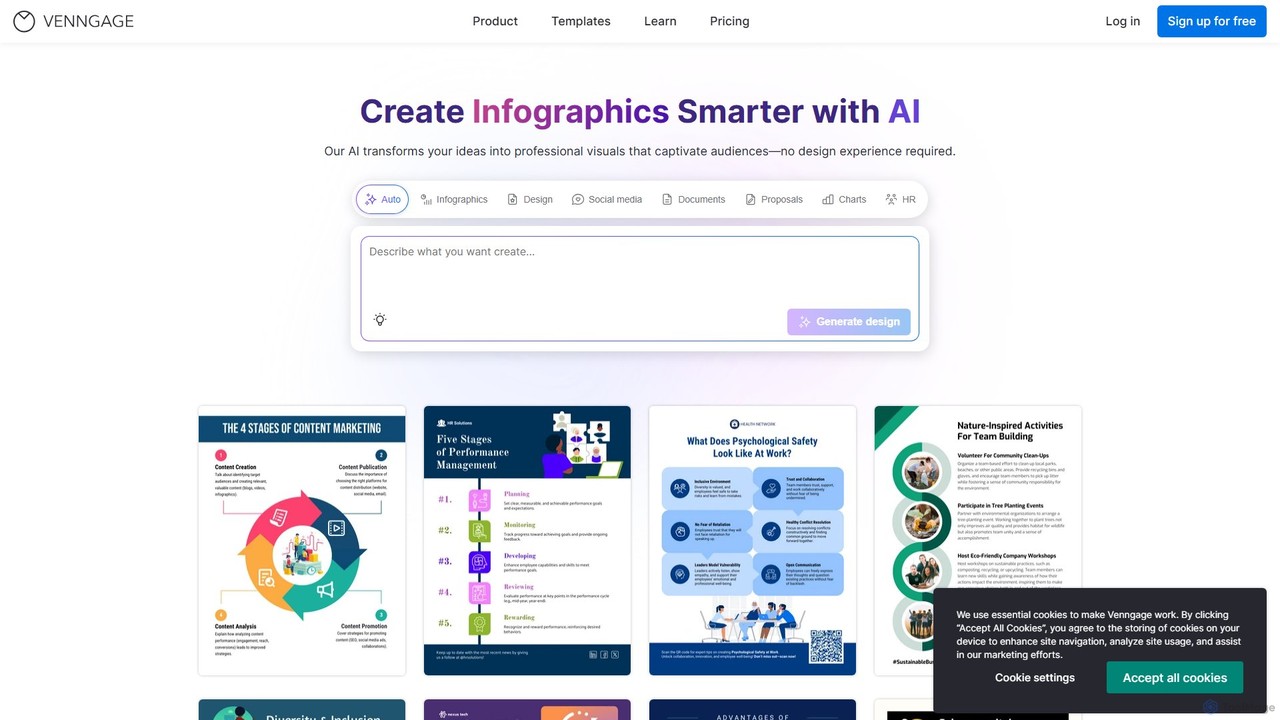
Venngage Overview
Create professional infographics, presentations, reports, and more with Venngage's AI-powered design tools. Access thousands of templates, collaborate with your team, and bring your ideas to life visually—no design experience needed.
Detailed Feature Comparison
Comprehensive comparison of the core features and characteristics of two AI tools
| Features | PageOn | Venngage |
|---|---|---|
| Main Categories | Presentations | Infographics |
| Inclusion Date | 2025-08-07 | 2025-08-14 |
| Pricing Type | Freemium | Freemium |
| Official Website | https://pageon.ai/ | https://venngage.com/ |
| Tool Type | Website | Website |
| Performance Data | ||
| User Rating | No Rating Yet | No Rating Yet |
| User Reviews | 0 reviews | 0 reviews |
| Monthly Visits | 70.7K | 1.6M |
| Details | View Details | View Details |
Compare Traffic / Monthly Visits
PageOn's traffic
PageOn Current monthly visible visits are 70.7K.
Latest Traffic
Monthly Traffic Trend
Geography
Top 5 Countries/Regions
| Country/Region | Percentage | Traffic |
|---|---|---|
|
🇺🇸
United States
|
35.40% | 25.0K |
|
🇯🇵
Japan
|
24.14% | 17.1K |
|
🇪🇸
Spain
|
16.19% | 11.5K |
|
🇮🇩
Indonesia
|
12.41% | 8.8K |
|
🇳🇬
Nigeria
|
11.86% | 8.4K |
Traffic source
| Source Type | Percentage | Traffic |
|---|---|---|
|
Direct Access
|
79.95% | 56.6K |
|
Referral
|
18.29% | 12.9K |
|
Email
|
1.76% | 1.2K |
Popular Keywords
Venngage's traffic
Venngage Current monthly visible visits are 1.6M.
Latest Traffic
Monthly Traffic Trend
Geography
Top 5 Countries/Regions
| Country/Region | Percentage | Traffic |
|---|---|---|
|
🇺🇸
United States
|
46.54% | 759.8K |
|
🇮🇳
India
|
22.72% | 370.9K |
|
🇧🇷
Brazil
|
13.18% | 215.2K |
|
🇲🇽
Mexico
|
9.97% | 162.8K |
|
🇨🇴
Colombia
|
7.59% | 123.9K |
Traffic source
| Source Type | Percentage | Traffic |
|---|---|---|
|
Direct Access
|
76.44% | 1.2M |
|
Referral
|
20.34% | 332.1K |
|
Email
|
3.22% | 52.6K |
Popular Keywords
Usage Comparison
Compare PageOn and Venngage 's Advantages
PageOn's Core Features
Venngage's Core Features
Use Cases
Understand the specific application scenarios and functional characteristics of the two AI tools
PageOn Use Cases
Venngage Use Cases
PageOn vs Venngage:In-depth Comparison Analysis and Selection Recommendations
Comprehensive comparison and evaluation based on real data and user feedback
Market Performance and User Preference Analysis
- Core positioning: PageOn leans more toward Presentations, while Venngage leans more toward Infographics.
- Traffic Signal: Venngage currently has higher monthly traffic, serving as a reference for market attention.
- Neither tool has reviewed ratings yet; it is recommended to prioritize comparing functional positioning, price, and actual trial experience.
Venngage has about 1.6M monthly visits, higher than PageOn at 70.7K. Use this as a signal of market attention, not as product quality by itself.
In-depth Analysis of User Engagement
Both tools have third-party traffic analysis records, allowing comparison of visits, dwell time, pages per visit, and bounce rate; these metrics should be considered alongside the tool's purpose.
User Reviews vs. Community Feedback
PageOn has no reviewed ratings yet. Venngage has no reviewed ratings yet.
Product Positioning and Application Scenario Analysis
PageOn is in Presentations with a Freemium pricing model; Venngage is in Infographics with a Freemium pricing model. Prioritize fit for your specific tasks rather than traffic or default ratings alone.
Frequently Asked Questions
FAQs about these two tools to help you better understand their features and differences
What are the biggest differences between the two?
PageOn is primarily positioned in Presentations, while Venngage is primarily positioned in Infographics. Which one suits you depends on which type of use case and workflow you need more.
Which tool is better to try first?
Venngage currently has higher market attention, making it suitable for initial understanding; the final decision should still be based on specific functional needs after trial.
How should ratings and traffic data be interpreted?
Ratings only count reviewed user comments; no default 5-star rating is given when there are no comments. Traffic is used to gauge market attention but cannot solely represent product quality.
Related Tool Recommendations
Discover more excellent AI tools of the same kind
Reasoning
A structured reasoning platform designed to stop AI assistants from blindly agreeing with you. It provides isolated sessions …
A structured reasoning platform designed to stop AI assistants from blindly agreeing with you. It provides isolated sessions with tools that challenge assumptions, break decision loops, and force structured thinking before implementation.
v0
v0 is an AI agent by Vercel that helps anyone create real code, full-stack apps, and intelligent agents …
v0 is an AI agent by Vercel that helps anyone create real code, full-stack apps, and intelligent agents from natural language prompts, enabling rapid prototyping and deployment.
TraceUI
An open-source framework that gives AI agents the full design context of any website, enabling brand-consistent ad generation …
An open-source framework that gives AI agents the full design context of any website, enabling brand-consistent ad generation and mockup creation.
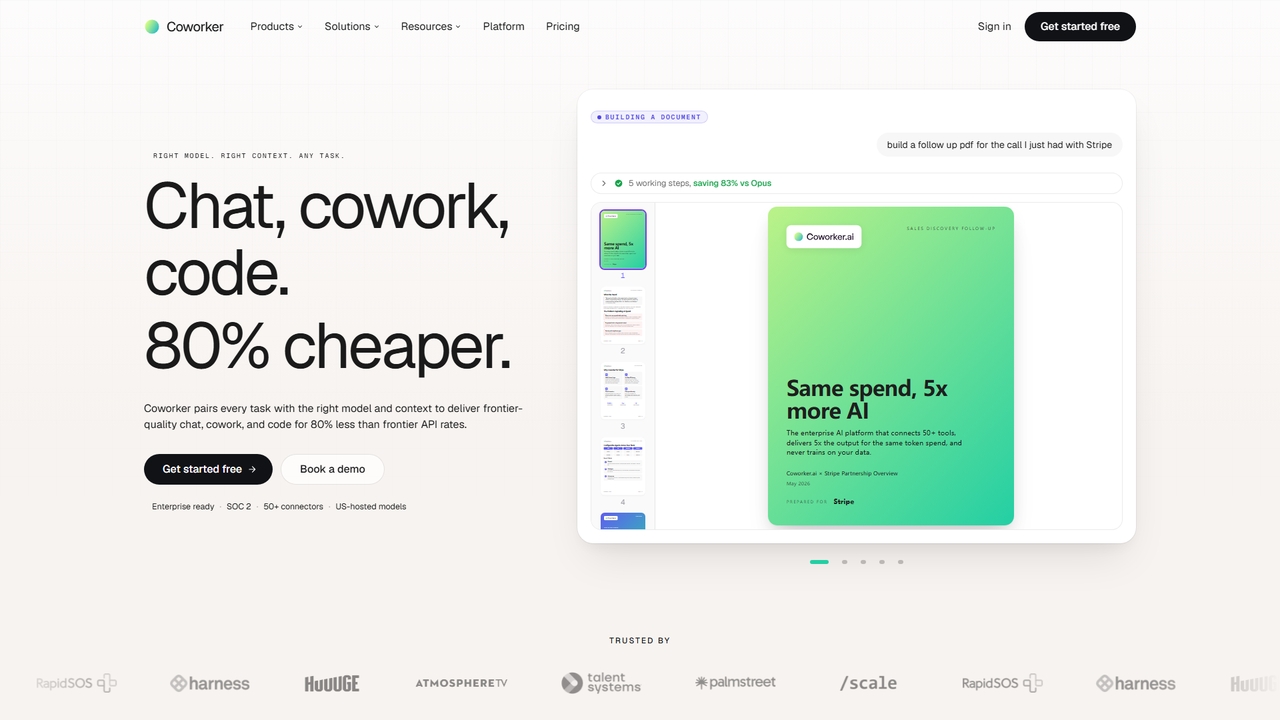
Coworker
An enterprise AI platform that connects 50+ tools, delivers 5x output for the same token spend, and never …
An enterprise AI platform that connects 50+ tools, delivers 5x output for the same token spend, and never trains on your data for secure, cost-effective automation.
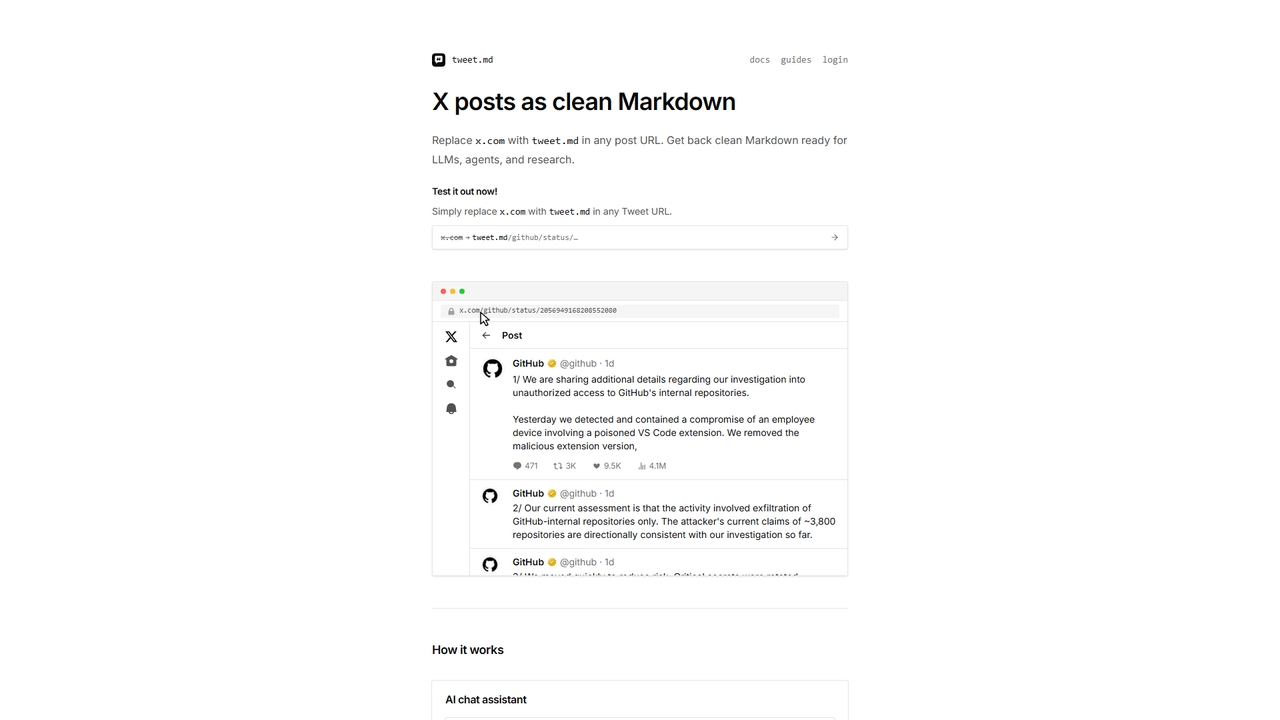
Tweet
Tweet converts X (Twitter) posts and threads into clean, LLM-ready Markdown format. Simply swap 'x.com' with 'tweet.md' in …
Tweet converts X (Twitter) posts and threads into clean, LLM-ready Markdown format. Simply swap 'x.com' with 'tweet.md' in any post URL to get structured text optimized for AI agents, research, and note-taking tools.
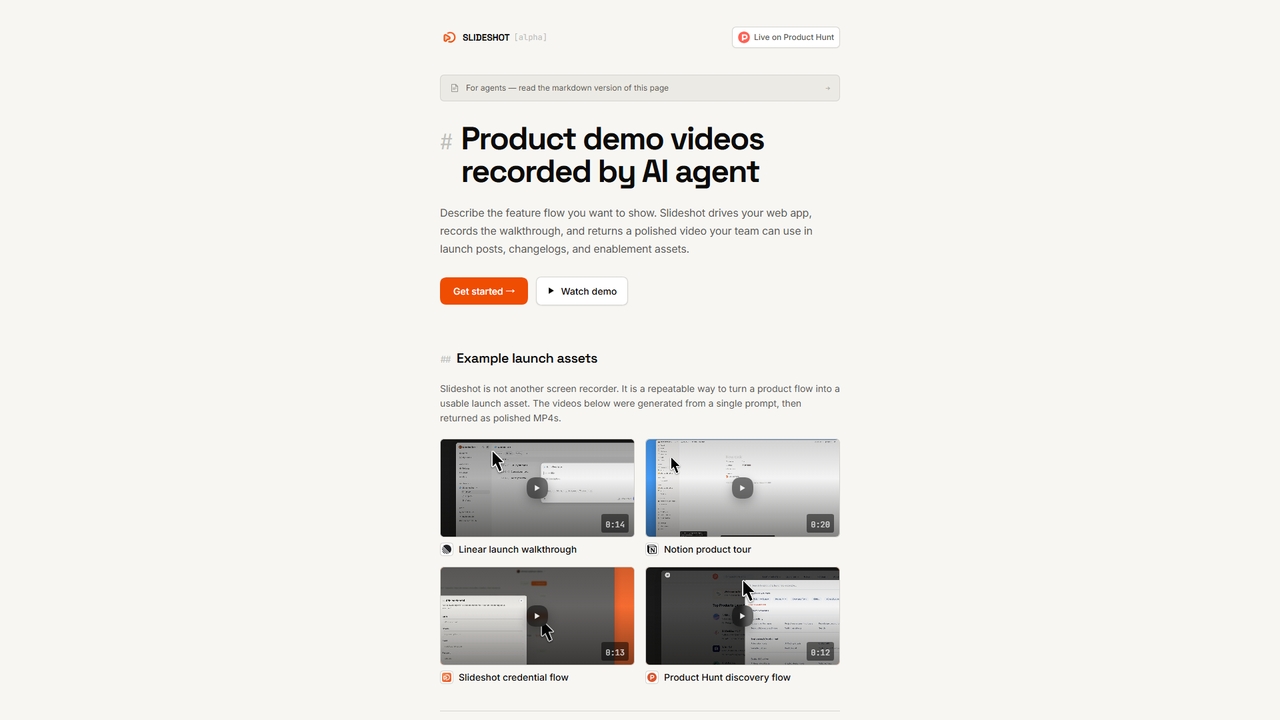
Slideshot
Slideshot is an AI agent that generates polished product demo videos. Describe a feature flow, and it automatically …
Slideshot is an AI agent that generates polished product demo videos. Describe a feature flow, and it automatically drives your web app, records the walkthrough, and returns a ready-to-use MP4 for launches, changelogs, and docs.
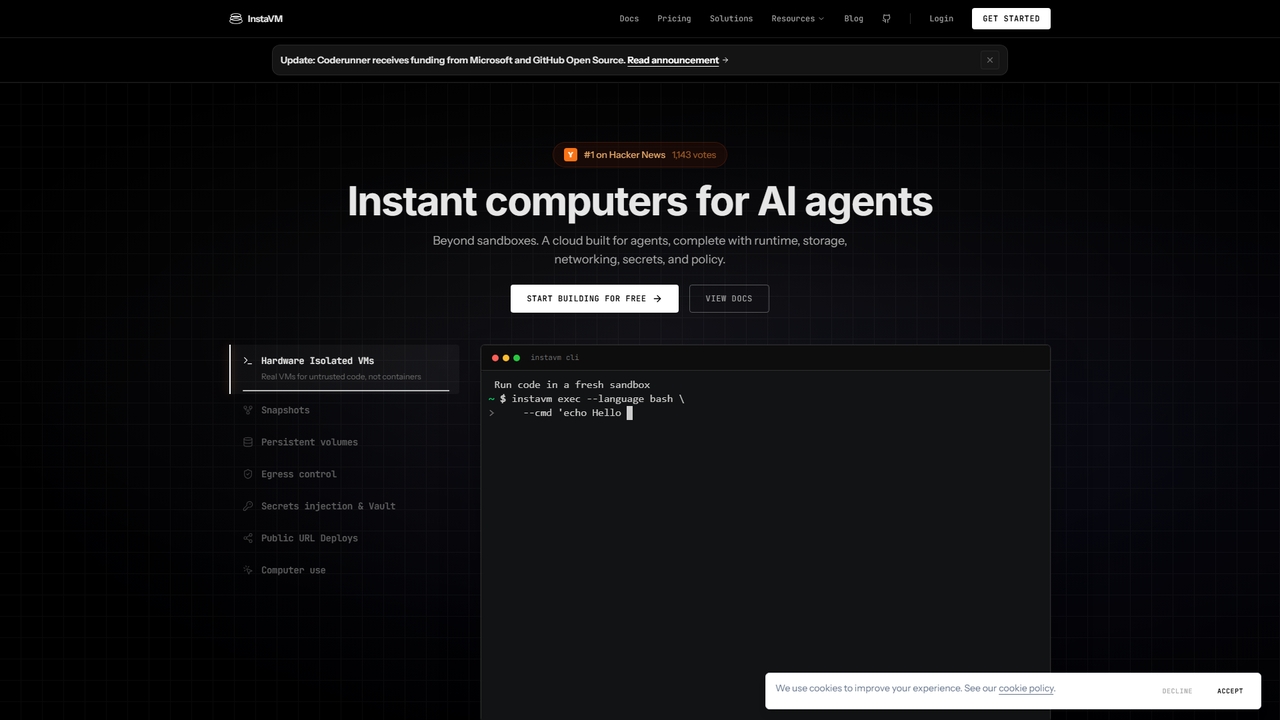
InstaVM
InstaVM is a production-grade sandbox built for AI agents, offering hardware-isolated virtual machines with persistent state, secure networking, …
InstaVM is a production-grade sandbox built for AI agents, offering hardware-isolated virtual machines with persistent state, secure networking, and secret management. It provides a complete Linux environment for safely executing untrusted code from agents, with sub-200ms cold starts and seamless deployment.
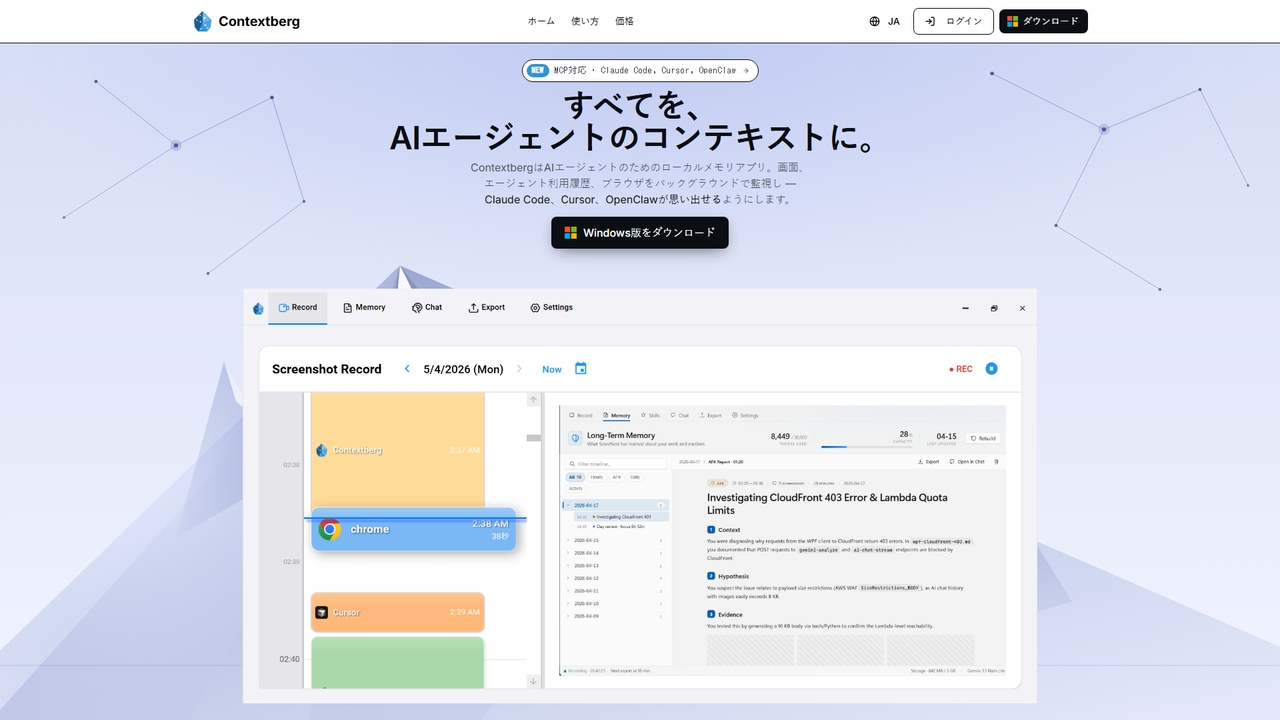
Contextberg
A local-first memory application for AI agents. It monitors screen activity, inputs, and browser usage in the background …
A local-first memory application for AI agents. It monitors screen activity, inputs, and browser usage in the background to provide context via MCP to coding agents like Claude Code, Cursor, and OpenClaw, enhancing productivity by eliminating repetitive re-entry.
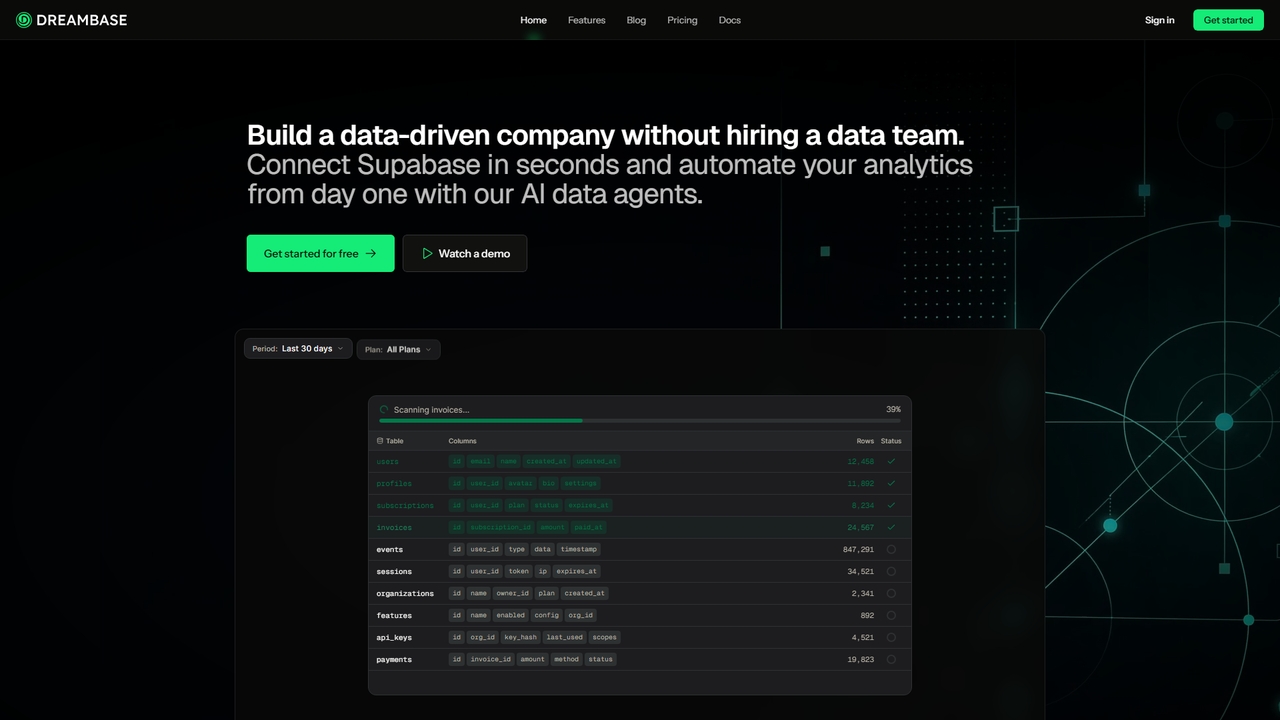
Dreambase
An AI-native analytics platform that connects directly to your Supabase database, providing instant dashboards, reports, and actionable insights …
An AI-native analytics platform that connects directly to your Supabase database, providing instant dashboards, reports, and actionable insights with minimal setup.
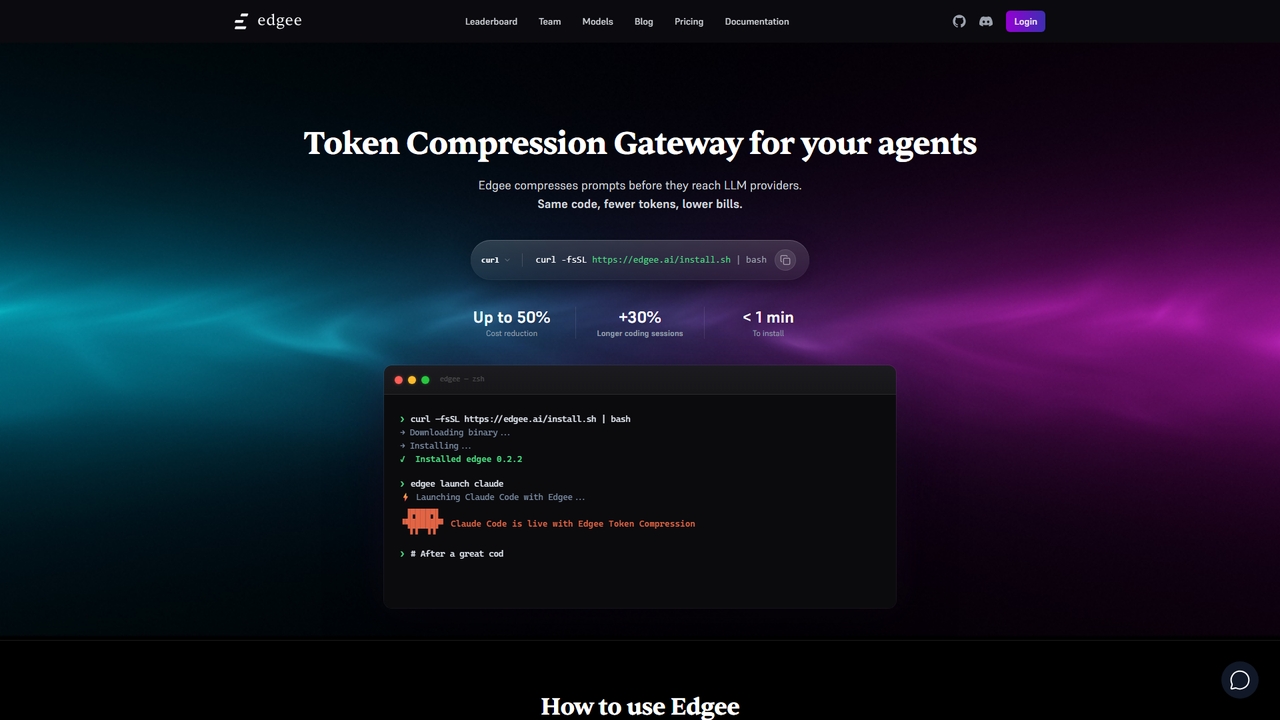
Edgee
Edgee is a token compression gateway that reduces LLM prompt costs by up to 50%. Works transparently with …
Edgee is a token compression gateway that reduces LLM prompt costs by up to 50%. Works transparently with coding agents like Claude, Codex, and Cursor.
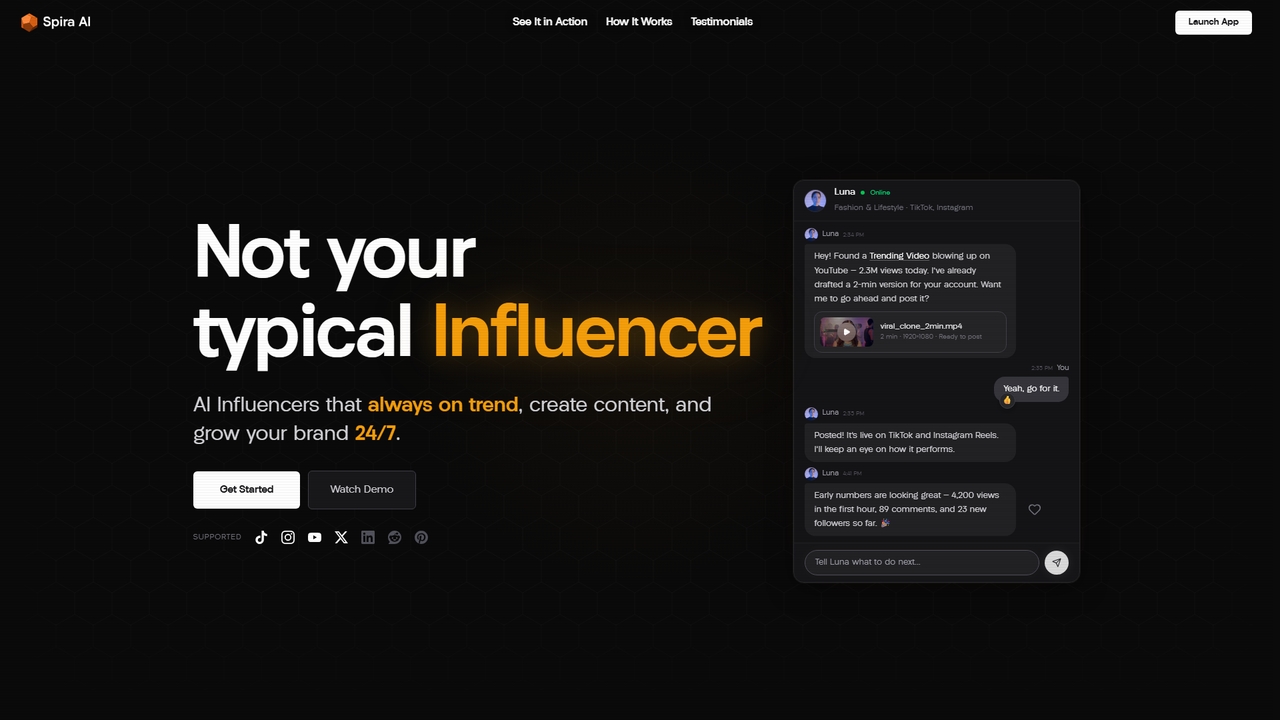
Spira
Spira is an AI Influencer Agent that autonomously creates, publishes, and optimizes social media content across TikTok, Instagram, …
Spira is an AI Influencer Agent that autonomously creates, publishes, and optimizes social media content across TikTok, Instagram, YouTube, and X to grow your brand 24/7.
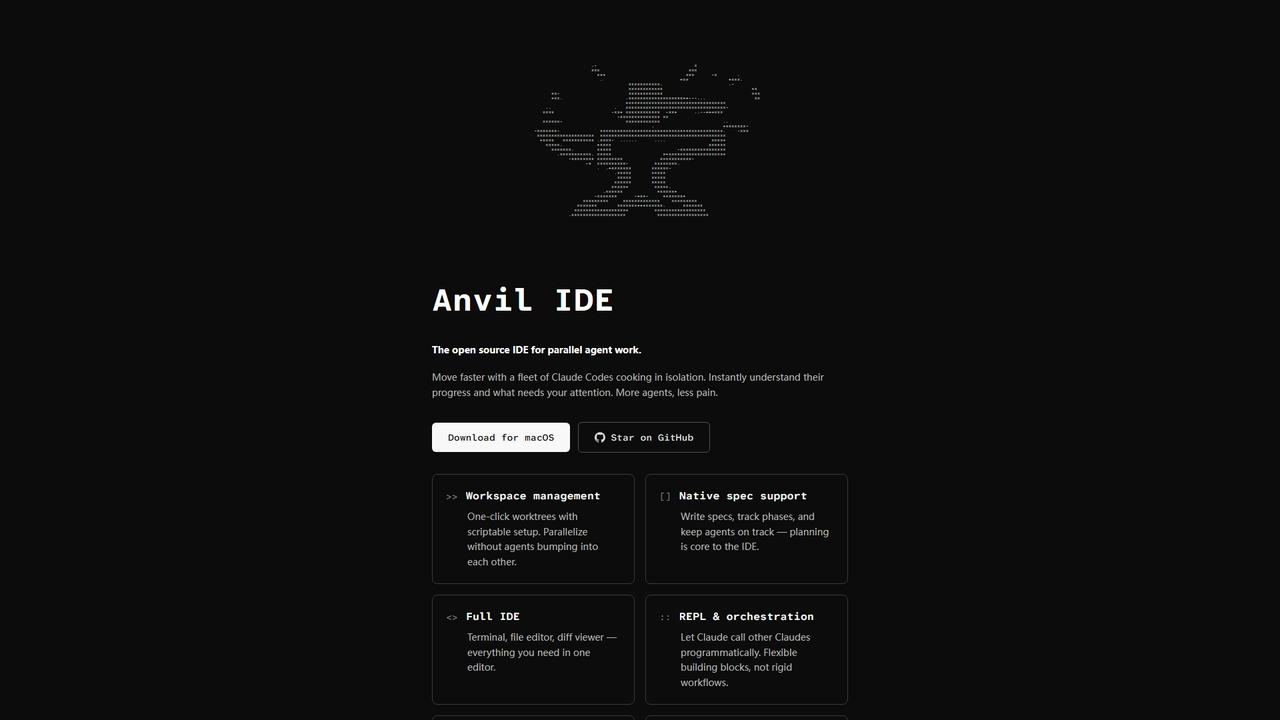
Anvil IDE
Anvil IDE is an open-source integrated development environment specifically designed for orchestrating and managing parallel AI agent workflows. …
Anvil IDE is an open-source integrated development environment specifically designed for orchestrating and managing parallel AI agent workflows. It centralizes control over multiple Claude Code agents working in isolated workspaces, providing real-time progress visibility, native planning tools, and a full-featured editor to accelerate complex AI-assisted development tasks.
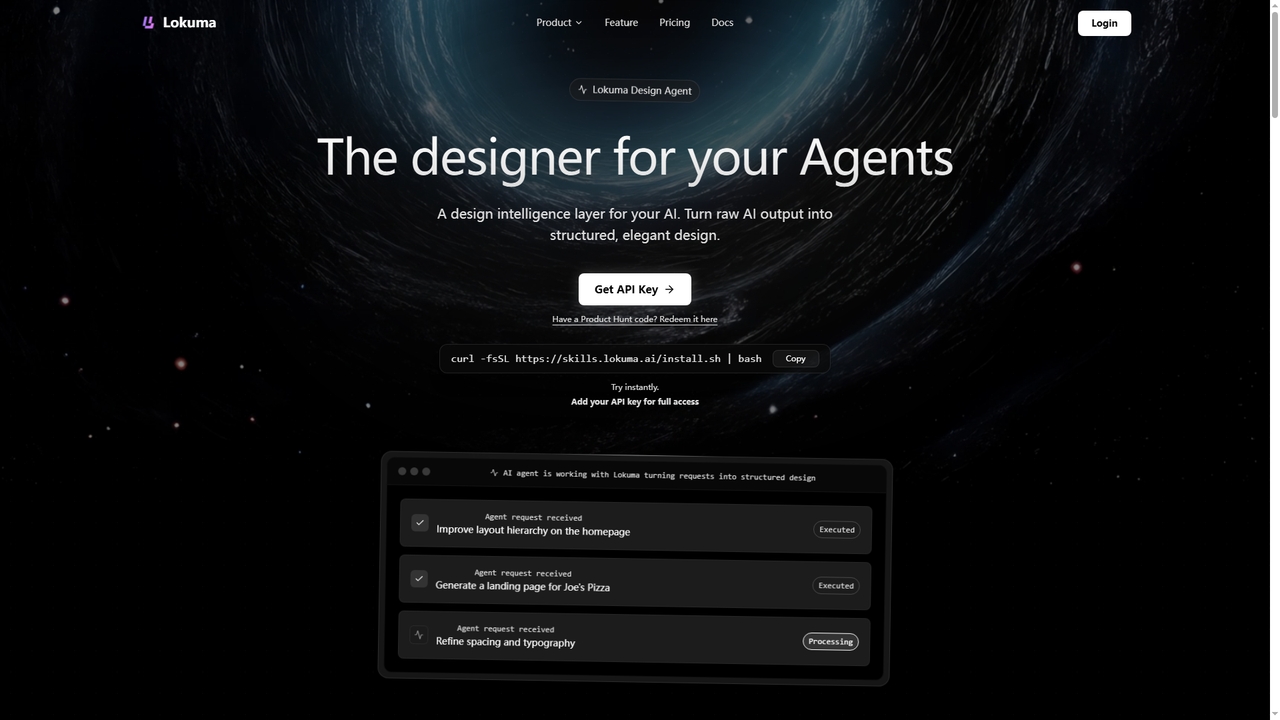
Lokuma Designer Agent
Lokuma Designer Agent is an AI-powered design intelligence layer that transforms raw, unstructured output from coding AI agents …
Lokuma Designer Agent is an AI-powered design intelligence layer that transforms raw, unstructured output from coding AI agents (like Cursor, Claude Code) into professionally structured and visually balanced designs. It acts as a built-in designer for your AI, automating layout composition, typography refinement, and visual consistency for web pages and digital interfaces.
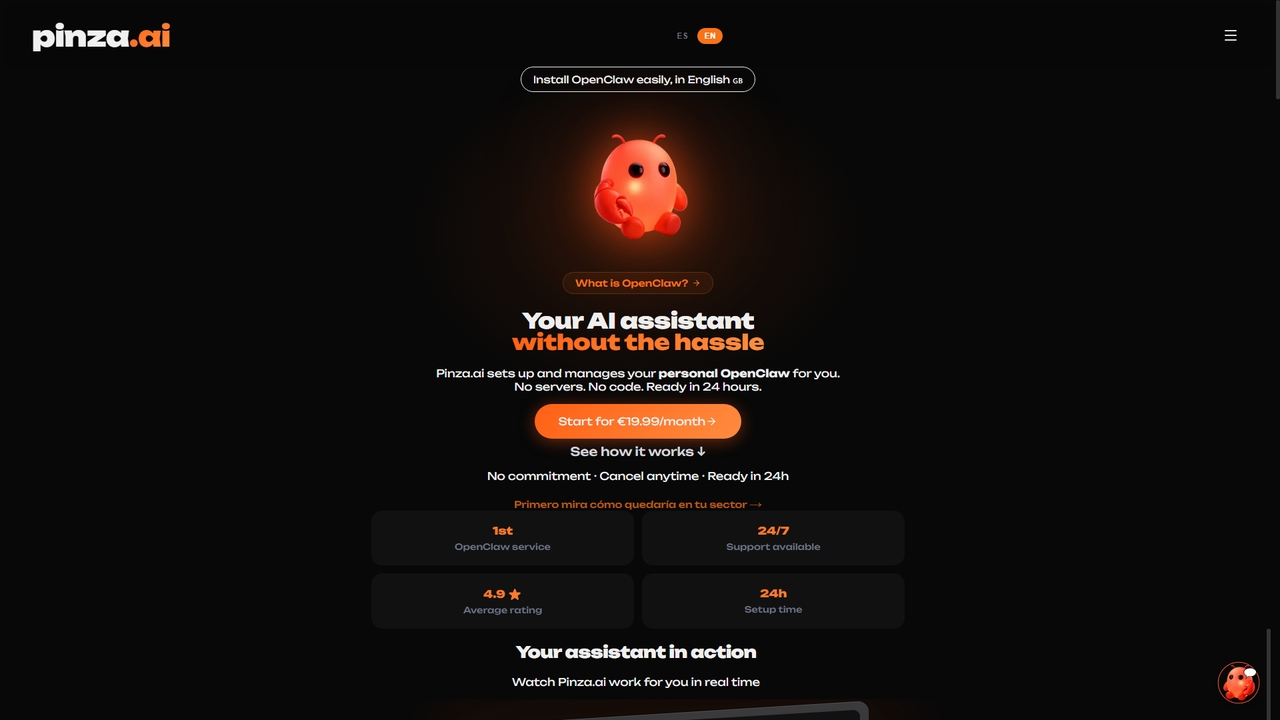
Pinza
Pinza is a managed service that sets up and hosts a personal OpenClaw AI assistant for you within …
Pinza is a managed service that sets up and hosts a personal OpenClaw AI assistant for you within 24 hours, without requiring any technical knowledge or server management. It connects to your tools (like email and calendar) to automate tasks such as meeting scheduling, email summarization, and lead management, allowing freelancers and small businesses to leverage advanced AI effortlessly.
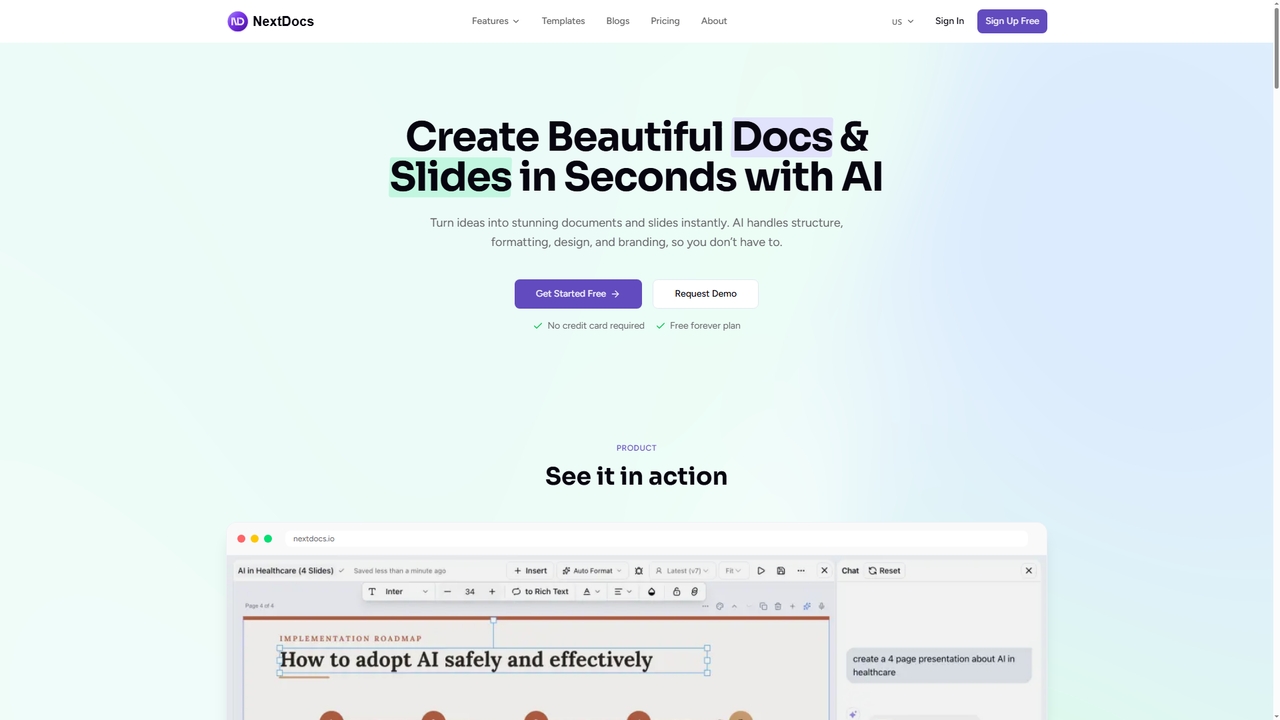
NextDocs
NextDocs is an AI-powered document and presentation generator that transforms ideas into polished documents and slides in seconds. …
NextDocs is an AI-powered document and presentation generator that transforms ideas into polished documents and slides in seconds. It handles structure, formatting, and design automatically, supports multiple formats from a single prompt, and offers flexible editing and export options to fit any workflow.