
Scoop Analytics Overview
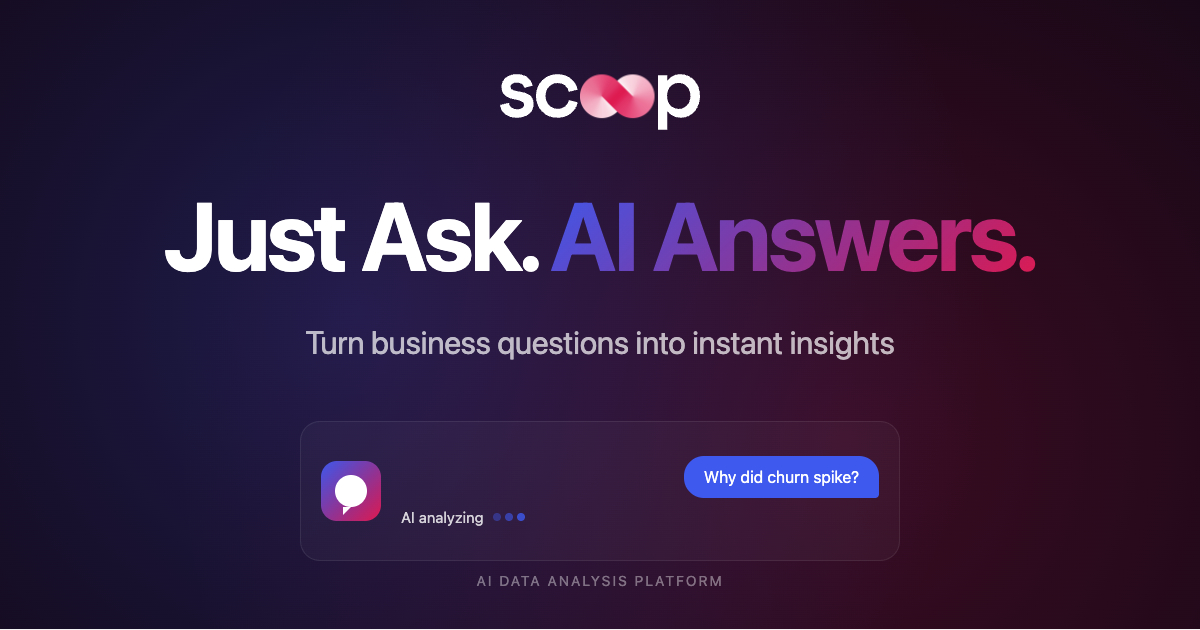
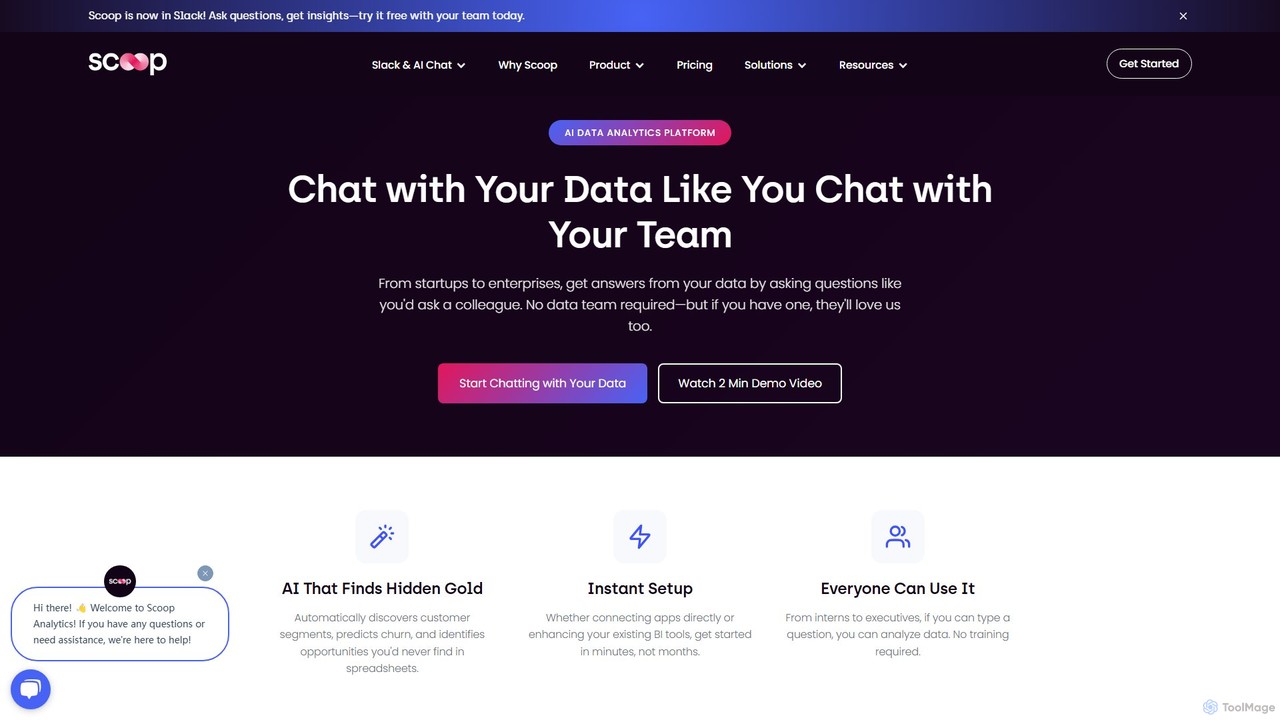
Scoop Analytics is a revolutionary AI data analytics platform designed to empower business teams by making data accessible and actionable for everyone, regardless of their technical expertise. It was built to solve the common problem of business intelligence (BI) tools being a bottleneck, requiring specialized skills like SQL or reliance on overloaded data teams. Scoop transforms this dynamic by allowing any user, from an intern to an executive, to chat with their data as if they were talking to a colleague.
The platform enables users to ask complex questions in plain English and receive instant, data-driven answers, complete with visualizations and actionable insights. Scoop's AI goes beyond simple reporting; it automatically discovers hidden customer segments, predicts future outcomes like customer churn with over 45 days' notice, and identifies revenue opportunities that would be nearly impossible to find in traditional spreadsheets or dashboards. This empowers teams to move from reactive to proactive decision-making.
How to use Scoop Analytics
Getting started with Scoop Analytics is designed to be fast and intuitive, taking minutes, not months. There are two primary ways to use the platform based on your existing data infrastructure:
- Direct to Data: This method is perfect for teams without a complex data warehouse. Users can directly connect their business applications (like Salesforce, HubSpot, Google Analytics) with one-click integrations, or simply upload spreadsheets (CSV, XLS). Once connected, you can immediately start asking questions in natural language.
- Enhance Your BI: For organizations that already use BI tools like PowerBI or Tableau, Scoop acts as a conversational intelligence layer on top. It connects to your existing setup to help answer the 'why' behind the data and predict 'what's next,' empowering everyone in the organization, not just the analysts who build the dashboards.
Additionally, Scoop's seamless Slack integration allows users to ask questions and receive insights directly within their communication channels, bringing analytics into the natural flow of work.
Core Features of Scoop Analytics
- Conversational AI Analysis: Ask questions in natural language to query your data. No SQL or coding is required.
- Predictive Analytics & Automatic Discovery: The AI automatically investigates patterns, predicts outcomes (e.g., deal wins, customer churn), and surfaces hidden opportunities and customer segments.
- 100+ Data Source Integrations: Connect to a wide range of sources, including CRMs (Salesforce), marketing platforms (HubSpot), support desks (Zendesk), spreadsheets, and existing BI tools (PowerBI, Tableau).
- Seamless Slack Integration: Ask questions, share insights, and receive alerts directly in your Slack workspace to facilitate collaboration and quick decision-making.
- Automated Visualizations and Reporting: Automatically generates the best charts and dashboards to represent the data. Insights can be exported into professional, one-click PowerPoint presentations.
- Workflow Automation: Schedule reports, automate data refreshes, and set up triggered alerts to keep your team informed without manual effort.
- Enterprise-Grade Security: SOC 2 certified with role-based access controls and complete audit trails to ensure your data remains secure and compliant.
Use Cases for Scoop Analytics
Scoop provides tailored solutions for various business functions:
- For Marketing Teams: Discover hidden high-value customer segments, understand campaign performance, optimize ad spend, and reduce customer acquisition costs (CAC). Answer questions like, "Which segments drive 80% of our revenue?" or "Why did conversions drop last month?"
- For Sales Teams: Turn sales data into a competitive advantage. Predict deal outcomes with high accuracy (85%+), identify winning sales patterns to scale across the team, and shorten sales cycles. Answer questions like, "Which deals need my attention today?" or "What patterns predict a win?"
- For Customer Success Teams: Proactively manage customer health by predicting churn over 45 days in advance. Identify expansion opportunities and prioritize at-risk accounts. Answer questions like, "Which accounts are at risk of churning?" or "Who is ready for an upgrade?"
Advantages of Scoop Analytics
Scoop Analytics offers a significant competitive edge by being fast, flexible, and built for business users. Key advantages include:
- Democratization of Data: Empowers non-technical users to perform complex data analysis, reducing dependency on IT and data analyst teams.
- Speed to Insight: Delivers answers in minutes, eliminating the long waits associated with traditional report requests.
- Actionable & Predictive Insights: Moves beyond historical data to provide forward-looking predictions and clear, actionable recommendations.
- Seamless Integration: Fits into your existing workflow through Slack and connections with tools you already use.
- True Self-Service: An intuitive interface that requires no special training. If you can ask a question, you can use Scoop.
Pricing and Plans
Scoop Analytics offers a transparent pricing model that scales with value, not complexity. All plans include the full platform features.
- Free Trial: A one-month free trial is available to test the platform.
- Individual Plan: $99 per seat/month (billed annually). Includes a single user license, unlimited viewers, and connection to two data sources.
- Team Plan: $149 per seat/month (billed annually). Designed for 2+ users, it includes unlimited viewers, connection to five data sources, and enhanced collaboration features.
- Enterprise Plan: Custom pricing. Offers unlimited users, viewers, and data sources, along with dedicated onboarding and premium support (AI, Email & Phone).
All tiers include spreadsheet uploads, custom branding, access to all chart formats, and standard connectors.
Traffic
Latest traffic
Status
Monthly traffic trend
- 2025-9: 7.8K
- 2026-1: 11.7K
- 2026-2: 9.5K
- 2026-3: 7.2K
- 2026-4: 5.6K
- 2026-5: 3.8K
Geography
Top 5 countries / regions
- 🇺🇸United States52.3%
- 🇮🇳India33.8%
- 🇬🇧United Kingdom13.9%
Top keywords
| Keyword | Cost per click |
|---|---|
| google sheets snapshot | $0.00 |
| maggie sin | $0.00 |
| scoop | $0.73 |
| scoop analytics | $0.00 |
| scoop data visualization | $0.00 |
Scoop Analytics Alternatives
Supaboard
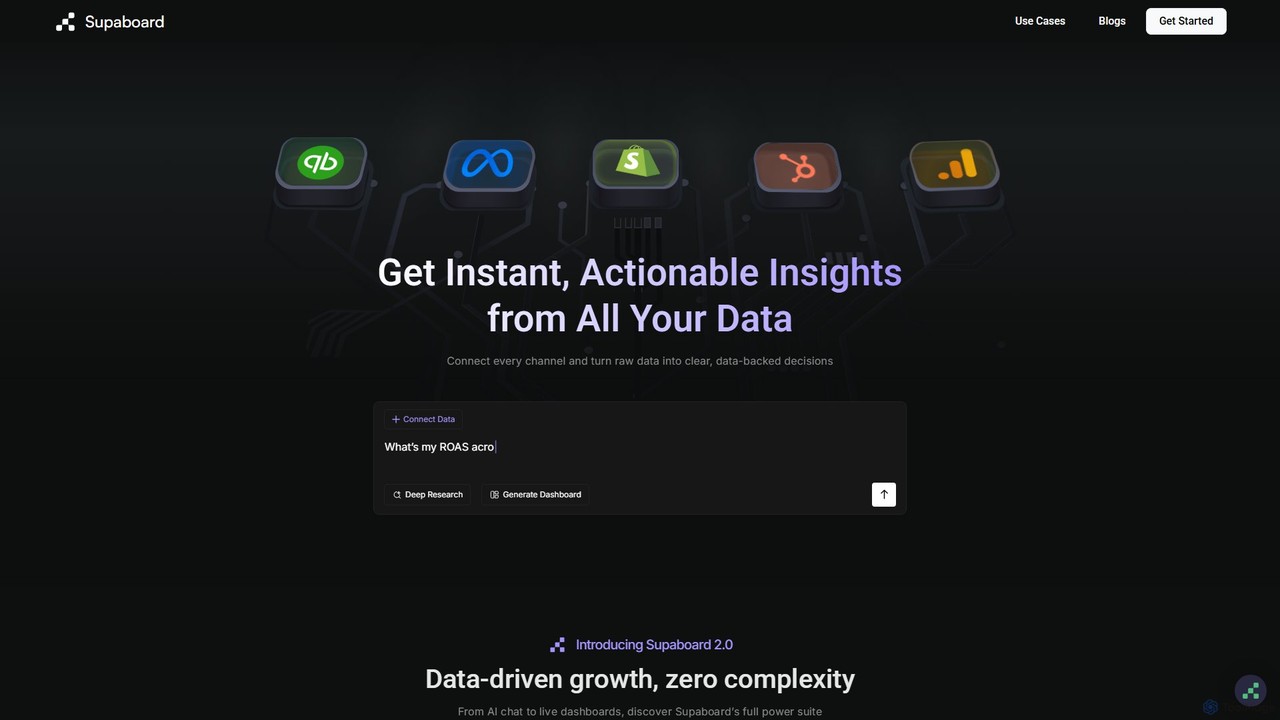
Supaboard is an AI-powered business intelligence platform that connects all your data sources into a unified hub. It transforms raw data into actionable insights and live dashboards, allowing teams to make data-backed decisions quickly without needing to write code or wrangle spreadsheets.
Business Intelligence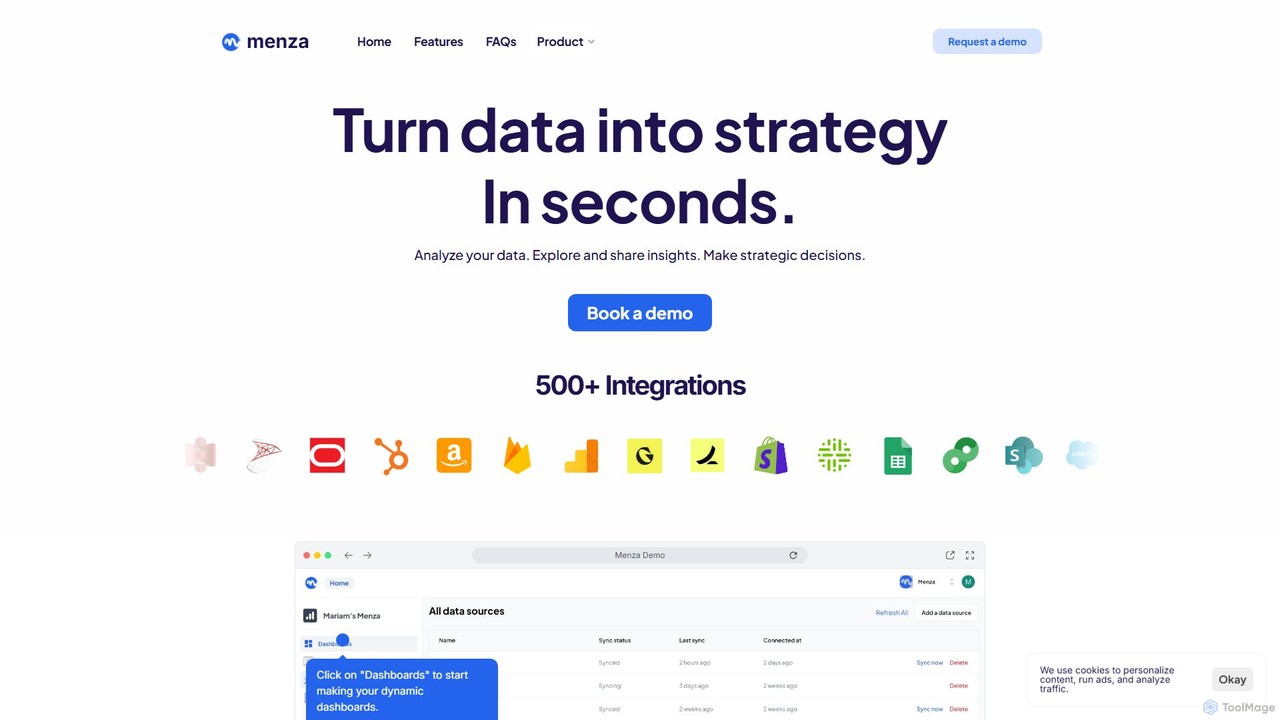
menza
menza is an AI-powered data analysis platform that transforms business data into actionable strategic insights in seconds. It allows non-technical users to analyze data, build interactive dashboards, and collaborate on decisions using plain language and a simple interface.
Business Intelligence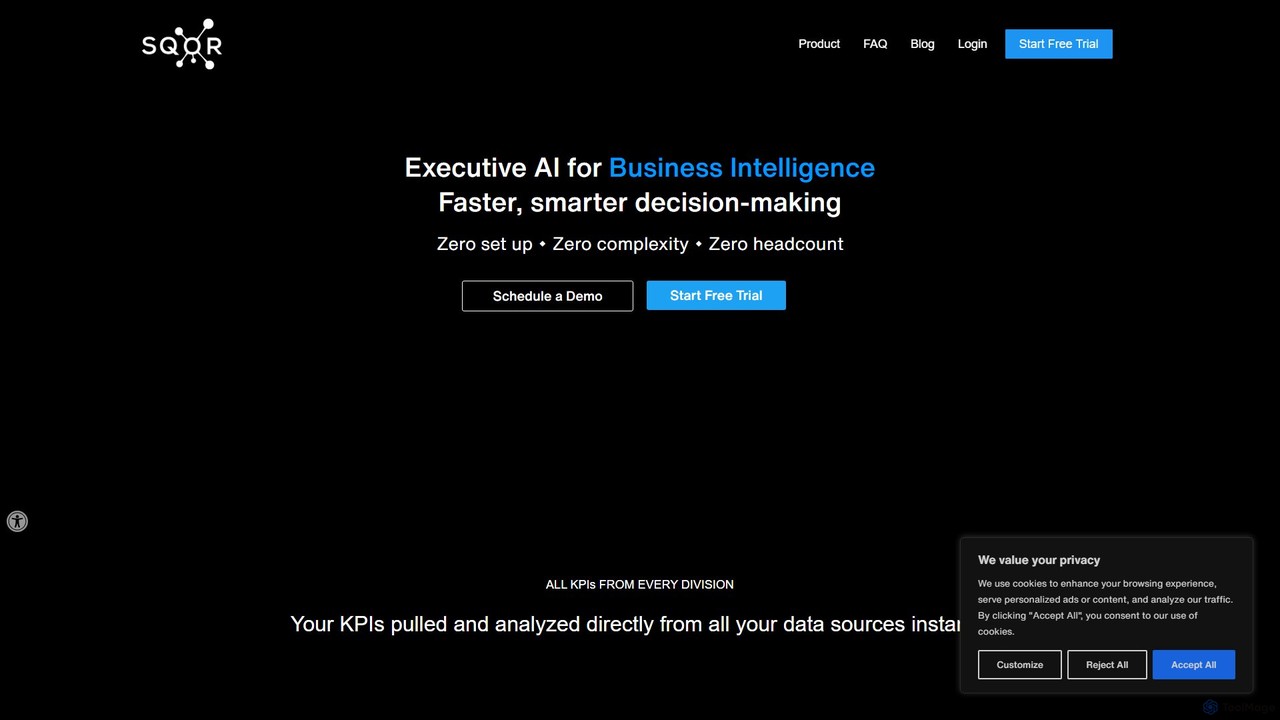
sqor.ai
sqor.ai is a no-code, AI-powered business intelligence platform that automates KPI tracking and prediction. It integrates with your SaaS tools to centralize data, provide real-time dashboards, and generate actionable insights, enabling smarter, data-driven decisions without a dedicated data team.
Business Intelligence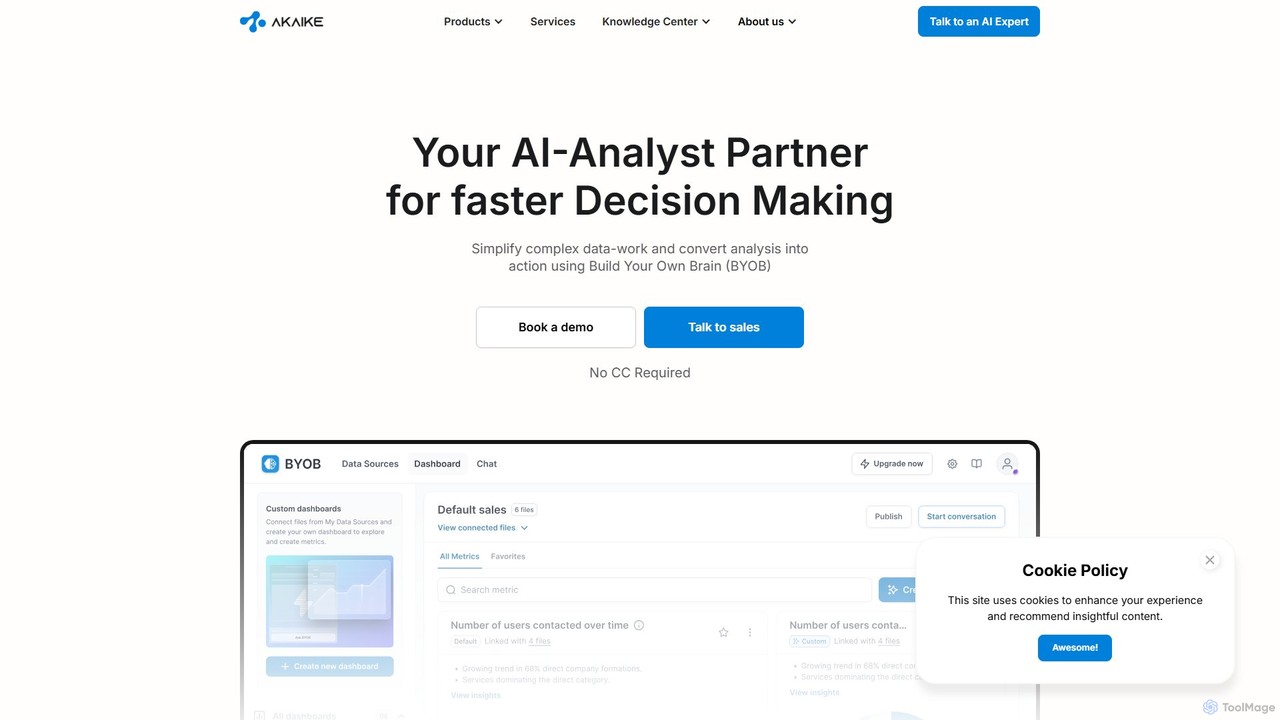
BYOB
BYOB (Build Your Own Brain) by Akaike is an enterprise-grade AI analyst platform that transforms complex data into actionable insights. It connects to multiple data sources, both structured and unstructured, allowing teams to make faster, data-driven decisions through a conversational chat interface. BYOB provides proactive analytics and seamlessly integrates into existing workflows, empowering departments like finance, marketing, and sales without needing to expand the data team.
Business Intelligence
Quills
Quills is an AI-powered business intelligence assistant that enables users to interact with their data through natural language. It connects to databases and files (CSV, Excel, PDF), automatically generates SQL queries from plain English questions, creates insightful visualizations, and integrates seamlessly with platforms like Slack to accelerate data-driven decision-making for teams.
Business IntelligenceScoop Analytics Categories
Scoop Analytics Embed Widget
Copy this embed code to place the badge on your blog, article, or product site and send readers directly to this ToolMage detail page.

Related AI tools
Narrative BI
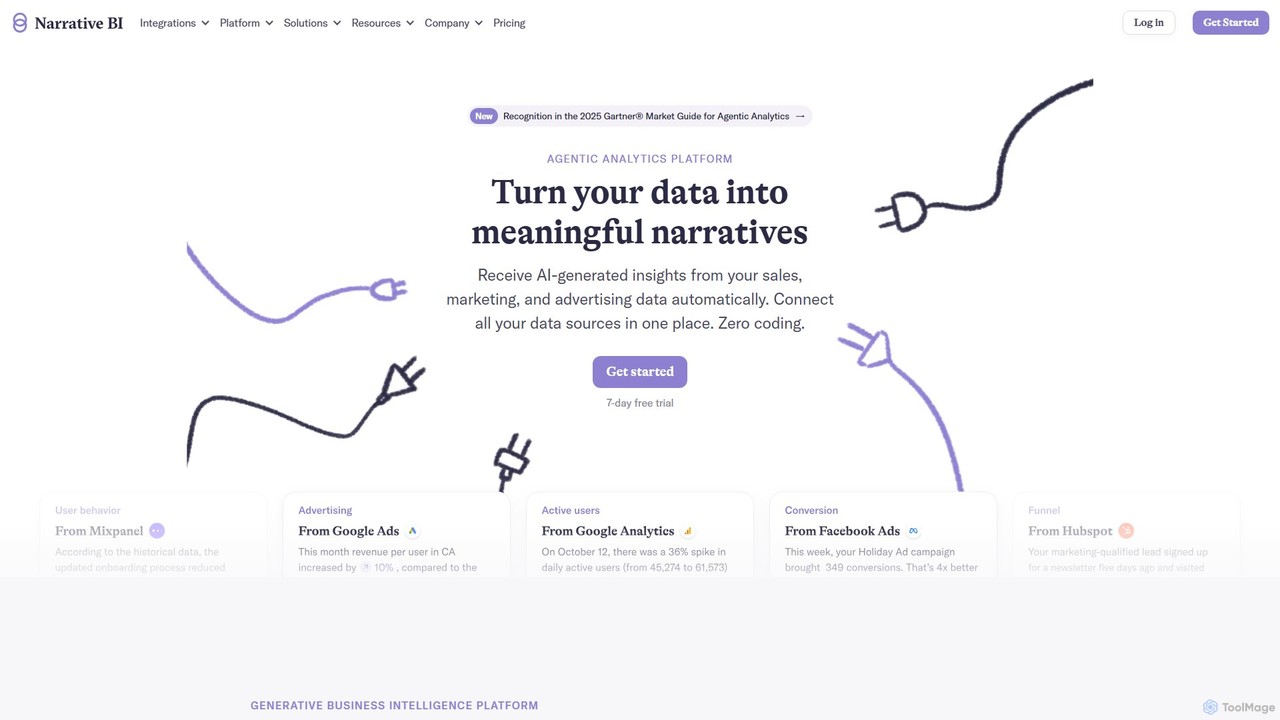
Narrative BI is an AI-powered business intelligence platform that automates data analysis. It connects to various data sources like Google Analytics and Facebook Ads, transforming complex data into easy-to-understand narrative reports and actionable insights. It's designed for teams to make faster, data-driven decisions without needing technical expertise.
Business Intelligence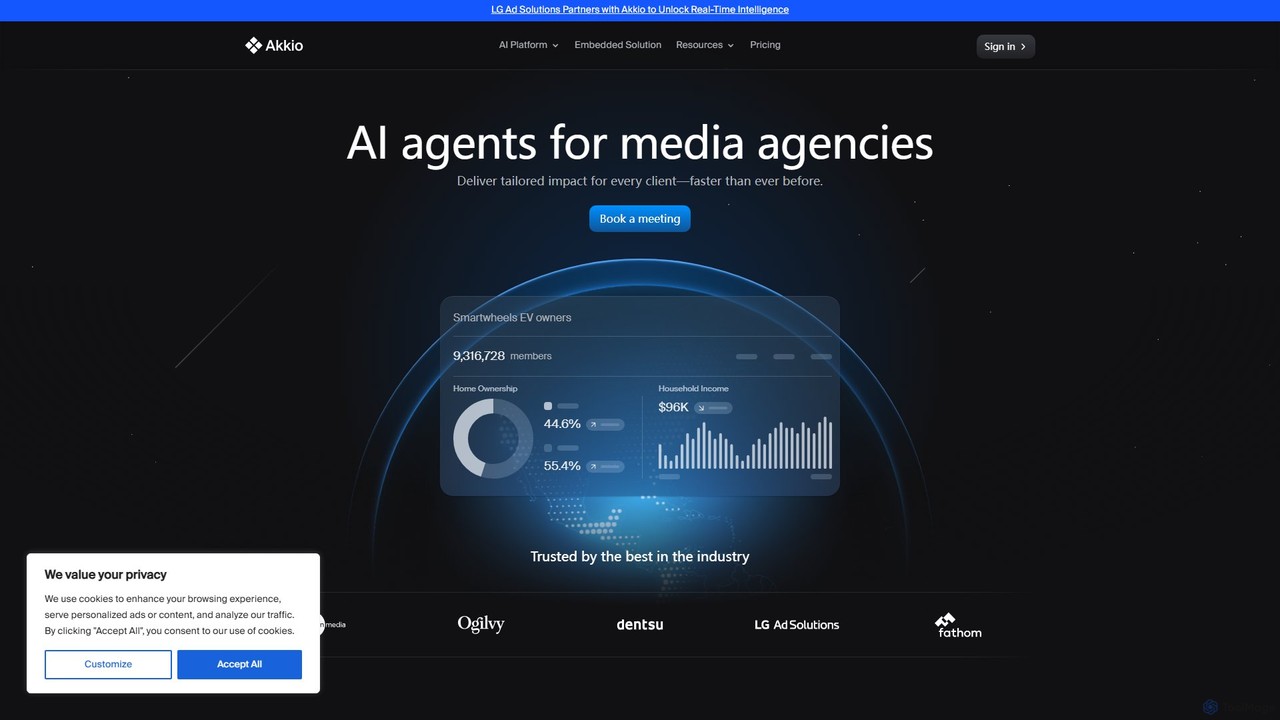
Akkio
Akkio is a no-code AI platform for generative business intelligence and predictive analytics. It empowers users, especially in media and marketing agencies, to connect data, build machine learning models, and generate insights through natural language chat, without needing data science expertise.
Business Intelligence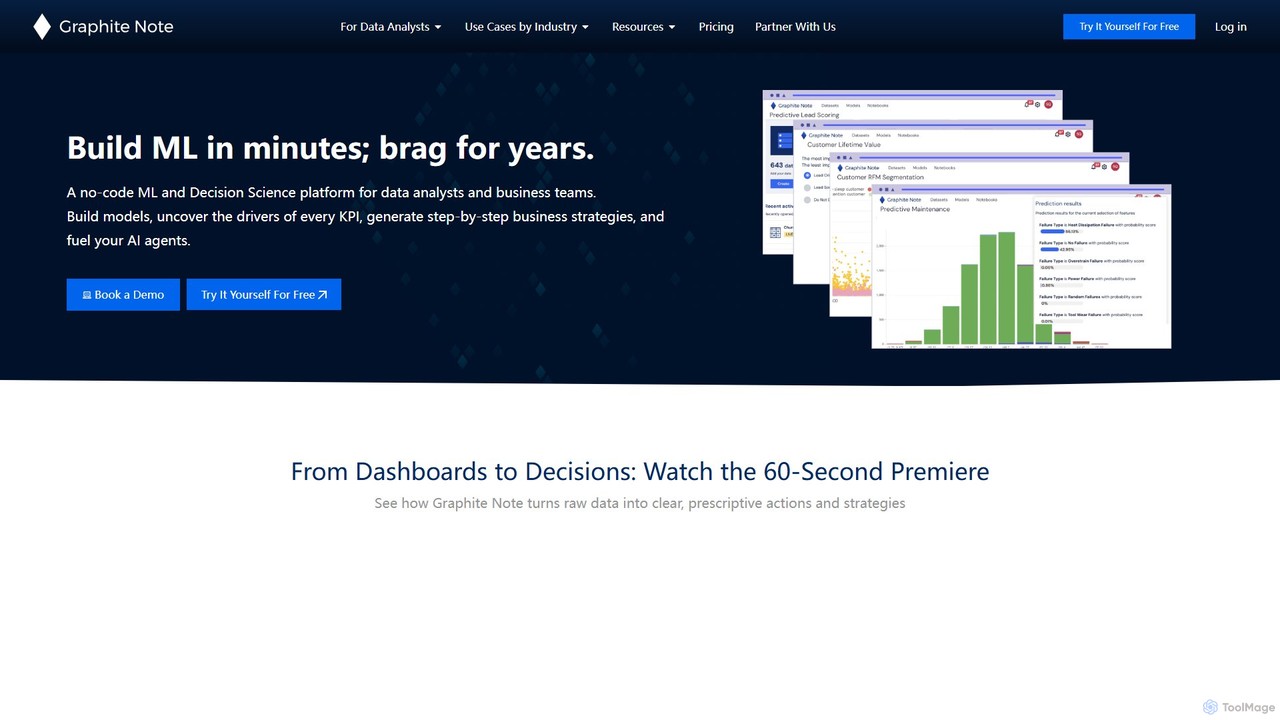
Graphite Note
Graphite Note is a no-code AI platform designed for data analysts and business users to build, deploy, and manage predictive analytics models. It simplifies machine learning, enabling users to gain actionable insights from their data, optimize marketing campaigns, and make data-driven decisions without any coding expertise. The platform supports various data sources and automates model selection to deliver fast and accurate results.
Business Intelligence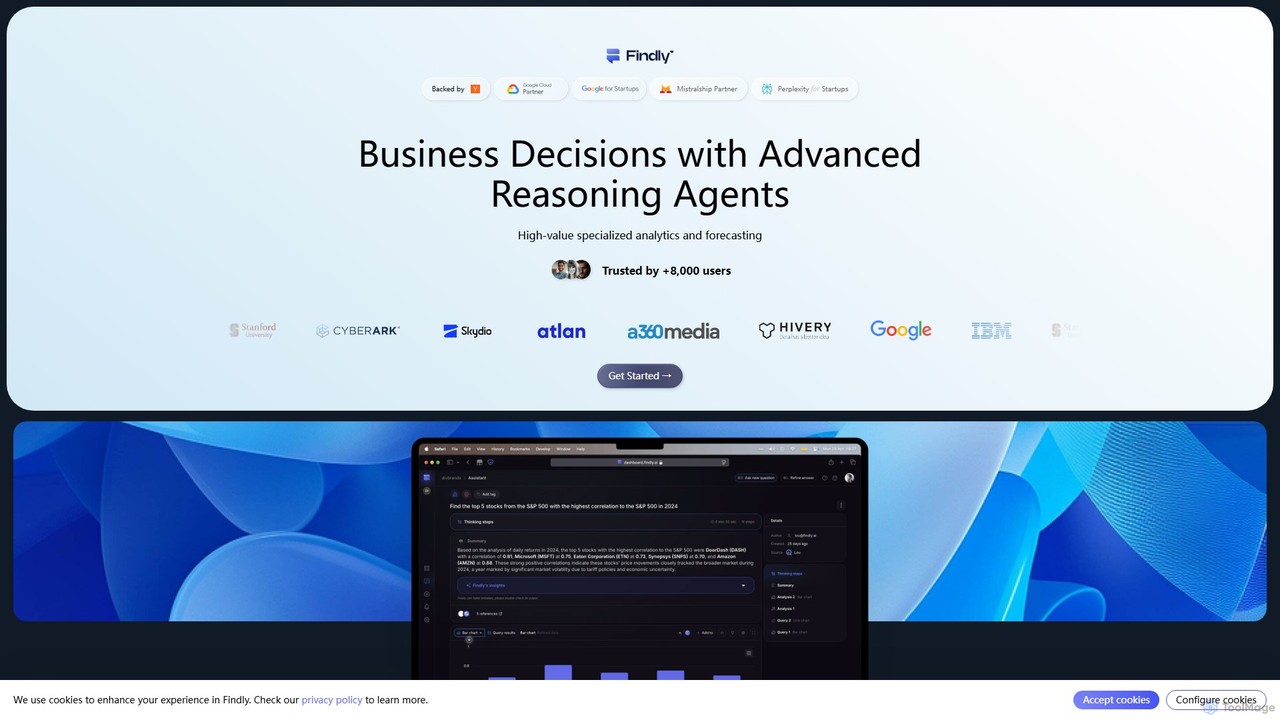
Findly
Findly is an AI-powered business intelligence (BI) platform that allows users to analyze data and get insights using natural language. It connects to various data sources, translates plain English questions into complex SQL queries, and provides interactive visualizations and reports. Designed for both technical and non-technical users, Findly simplifies data analysis, making it faster and more accessible for entire teams.
Business Intelligence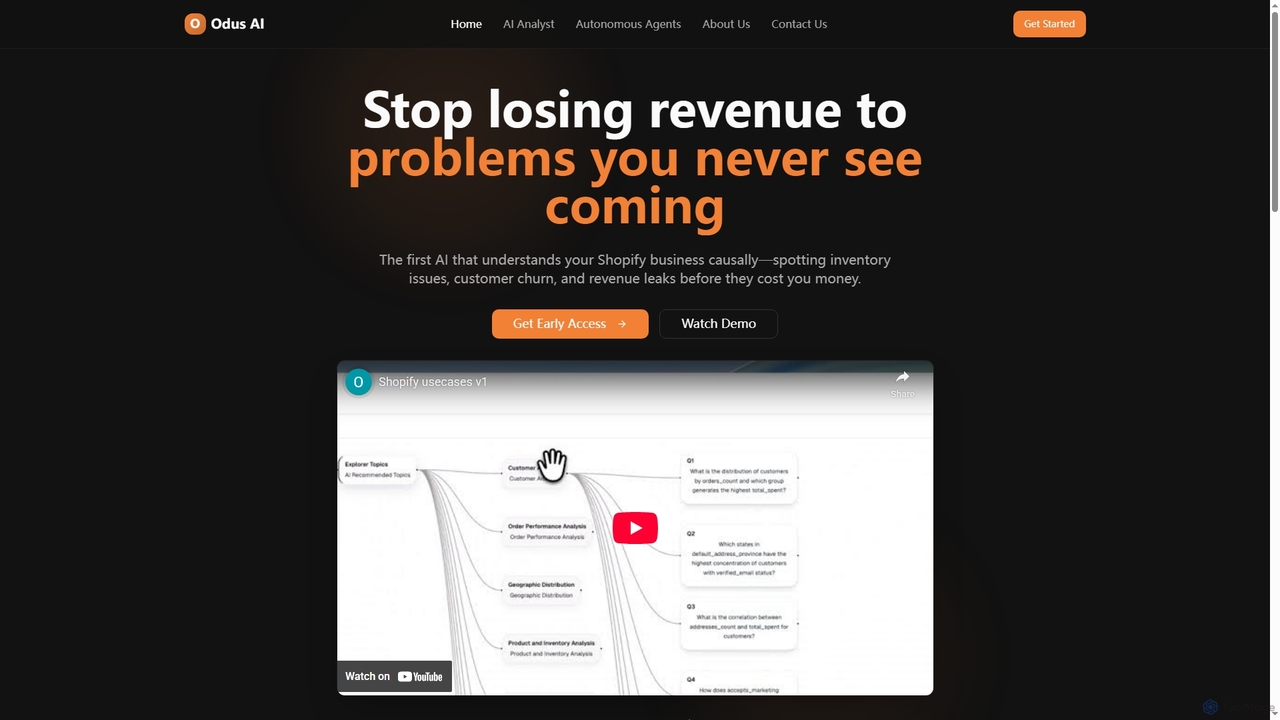
Odus
Odus is an advanced AI platform for Shopify merchants, offering an AI Analyst for instant, natural language insights and Autonomous Agents that proactively protect revenue by detecting issues like inventory problems, customer churn, and revenue leaks 24/7.
RetentionSupaboard
Supaboard is an AI-powered business intelligence platform that connects all your data sources into a unified hub. It transforms raw data into actionable insights and live dashboards, allowing teams to make data-backed decisions quickly without needing to write code or wrangle spreadsheets.
Business Intelligencemenza
menza is an AI-powered data analysis platform that transforms business data into actionable strategic insights in seconds. It allows non-technical users to analyze data, build interactive dashboards, and collaborate on decisions using plain language and a simple interface.
Business Intelligencesqor.ai
sqor.ai is a no-code, AI-powered business intelligence platform that automates KPI tracking and prediction. It integrates with your SaaS tools to centralize data, provide real-time dashboards, and generate actionable insights, enabling smarter, data-driven decisions without a dedicated data team.
Business IntelligenceBYOB
BYOB (Build Your Own Brain) by Akaike is an enterprise-grade AI analyst platform that transforms complex data into actionable insights. It connects to multiple data sources, both structured and unstructured, allowing teams to make faster, data-driven decisions through a conversational chat interface. BYOB provides proactive analytics and seamlessly integrates into existing workflows, empowering departments like finance, marketing, and sales without needing to expand the data team.
Business IntelligenceQuills
Quills is an AI-powered business intelligence assistant that enables users to interact with their data through natural language. It connects to databases and files (CSV, Excel, PDF), automatically generates SQL queries from plain English questions, creates insightful visualizations, and integrates seamlessly with platforms like Slack to accelerate data-driven decision-making for teams.
Business Intelligence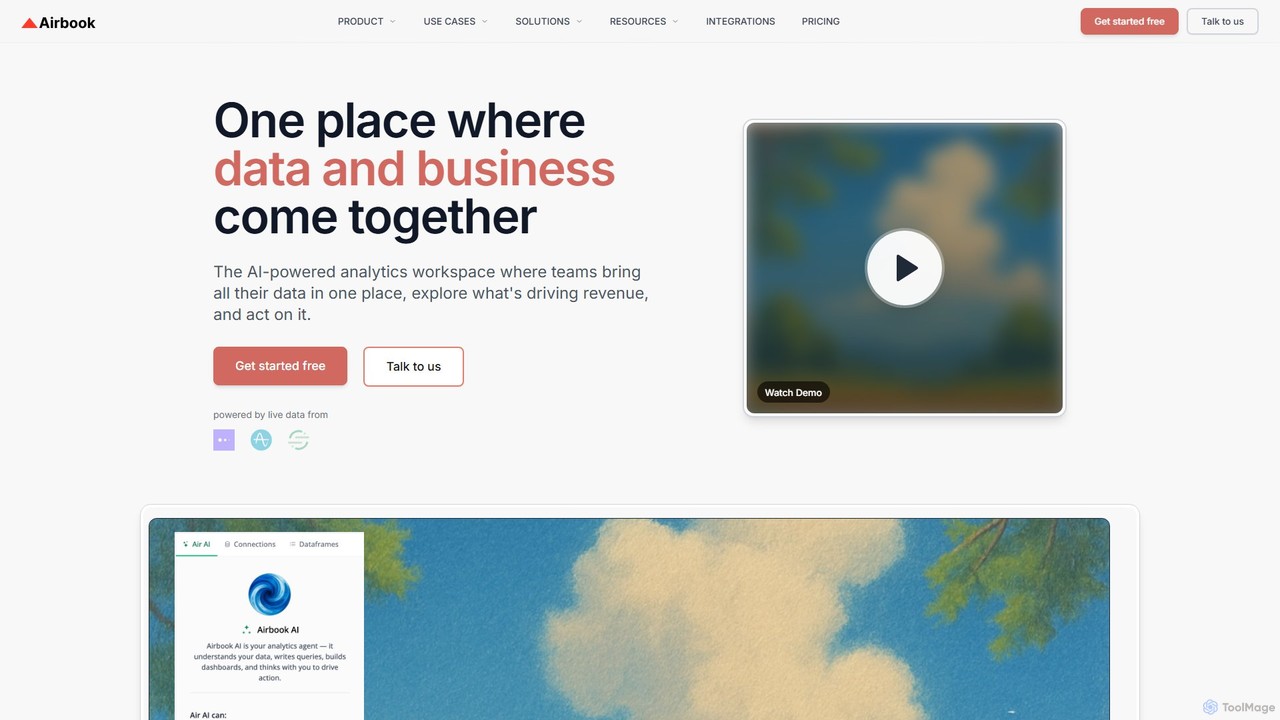
Airbook
Airbook is an AI-powered Go-to-Market (GTM) data platform that unifies data from CRM, marketing, finance, and product tools into a single collaborative workspace. It enables teams to analyze data using natural language, SQL, or a no-code builder, create dashboards, and activate insights to drive revenue growth.
Business Intelligence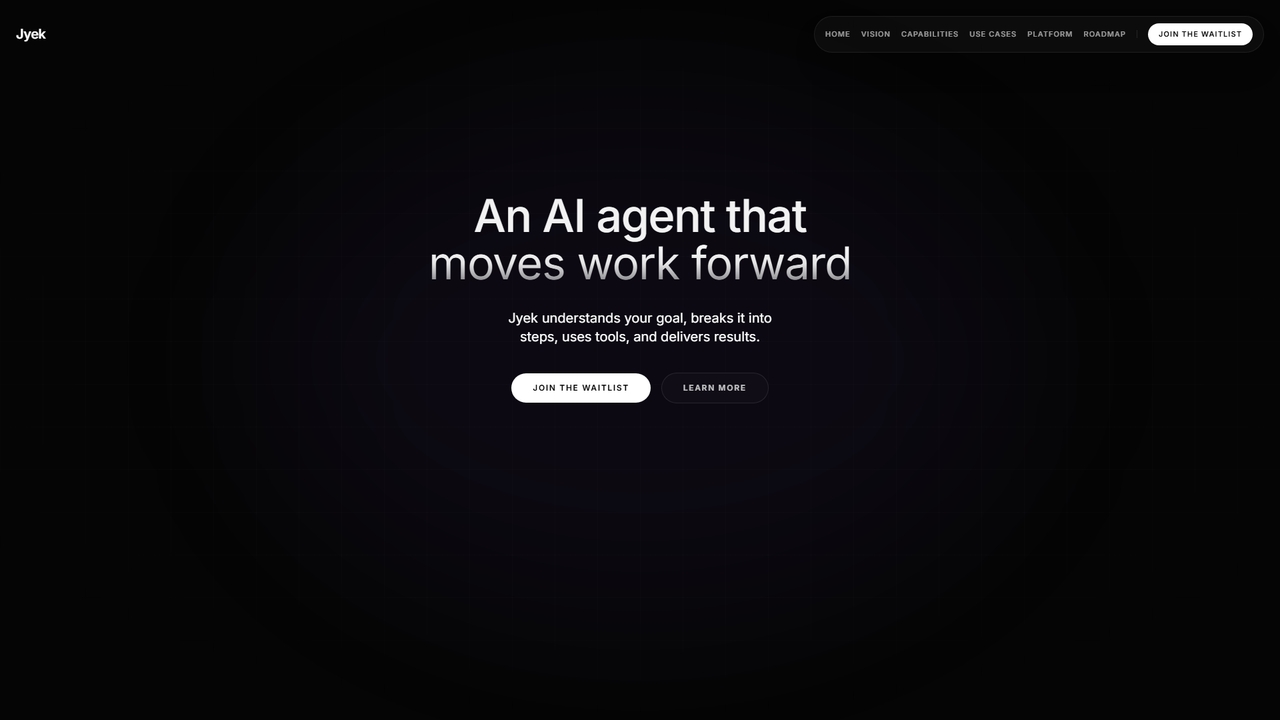
Jyek
Jyek is an AI agent platform that understands objectives, creates execution plans, uses tools, and delivers verifiable results for complex, multi-step tasks.
Automation
insyte
insyte is an AI-powered business intelligence platform that transforms complex data into clear, actionable insights. Ask questions in natural language, create interactive dashboards, and uncover hidden trends to drive business growth without needing a data scientist.
Business Intelligence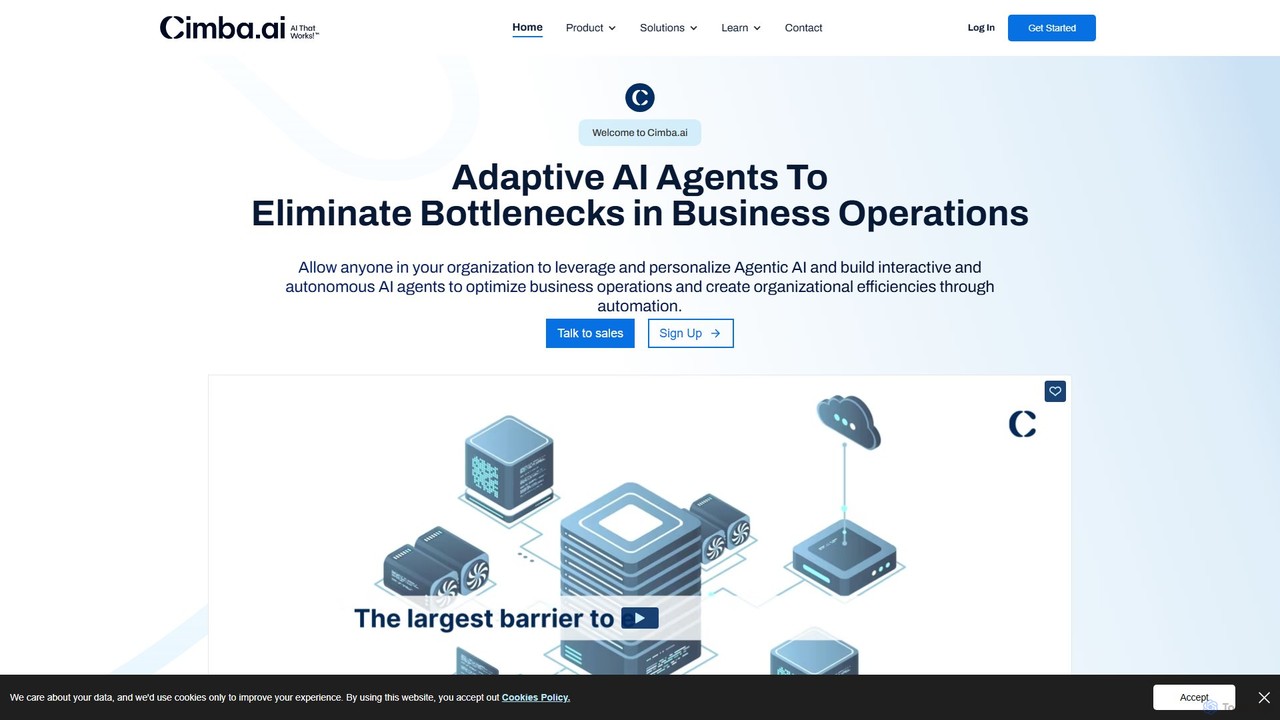
Cimba
Cimba is an AI analytics agent builder that allows businesses to create and embed custom AI agents into their products. It transforms complex data analysis by enabling users to ask questions in natural language. Cimba automates workflows, provides actionable insights, generates predictive analytics, and can even execute tasks, drastically reducing the time and resources needed for data-driven decision-making in areas like marketing, sales, and retail.
Low Code No Code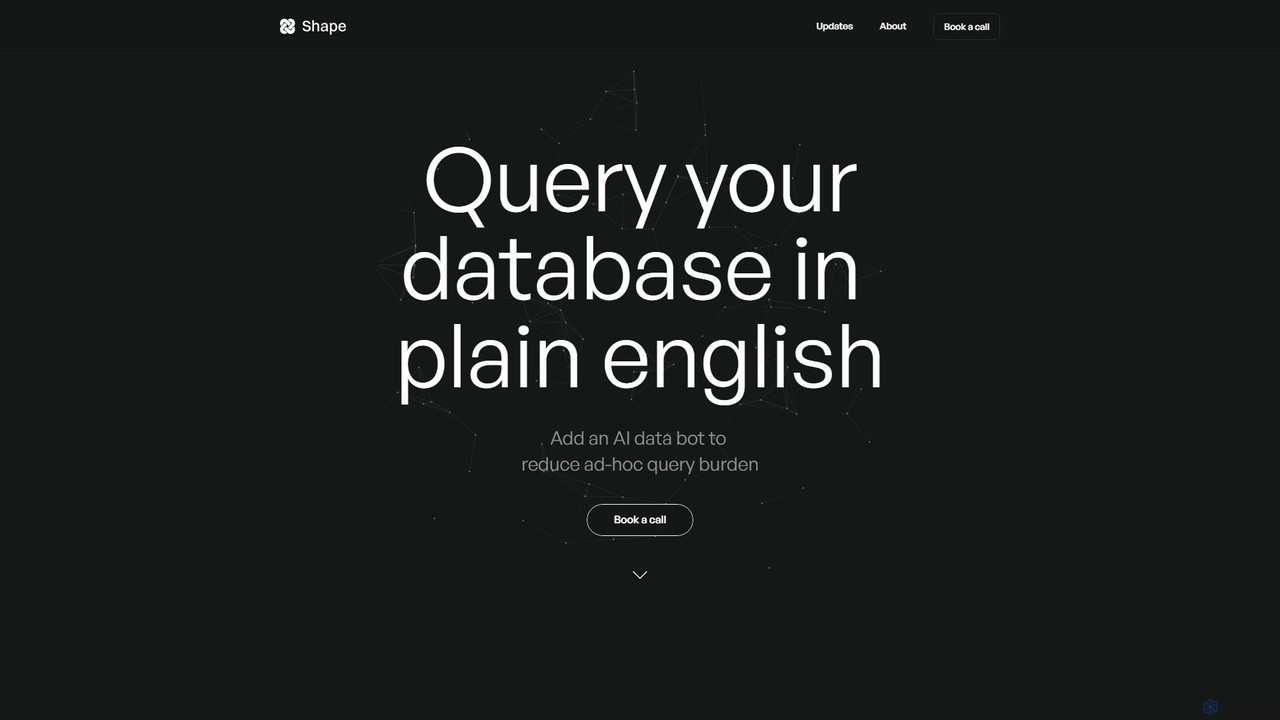
Shape
Shape is an AI-powered data analyst that allows teams to query their databases using plain English. It connects to your existing data stack and enables non-technical users to get instant answers to complex data questions through integrations like Slack and Microsoft Teams. By translating natural language into advanced SQL, Shape provides nuanced answers, automated visualizations, and frees up data analysts from ad-hoc query burdens, making data accessible to everyone in the organization.
Api
Scoop Analytics Comments (0)
Sign in to comment.
Sign inNo comments yet.