ToolMage
Sign in

Best 1 Analytics & Reporting AI tools for Developer Tools

Popular Analytics & Reporting AI tools in Developer Tools include Haystack, helping you work more efficiently.

Haystack
Freemium

Haystack

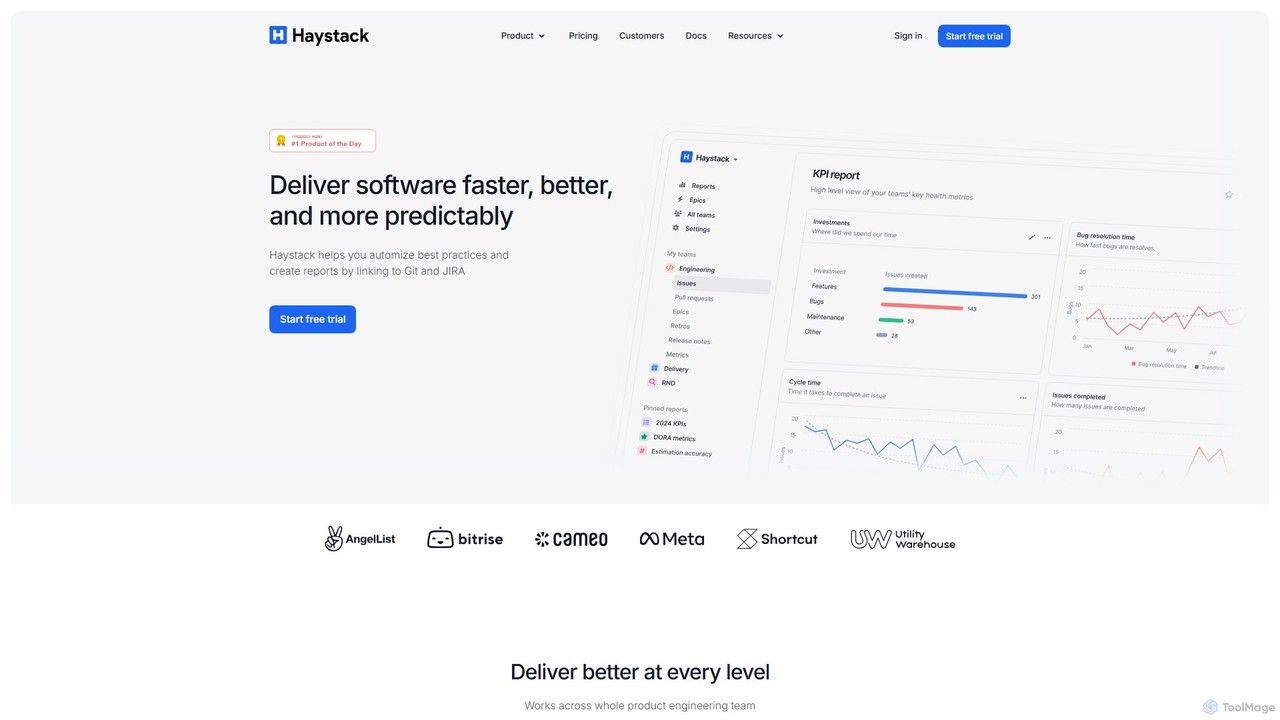
Haystack is an engineering intelligence platform that provides actionable insights for product and engineering leaders. It helps teams improve their software delivery lifecycle by tracking DORA metrics, cycle time, and other key performance indicators. By analyzing data from Git and project management tools, Haystack identifies bottlenecks, automates reporting, and fosters a culture of transparency and continuous improvement, ultimately accelerating time-to-market.

Business Intelligence
Visits 11.9KFavorites 148Likes 149

About Analytics & Reporting

Analytics & Reporting tools are a specialized category of developer utilities that leverage AI to automate the analysis and interpretation of software development and application performance data. These tools use machine learning models to sift through vast amounts of logs, metrics, and traces, moving beyond traditional dashboards. They proactively identify anomalies, predict future trends, and can even generate human-readable summaries from complex datasets. This empowers development teams to make faster, data-driven decisions, optimize code performance, and enhance the end-user experience.

Core Features

  • Automated Anomaly Detection: AI algorithms automatically monitor data streams to identify unusual patterns or outliers in performance metrics and user behavior.
  • Predictive Analytics: Utilizes historical data to forecast future trends, such as potential system failures, server load increases, or user churn rates.
  • Natural Language Querying (NLQ): Allows developers to ask complex questions about their data in plain language and receive immediate, visualized answers.
  • AI-Assisted Root Cause Analysis: Accelerates debugging by correlating events across different data sources to pinpoint the likely origin of an error or performance issue.
  • Automated Report Generation: Automatically compiles key insights, performance summaries, and trend analyses into structured, easy-to-understand reports.

Applicable Scenarios

These tools are essential for DevOps engineers, Site Reliability Engineers (SREs), software developers, and product managers. They are commonly integrated into CI/CD pipelines for code quality analysis, used in production environments for application performance monitoring (APM), and leveraged by product teams to understand user engagement patterns and feature adoption.

Selection Criteria

When choosing an Analytics & Reporting tool, consider its integration capabilities with your existing tech stack (e.g., cloud services, code repositories, project management tools). Evaluate the sophistication of its AI models and whether they can be customized. Also, assess the flexibility of its alerting system, the clarity of its automated reports, and its ability to scale with your data volume.

Analytics & Reporting use cases

1

Proactive Production Issue Detection

A Site Reliability Engineering (SRE) team for a global e-commerce platform uses an AI analytics tool to monitor real-time transaction data. The tool's anomaly detection model identifies a subtle but growing latency in a third-party payment gateway API, an issue invisible on standard dashboards. It automatically raises a high-priority alert with correlated logs and traces, allowing the team to reroute traffic to a backup gateway before a significant number of customers are affected, preventing revenue loss and protecting customer trust.

2

Automating Code Quality Reports

A software development manager integrates an AI reporting tool into their team's CI/CD pipeline. After each build, the tool analyzes the new code commits. It generates a concise report that highlights potential security vulnerabilities, overly complex functions (high cyclomatic complexity), and deviations from coding standards. Instead of spending hours on manual code reviews for routine checks, the manager receives an automated summary, allowing them to focus review efforts on critical logic and architectural decisions, improving both code quality and team velocity.

3

Predicting Infrastructure Resource Needs

A DevOps team for a fast-growing SaaS application uses a predictive analytics tool to forecast cloud infrastructure costs. The tool analyzes historical usage patterns of CPU, memory, and network I/O, correlating them with user growth and feature releases. It generates a report predicting that server load will exceed 80% capacity during the upcoming holiday season. This foresight allows the team to proactively scale resources, negotiate better pricing with their cloud provider, and avoid performance degradation during a critical business period.

4

Generating Natural Language Sprint Summaries

A product manager for an agile development team uses an AI reporting tool connected to Jira and GitHub. At the end of each two-week sprint, the tool automatically generates a summary in plain English. The report details completed story points versus committed, identifies which developer contributed the most commits, highlights any new critical bugs, and analyzes the bug resolution rate. This saves the product manager several hours of manual data compilation and allows them to present a clear, consistent, and data-backed progress report to stakeholders in minutes.

5

Pinpointing Performance Bottlenecks with AI

A mobile game developer notices a drop in user retention after a recent update. Using an AI analytics tool, they query in natural language: "Compare user session length and crash rates between app version 3.1 and 3.2." The tool instantly generates a comparative report showing that users on older Android devices are experiencing a 300% increase in crashes related to a new graphics rendering function. The AI-assisted root cause analysis points to a specific memory leak, allowing developers to fix the critical issue in hours instead of days of manual log sifting.

6

Optimizing User Onboarding Funnels

A product manager for a B2B SaaS tool wants to improve their user activation rate. They use an AI analytics platform to analyze the behavior of thousands of new users within their first seven days. The tool automatically identifies the biggest drop-off point in the onboarding flow: a complex configuration step. It also generates a report showing that users who watch an optional tutorial video at that stage are 50% more likely to complete setup. Based on this AI-driven insight, the team redesigns the step and makes the video more prominent, resulting in a 20% increase in user activation.

Analytics & Reporting FAQ

What are AI Analytics & Reporting tools for developers?

AI Analytics & Reporting tools are advanced software utilities designed to help development teams make sense of complex operational and development data. Unlike traditional dashboards that simply display metrics, these tools use machine learning to automatically detect anomalies, predict future issues, analyze root causes, and generate insightful reports in natural language. They essentially act as an automated data scientist for engineering teams, helping them monitor application performance, improve code quality, and understand user behavior more deeply.

How do AI analytics tools differ from traditional APM or BI tools?

The key difference lies in proactivity and depth of insight.

  • Traditional APM/BI Tools: These are primarily descriptive. They show you what happened by presenting data in dashboards and charts. They require a human expert to interpret the data, spot trends, and diagnose problems.
  • AI Analytics Tools: These tools are diagnostic and predictive. They tell you why something happened by using AI for root cause analysis, and what is likely to happen through predictive forecasting. They reduce manual effort by automatically surfacing critical insights and often allow for natural language queries, making data analysis more accessible to non-analysts.
In essence, traditional tools provide the raw data, while AI tools provide automated analysis and answers.

How do I choose the right AI Analytics & Reporting tool?

Choosing the right tool depends on your specific needs. Consider these key factors:

  • Integrations: Does the tool seamlessly connect with your critical data sources, such as your cloud provider (AWS, Azure, GCP), code repositories (GitHub, GitLab), CI/CD tools (Jenkins), and project management software (Jira)?
  • Analysis Capabilities: What kind of analysis do you need most? Look for tools specializing in application performance monitoring (APM), code quality analysis, user behavior tracking, or security threat detection.
  • Ease of Use: Evaluate the user interface. Does it offer powerful features like natural language querying? How customizable are the dashboards and reports?
  • Scalability and Cost: Can the tool handle your current and future data volume? Understand the pricing model—is it based on data ingestion, number of users, or features?
Start by identifying your primary pain point and look for a tool that excels at solving it.

What are the main benefits of using AI for development analytics?

The primary benefits are speed, proactivity, and efficiency. By automating data analysis, these tools allow teams to:

  • Resolve Incidents Faster: AI-powered root cause analysis can reduce Mean Time to Resolution (MTTR) by quickly identifying the source of bugs and performance issues.
  • Prevent Problems Proactively: Anomaly detection and predictive analytics help teams spot potential issues before they impact users, shifting from a reactive to a proactive operational model.
  • Improve Developer Productivity: Automated code quality reports and performance insights free up developers from manual analysis, allowing them to focus on building features.
  • Make Data-Driven Decisions: Natural language reporting makes complex data accessible to all team members, fostering a culture of informed decision-making for product and engineering strategies.

Who are the primary users of AI Analytics & Reporting tools?

While these tools can benefit entire organizations, the primary users are typically technical roles who are directly involved in the software development lifecycle. This includes:

  • DevOps and SREs: For monitoring system health, detecting production anomalies, and ensuring reliability and performance.
  • Software Developers: For debugging complex issues, understanding the performance impact of their code, and receiving automated code quality feedback.
  • Product Managers: For analyzing user behavior, understanding feature adoption, and making data-informed decisions about the product roadmap.
  • QA Engineers: For identifying performance regressions and pinpointing the root cause of bugs found during testing.