ToolMage
Sign in

Best 1 Dashboard AI tools for Developer Tools

Popular Dashboard AI tools in Developer Tools include makerpeak, helping you work more efficiently.

makerpeak
Freemium

makerpeak

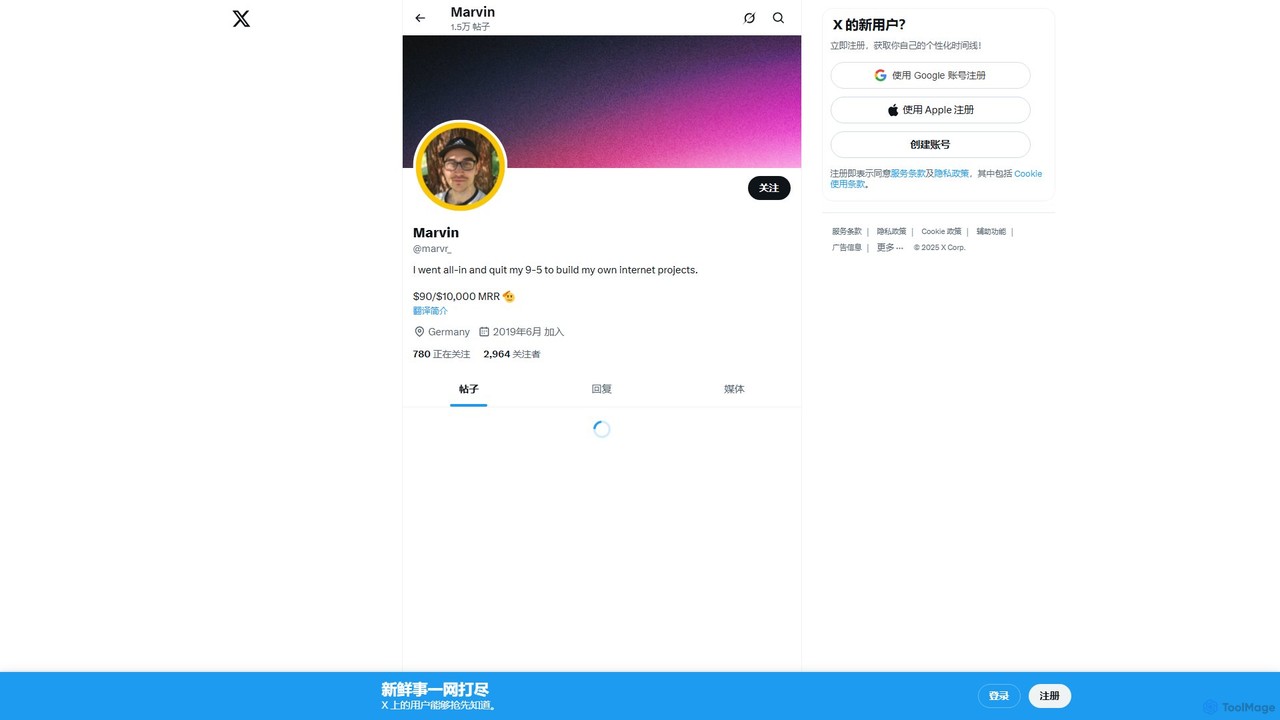
makerpeak is an all-in-one platform for indie hackers, solopreneurs, and makers. It integrates project management, real-time business analytics (MRR, churn), user feedback, and changelogs into a single, intuitive dashboard. Stop juggling multiple tools and focus on building and growing your projects.

Analytics
Visits 55.7KFavorites 113Likes 106

About Dashboard

AI Dashboards are AI-powered tools that provide real-time, consolidated views of key metrics, operational status, and performance data for applications, systems, or development projects. These tools leverage artificial intelligence to aggregate data from diverse sources, analyze complex patterns, and offer intelligent visualizations. They enable developers, DevOps engineers, and project managers to proactively monitor, troubleshoot, and optimize their software development lifecycle and deployed applications with enhanced insights.

Core Features

  • Real-time Monitoring: Display live data streams from applications, infrastructure, and services for immediate oversight.
  • AI-powered Anomaly Detection: Automatically identify unusual patterns or deviations in performance metrics without predefined thresholds.
  • Customizable Visualizations: Allow users to create tailored charts, graphs, and widgets for specific data points and reporting needs.
  • Integrated Data Sources: Connect seamlessly to various development tools, databases, cloud platforms, and APIs for comprehensive data aggregation.
  • Predictive Analytics: Forecast future performance trends or potential issues based on historical data and machine learning models.

Applicable Scenarios

AI Dashboards are essential for teams managing complex software environments. They are widely used for application performance monitoring (APM) to track live system health, for DevOps teams to oversee CI/CD pipeline efficiency, and for SREs to ensure infrastructure stability and resource utilization. These tools provide critical visibility across the entire software ecosystem.

How to Choose

When selecting an AI Dashboard, prioritize its data source integration capabilities to ensure compatibility with your existing tech stack. Evaluate the depth of its AI features, including anomaly detection and predictive analytics. Look for extensive customization options for dashboards and alerts, and consider its scalability to handle growing data volumes. Ease of use and robust support are also crucial for effective adoption.

Featured tool rankings

Dashboard use cases

1

Monitoring Microservices Health

Developers managing complex microservices architectures utilize AI dashboards to gain a unified, real-time view of hundreds of individual service instances. This allows them to quickly pinpoint performance bottlenecks, error rates, or latency issues within specific services, enabling rapid debugging and ensuring overall system stability without manual log sifting.

2

Optimizing CI/CD Pipeline Efficiency

DevOps engineers leverage AI dashboards to track the health and efficiency of their continuous integration and continuous delivery pipelines. They monitor metrics like build times, test coverage, deployment success rates, and resource consumption across various projects, identifying slowdowns or recurring failures to streamline development workflows and accelerate releases.

3

Proactive Anomaly Detection in Production

Site Reliability Engineers (SREs) rely on AI-driven dashboards to automatically detect and alert on unusual spikes in error rates, unexpected latency, or sudden drops in user traffic in production environments. This proactive approach allows teams to address potential incidents before they escalate into major outages, minimizing downtime and maintaining service quality.

4

Resource Allocation and Cost Management

Cloud architects and operations teams use AI dashboards to monitor resource consumption (CPU, memory, network I/O) across their cloud infrastructure and on-premise servers. By visualizing usage patterns and identifying underutilized or over-provisioned resources, they can make data-driven decisions to optimize cloud spending, improve efficiency, and prevent unexpected costs.

5

Tracking User Experience Metrics

Product managers and development teams integrate user behavior and experience data into AI dashboards to visualize key metrics such as page load times, conversion funnels, click-through rates, and client-side errors. This provides actionable insights into how users interact with the application, helping to identify pain points and prioritize features for improved user satisfaction.

6

Security Incident Response Visualization

Security analysts employ specialized AI dashboards to aggregate security logs, threat intelligence feeds, and vulnerability scan results from various systems. These dashboards visualize potential attack patterns, suspicious activities, and system vulnerabilities in real-time, enabling faster detection, analysis, and response to security incidents, thereby enhancing overall system security posture.

Dashboard FAQ

What is an AI Dashboard in developer tools?

An AI Dashboard in developer tools is a centralized, visual interface that uses artificial intelligence to aggregate, analyze, and display real-time operational data from software applications, infrastructure, and development pipelines. It goes beyond traditional dashboards by offering AI-powered insights, anomaly detection, and predictive analytics to help developers and operations teams monitor system health, identify issues, and optimize performance.

How do AI Dashboards differ from traditional dashboards?

Traditional dashboards primarily present static or rule-based visualizations of data. AI Dashboards, however, integrate machine learning algorithms to automatically detect anomalies, predict future trends, and provide intelligent alerts without predefined thresholds. They offer deeper insights, reduce manual configuration, and enable more proactive problem-solving compared to their traditional counterparts, making them more dynamic and intelligent.

What kind of data can an AI Dashboard integrate?

AI Dashboards can integrate a wide array of data sources critical for development and operations. This includes application logs, performance metrics (CPU, memory, network), database queries, API call data, CI/CD pipeline status, cloud resource utilization, security events, and even business metrics. The goal is to provide a holistic, unified view of the entire software ecosystem, enabling comprehensive monitoring and analysis.

Who benefits most from using AI Dashboards in development?

Developers benefit from real-time application health monitoring and faster debugging. DevOps and SRE teams use them for proactive incident management, pipeline optimization, and infrastructure oversight. Project managers gain insights into project progress and resource allocation. Ultimately, anyone involved in building, deploying, or maintaining software can leverage AI Dashboards for improved visibility, faster issue resolution, and data-driven decision-making.

What are key features to look for when choosing an AI Dashboard tool?

When selecting an AI Dashboard tool, prioritize robust data integration capabilities with your existing tech stack. Look for advanced AI features like anomaly detection, root cause analysis, and predictive analytics. Customization options for visualizations and alerts are crucial for tailoring the dashboard to specific needs. Consider scalability, ease of use, and the quality of support. Finally, evaluate the pricing model based on your data volume and user requirements.