BlickState
BlickState is an advanced time-travel debugging tool for AI agents, enabling developers to restore and inspect the full …
BlickState is an advanced time-travel debugging tool for AI agents, enabling developers to restore and inspect the full memory state of agent tool executions at the exact millisecond of failure. It transforms black-box agent behavior into transparent, inspectable processes, significantly accelerating debugging for AI engineers.
Flutch
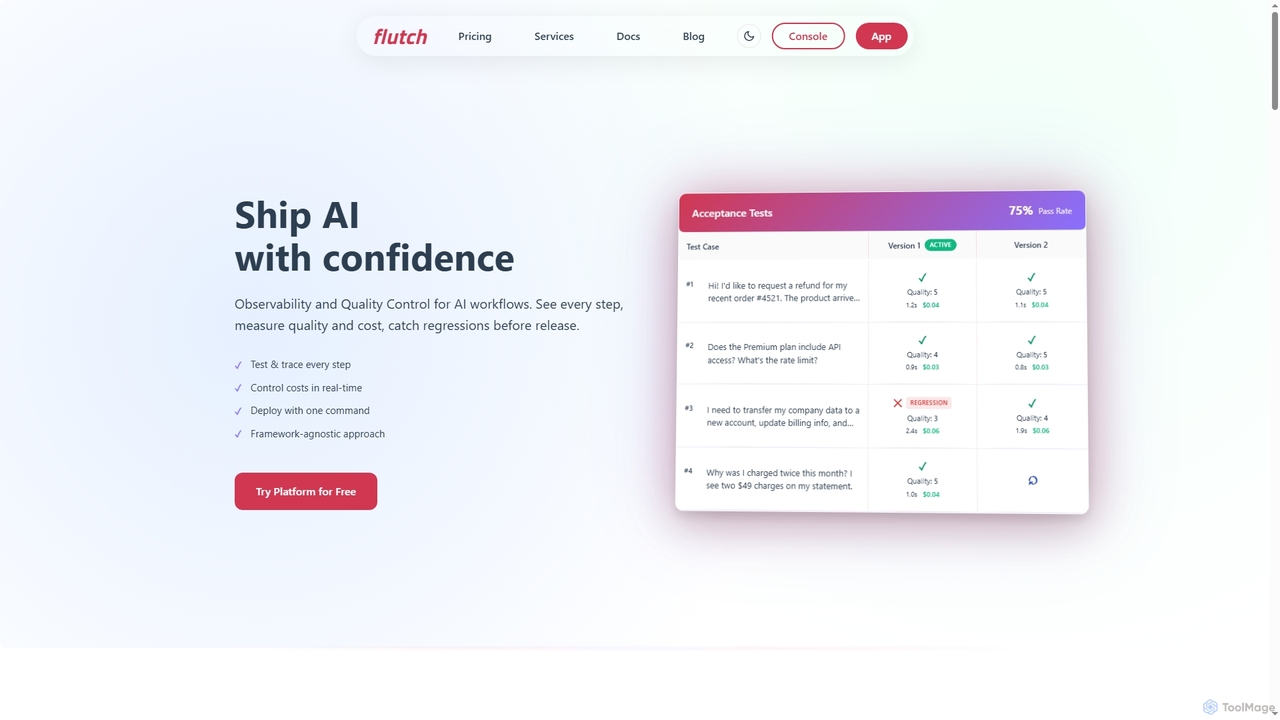
Flutch is a comprehensive platform for developing, deploying, and managing custom AI agents with a strong focus on …
Flutch is a comprehensive platform for developing, deploying, and managing custom AI agents with a strong focus on observability, quality control, and cost management. It empowers developers to build reliable AI workflows, test agents rigorously, monitor performance in real-time, and integrate seamlessly into existing systems, ensuring AI solutions are shipped with confidence and operate efficiently.
Splunk
Splunk is the key to enterprise resilience, offering a unified, AI-powered platform for security and observability. It enables …
Splunk is the key to enterprise resilience, offering a unified, AI-powered platform for security and observability. It enables organizations to investigate, monitor, analyze, and act on data from any source at any scale. Now a Cisco company, Splunk helps SecOps, ITOps, and engineering teams keep their digital systems secure and reliable in the AI era.
Metoro
Metoro is an AI-powered observability platform designed for Kubernetes. It uses eBPF technology for zero-instrumentation monitoring, enabling autonomous …
Metoro is an AI-powered observability platform designed for Kubernetes. It uses eBPF technology for zero-instrumentation monitoring, enabling autonomous issue detection, root cause analysis, and automated code fixes via pull requests. Operational in under a minute, it offers a comprehensive and cost-effective alternative to traditional monitoring tools.
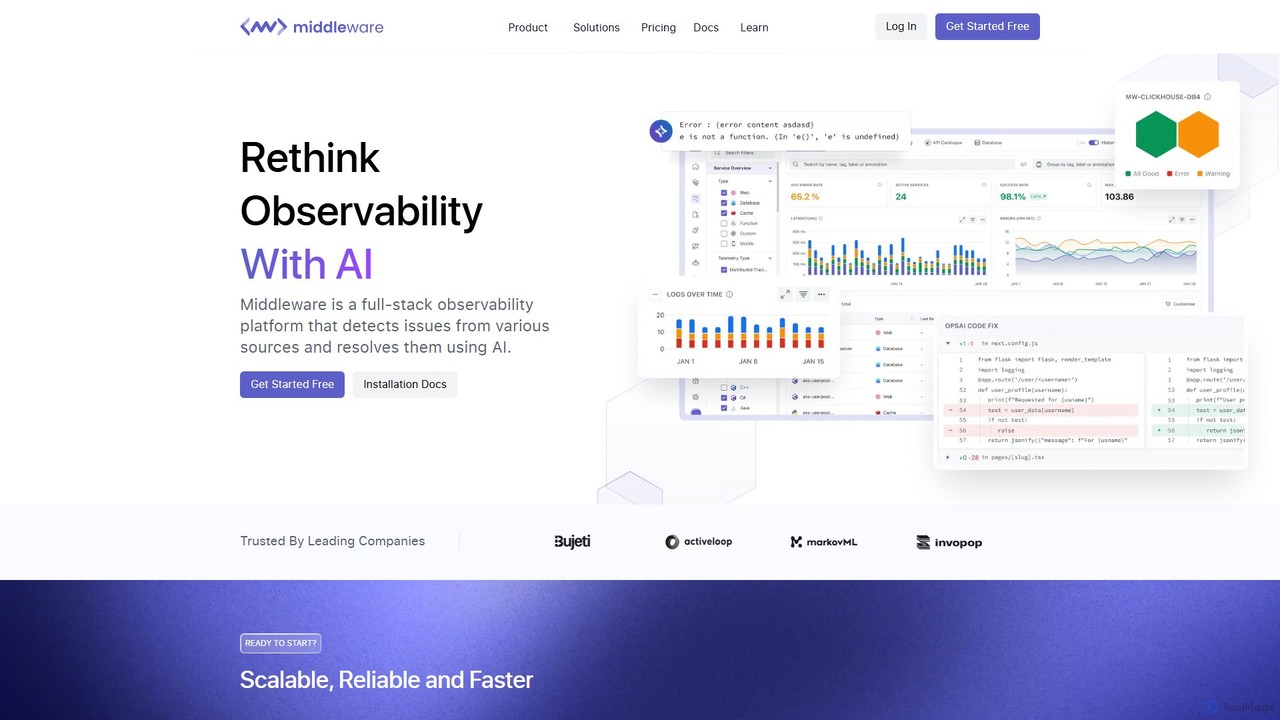
Middleware
Middleware is an AI-powered, full-stack cloud observability platform designed to modernize IT infrastructure. It unifies logs, metrics, traces, …
Middleware is an AI-powered, full-stack cloud observability platform designed to modernize IT infrastructure. It unifies logs, metrics, traces, and RUM data into a single view, enabling teams to monitor their entire tech stack in real-time. With its core OpsAI feature, Middleware automatically detects, diagnoses, and even resolves up to 70% of issues, significantly reducing resolution time and improving developer productivity. It offers a cost-effective, scalable solution for businesses of all sizes.
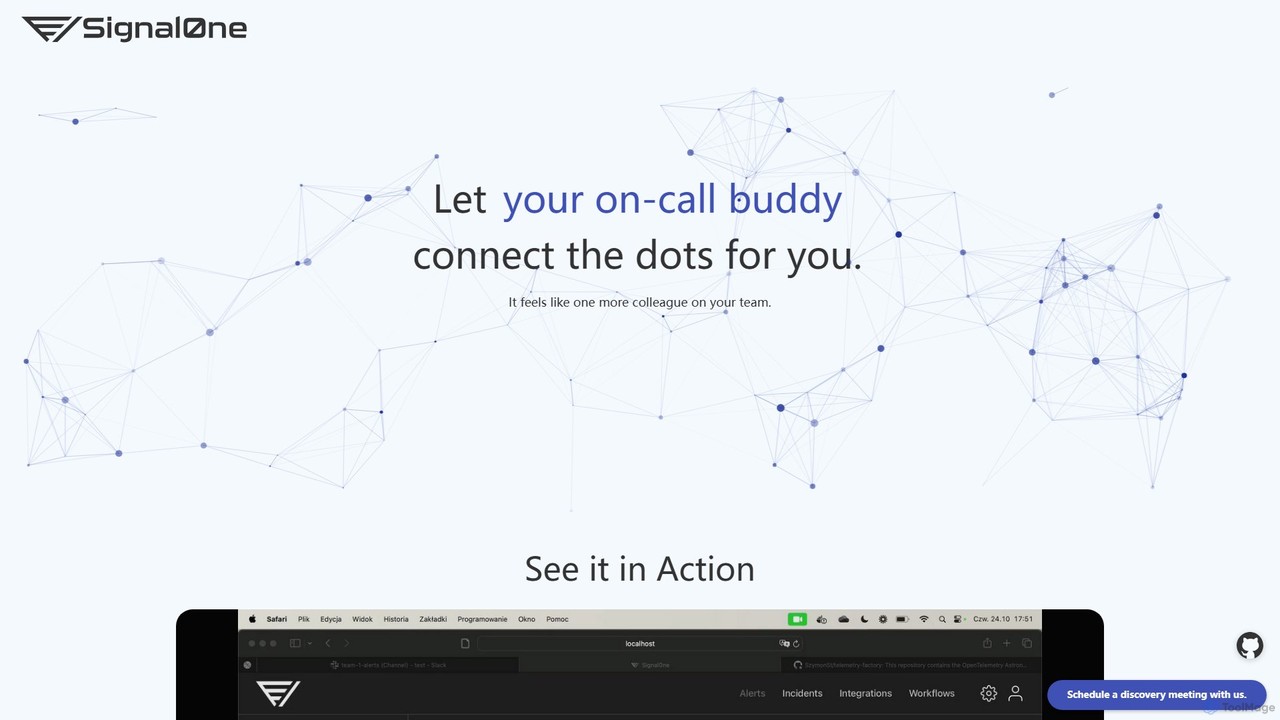
Signal0ne
Signal0ne is an AI-powered AIOps platform that acts as an on-call assistant for DevOps and SRE teams. It …
Signal0ne is an AI-powered AIOps platform that acts as an on-call assistant for DevOps and SRE teams. It automates root cause analysis by correlating signals from your existing observability stack, enriching alerts with crucial context, and suggesting mitigation steps. This helps teams reduce alert fatigue and significantly decrease Mean Time To Resolution (MTTR).
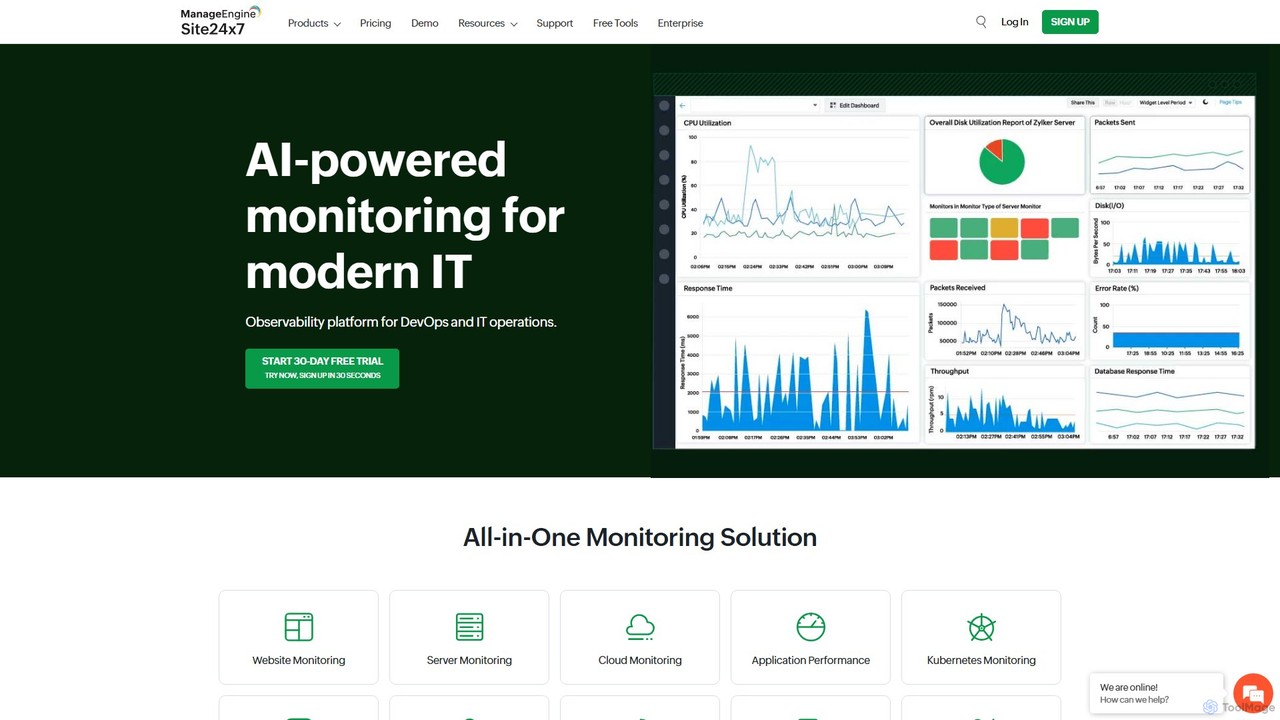
Site24x7
Site24x7 is an AI-powered, all-in-one observability platform for DevOps and IT operations. It provides comprehensive monitoring for websites, …
Site24x7 is an AI-powered, all-in-one observability platform for DevOps and IT operations. It provides comprehensive monitoring for websites, servers, cloud infrastructure (AWS, Azure, GCP), networks, and applications from a single console. It helps ensure uptime, troubleshoot performance issues, and optimize user experience.
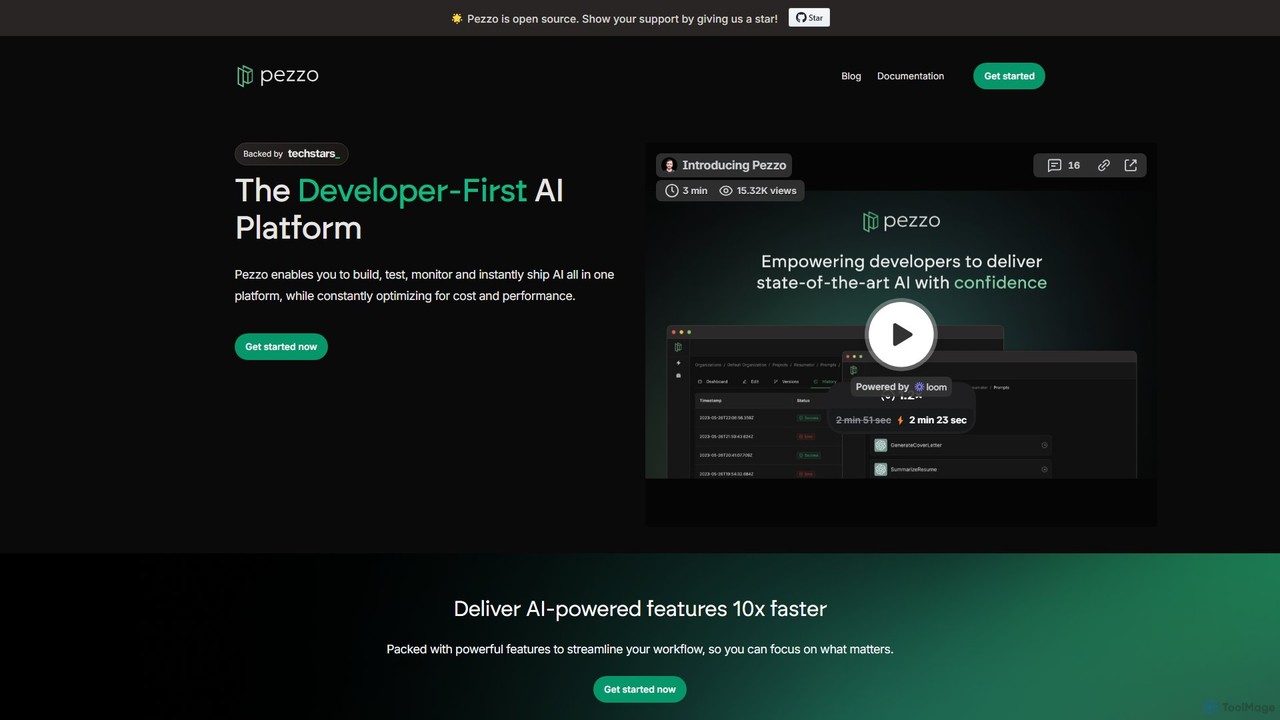
Pezzo
Pezzo is an open-source, developer-first AI platform designed to streamline the entire lifecycle of AI feature development. It …
Pezzo is an open-source, developer-first AI platform designed to streamline the entire lifecycle of AI feature development. It enables teams to build, test, monitor, and ship AI-powered features up to 10x faster through centralized prompt management, real-time observability, and collaborative tools.
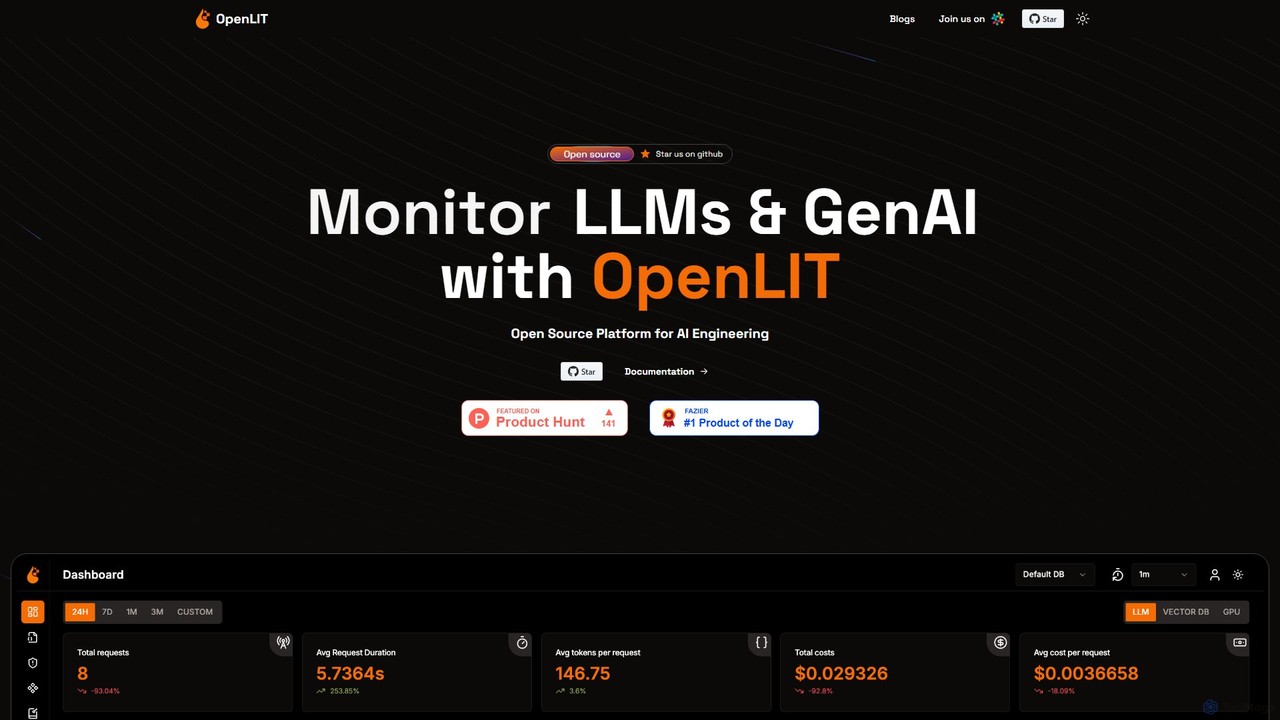
OpenLIT
OpenLIT is an open-source, OpenTelemetry-native observability platform for Generative AI and LLM applications. It simplifies development with tools …
OpenLIT is an open-source, OpenTelemetry-native observability platform for Generative AI and LLM applications. It simplifies development with tools for request tracing, cost tracking, exception monitoring, and performance analysis. Featuring a centralized prompt repository, a secure vault for secrets, and a playground for comparing LLMs, OpenLIT provides a comprehensive solution for monitoring and scaling AI applications efficiently.
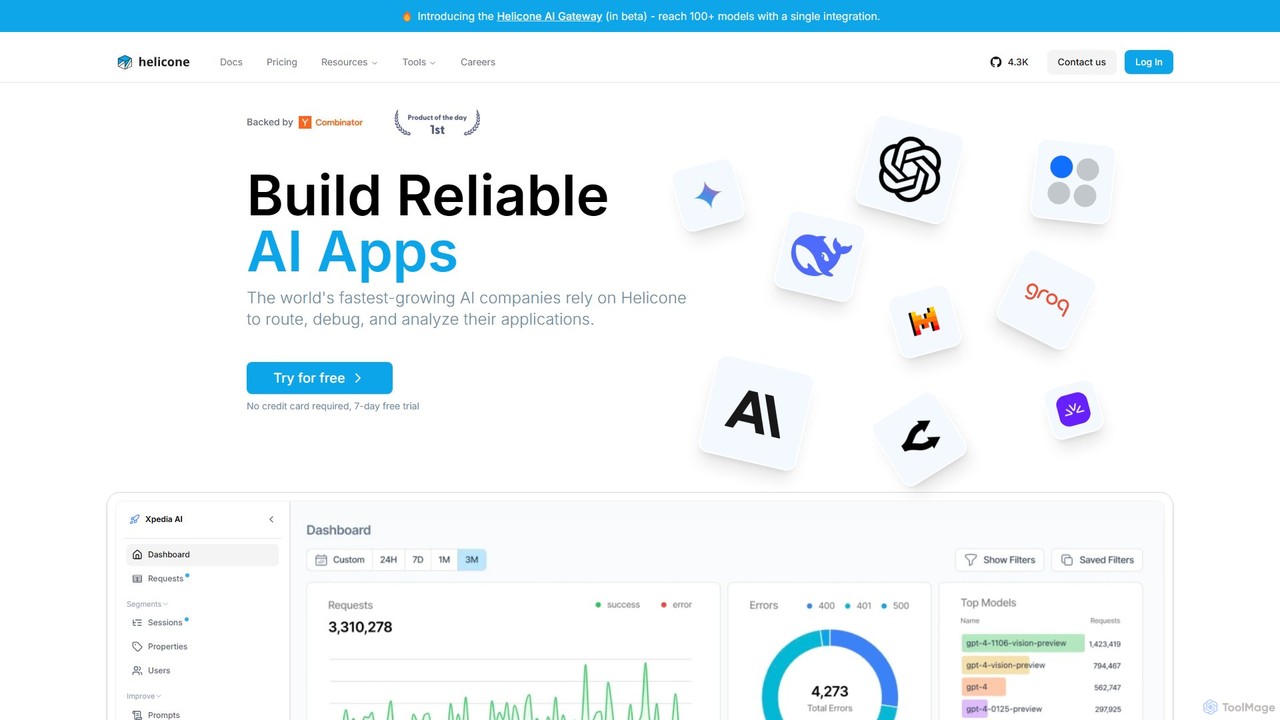
Valyr
Valyr (formerly Helicone) is an open-source LLM observability platform and AI gateway. It helps developers monitor, debug, and …
Valyr (formerly Helicone) is an open-source LLM observability platform and AI gateway. It helps developers monitor, debug, and analyze their AI applications, providing a single integration to access over 100 models, manage costs, and improve reliability with features like caching and rate limiting.

Mezmo
Mezmo is a comprehensive telemetry data pipeline platform designed for developers, DevOps, and SRE teams. It enables users …
Mezmo is a comprehensive telemetry data pipeline platform designed for developers, DevOps, and SRE teams. It enables users to ingest, process, and analyze logs, metrics, and traces from any source. With a focus on control and cost-efficiency, Mezmo allows you to filter, transform, and route your observability data to any destination, optimizing performance and reducing expenses.
About Observability
Observability tools are AI-powered solutions designed to provide deep insights into the internal state and behavior of complex software systems. By collecting and analyzing metrics, logs, and traces, these tools enable developers and operations teams to understand why issues occur, predict potential problems, and optimize performance. They are essential for maintaining the reliability, efficiency, and resilience of modern applications, especially in distributed and cloud-native environments.
Core Features
- Automated Data Ingestion: Automatically collects metrics, logs, and traces from various sources (applications, infrastructure, services).
- Real-time Monitoring & Alerting: Provides dashboards for real-time system health visualization and triggers alerts on anomalies or predefined thresholds.
- Distributed Tracing: Tracks requests across multiple services to pinpoint latency bottlenecks and failure points in microservices architectures.
- Log Management & Analysis: Centralizes, indexes, and analyzes vast volumes of log data for troubleshooting and security auditing.
- AI-driven Anomaly Detection: Uses machine learning to identify unusual patterns in system behavior that might indicate emerging problems.
Applicable Scenarios
Observability tools are indispensable for SREs, DevOps engineers, and developers managing production systems. They are used to quickly diagnose the root cause of application errors, monitor the performance of microservices, and ensure service level objectives (SLOs) are met. For example, a DevOps team might use these tools to identify a memory leak in a specific service after a new deployment or to understand why a user request is experiencing high latency across several backend components.
How to Choose
When selecting an Observability tool, consider its data collection capabilities (metrics, logs, traces), integration with your existing tech stack, and scalability to handle growing data volumes. Evaluate its real-time analytics and visualization features, including customizable dashboards and alerting mechanisms. Also, assess its AI-driven insights for anomaly detection and root cause analysis, as well as its pricing model based on data ingestion and retention.
ObservabilityUse Cases
Diagnosing Production Incidents Faster
Site Reliability Engineers (SREs) use observability platforms to rapidly pinpoint the root cause of critical production issues. By correlating metrics, logs, and traces across distributed services, they can quickly identify which specific component is failing or experiencing performance degradation, reducing mean time to resolution (MTTR) and minimizing downtime for end-users.
Optimizing Microservices Performance
Developers and DevOps teams leverage distributed tracing to visualize the entire request flow through a complex microservices architecture. This allows them to identify latency bottlenecks, inefficient database queries, or slow API calls between services, enabling targeted optimizations to improve overall application responsiveness and user experience.
Proactive Anomaly Detection
Operations teams deploy AI-powered observability tools to automatically detect unusual patterns in system behavior that might indicate an impending problem. For instance, a sudden spike in error rates for a specific API or an unexpected drop in throughput can be flagged before it impacts users, allowing for proactive intervention and preventing outages.
Ensuring Compliance and Security Audits
Security and compliance officers utilize centralized log management features to collect, store, and analyze audit logs from all system components. This provides a comprehensive trail of activities, helping to detect unauthorized access attempts, investigate security incidents, and demonstrate compliance with regulatory requirements like GDPR or HIPAA.
Capacity Planning and Resource Management
Infrastructure engineers use historical performance metrics gathered by observability tools to understand resource utilization trends (CPU, memory, network). This data informs strategic decisions for capacity planning, ensuring that sufficient resources are available to handle peak loads while avoiding over-provisioning and unnecessary infrastructure costs.
Validating New Deployments and Features
Development teams integrate observability into their CI/CD pipelines to monitor the impact of new code deployments or feature releases in real-time. By observing key performance indicators (KPIs) and error rates immediately after a rollout, they can quickly identify regressions or unexpected behaviors and initiate rollbacks if necessary, ensuring stable releases.