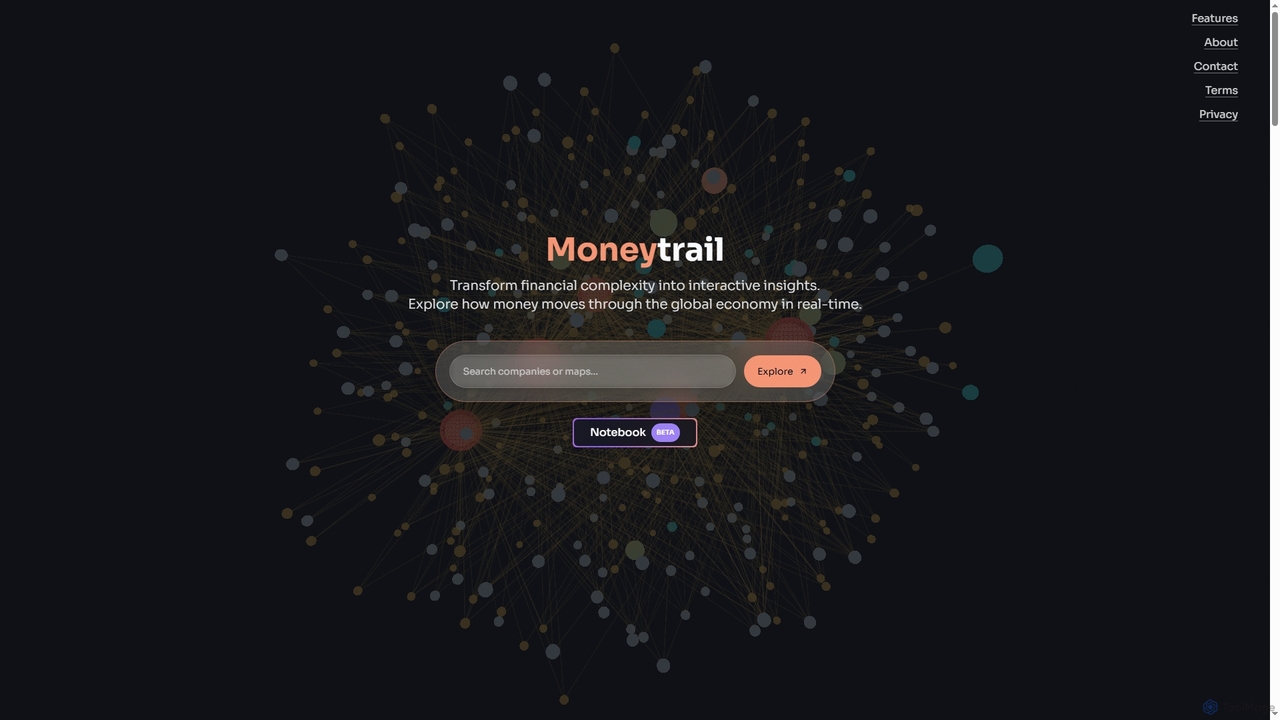
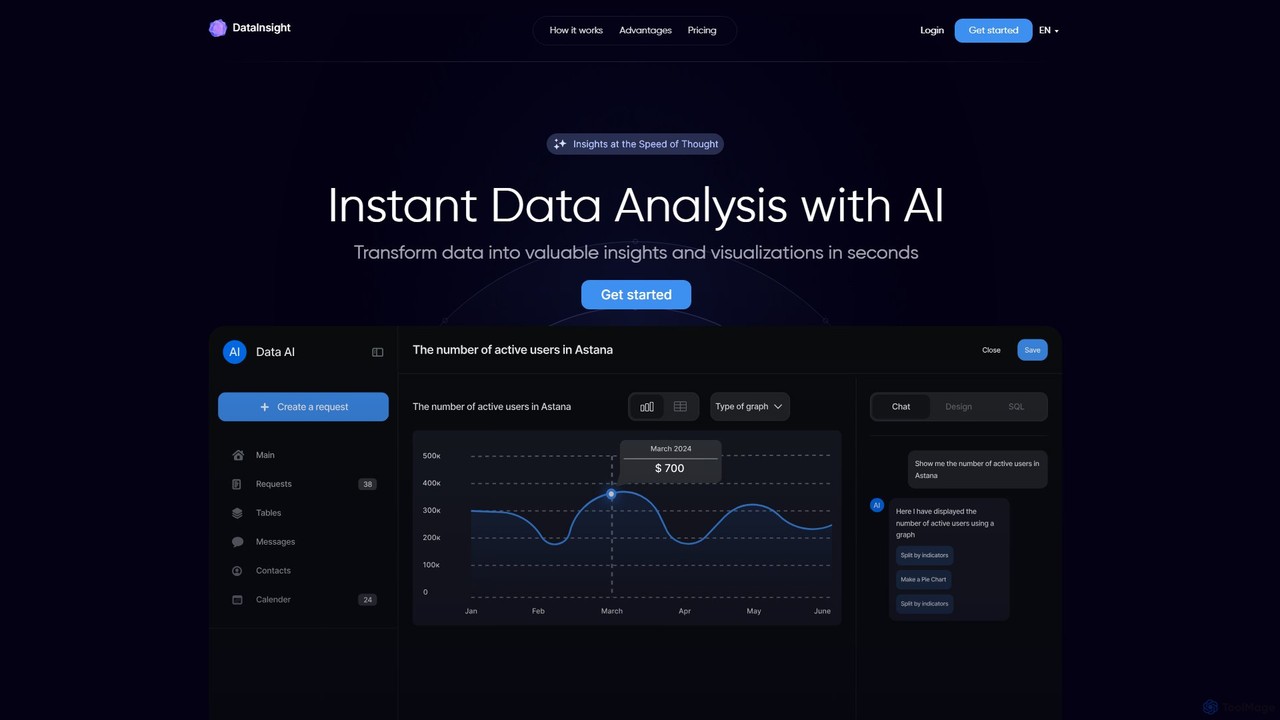
Data Visualization AI tools are designed to transform complex financial datasets into intuitive, interactive visual representations. Leveraging advanced AI algorithms, these tools automate the creation of charts, graphs, and dashboards, revealing hidden patterns and trends. They empower financial analysts, investors, and decision-makers to quickly grasp market dynamics, risk exposures, and performance metrics, facilitating data-driven strategic planning and reporting.
Core Features
- Automated Chart Generation: Automatically creates various chart types from raw financial data.
- Anomaly Detection: Identifies unusual patterns or outliers in financial datasets using AI.
- Predictive Visuals: Generates visualizations based on AI-driven forecasts for future trends.
- Interactive Dashboards: Provides dynamic, customizable dashboards for real-time data exploration.
- Natural Language Query: Allows users to ask questions in plain language to generate visualizations.
Applicable Scenarios
These tools are crucial for financial professionals across various roles. Financial analysts use them for market trend analysis, investment managers for portfolio performance tracking, and risk officers for identifying potential exposures. They are also vital for corporate finance teams to visualize budget adherence and expense patterns, enhancing transparency and decision-making.
How to Choose
When selecting a Data Visualization AI tool, consider its compatibility with your existing financial data sources and its range of AI capabilities, such as automated insights and predictive analytics. Evaluate the customization options for dashboards, the ease of use, and the level of interactivity. Crucially, ensure the tool offers robust security features and complies with financial industry regulations for data privacy and integrity.