PicDoc is an AI-powered text-to-visual tool that instantly transforms text into stunning infographics, flowcharts, and diagrams. Simply input your content, and PicDoc's AI will analyze, summarize, and visualize it in seconds, helping you communicate complex ideas effectively and create professional-looking visuals without design skills.

showthe.link is an AI-powered tool that transforms any web link into concise summaries and engaging visual content like infographics, mind maps, or video clips. It helps users quickly grasp the core ideas of an article or webpage without reading the entire text.
Product overview
PicDoc Product overview
PicDoc is an AI-powered text-to-visual tool that instantly transforms text into stunning infographics, flowcharts, and diagrams. Simply input your content, and PicDoc's AI will analyze, summarize, and visualize it in seconds, helping you communicate complex ideas effectively and create professional-looking visuals without design skills.

showthe.link Product overview
showthe.link is an AI-powered tool that transforms any web link into concise summaries and engaging visual content like infographics, mind maps, or video clips. It helps users quickly grasp the core ideas of an article or webpage without reading the entire text.
Detailed feature comparison
| Feature | PicDoc | showthe.link |
|---|---|---|
| Primary category | Infographics | Infographics |
| Added | 2025-08-14 | 2025-08-17 |
| Pricing | Free | Freemium |
| Official website | www.picdoc.cn | showthe.link |
| Product type | Website | Website |
| Performance data | ||
| User rating | Not verified | Not verified |
| Comments | 0 | 0 |
| Monthly visits | 59.8K | 1.4K |
| Monthly growth | -36.1% | 195% |
| Favorites | 129 | 127 |
| Details | View details | View details |
PicDoc vs showthe.link monthly traffic
Compare PicDoc and showthe.link by monthly reach, traffic trend, visit depth, top regions, and acquisition sources.
How to interpret the traffic data
In the PicDoc vs showthe.link monthly traffic comparison, PicDoc currently shows 59.8K visits and showthe.link shows 1.4K; PicDoc has about 43.9 times the visible traffic of showthe.link, an absolute difference of about 58.5K visits. This reflects visible reach, not feature quality or paid users.
Both tools provide verified traffic details, so monthly trends, visit depth, regions, and acquisition sources can be compared on the same basis.
PicDoc monthly traffic:
Latest traffic
Monthly traffic trend
- 2025/9: 57.6K Monthly visits
- 2026/1: 42.1K Monthly visits
- 2026/2: 29.1K Monthly visits
- 2026/3: 53.4K Monthly visits
- 2026/4: 93.6K Monthly visits
- 2026/5: 59.8K Monthly visits
Top regions
Top 5 countries/regions
| Country/region | Percentage | Traffic |
|---|---|---|
| 🇨🇳China | 88.62% | 53K |
| 🇭🇰Hong Kong | 3.92% | 2.3K |
| 🇹🇼Taiwan | 3.35% | 2K |
| 🇺🇸United States | 2.68% | 1.6K |
| 🇸🇬Singapore | 1.43% | 856 |
Traffic sources
| Source type | Percentage | Traffic |
|---|---|---|
| Direct | 78.88% | 47.2K |
| Referral | 21.12% | 12.6K |
Search keywords
showthe.link monthly traffic:
Latest traffic
Monthly traffic trend
- 2025/8: 83 Monthly visits
- 2025/9: 360 Monthly visits
- 2026/2: 289 Monthly visits
- 2026/3: 0 Monthly visits
- 2026/4: 462 Monthly visits
- 2026/5: 1.4K Monthly visits
Top regions
Top 5 countries/regions
| Country/region | Percentage | Traffic |
|---|---|---|
| 🇮🇳India | 67.65% | 922 |
| 🇬🇧United Kingdom | 32.35% | 441 |
Search keywords
Usage comparison
Compare the core capabilities of PicDoc and showthe.link
PicDoc Core features
showthe.link Core features
Use cases
PicDoc Use cases
showthe.link Use cases
PicDoc vs showthe.link:In-depth comparison and selection guidance
First decide whether the products solve the same kind of need
This in-depth PicDoc vs showthe.link comparison uses only the product records, taxonomy, audience, traffic, and community signals available on this page. PicDoc is primarily listed under “Infographics”, while showthe.link is primarily listed under “Infographics”, so the first decision is whether your actual task matches their recorded scope.
The structured fields currently show these decision-relevant differences: Pricing (PicDoc: Free; showthe.link: Freemium); Monthly visits (PicDoc: 59.8K; showthe.link: 1.4K); Monthly growth (PicDoc: -36.1%; showthe.link: 195%); Favorites (PicDoc: 129; showthe.link: 127); Website (PicDoc: www.picdoc.cn; showthe.link: showthe.link). These facts are more useful for selection than brand visibility alone.
What market visibility and monthly traffic mean
In the PicDoc vs showthe.link monthly traffic comparison, PicDoc currently shows 59.8K visits and showthe.link shows 1.4K; PicDoc has about 43.9 times the visible traffic of showthe.link, an absolute difference of about 58.5K visits. This reflects visible reach, not feature quality or paid users.
Both tools provide verified traffic details, so monthly trends, visit depth, regions, and acquisition sources can be compared on the same basis.
If public market visibility is an important first-pass criterion, investigate PicDoc first. The final choice should still follow taxonomy, use case, and a real trial because higher traffic does not prove broader capabilities or better workflow fit.
Product positioning, use cases, and roles
PicDoc and showthe.link currently overlap in shared categories: Infographics and Content Creation; shared tags: data visualization, infographic generator, and productivity. This can place both on the same shortlist, but it does not prove equal implementation, depth, or cost.
PicDoc's unique categories/tags are Presentations, ai design, content creation, flowchart tool, presentation maker, text to chart, and visual communication; showthe.link's are Research, Summarizer, AI, content repurposing, education, link summary, marketing, and mind map generator. These unique fields are the strongest differentiators: validate the product whose recorded scope matches the task instead of following traffic alone.
What ratings, comments, and favorites can tell you
PicDoc has no verified rating, 0 comments, 129 favorites, and 122 likes;showthe.link has no verified rating, 0 comments, 127 favorites, and 118 likes。
Neither product has enough rating or comment samples for a credible reputation ranking.
Selection guidance by actual need
When to evaluate PicDoc first
Put PicDoc on the priority trial list when the task aligns with “Infographics” and especially Presentations, ai design, content creation, flowchart tool, presentation maker, and text to chart. This follows recorded positioning and does not imply unlisted capabilities are absent.
PicDoc also currently records: pricing is free, product type is website, 59.8K verified monthly visits, no verified user rating. Verify any hard requirement around price, platform, or reach before trial, and do not let sparse review data substitute for testing.
When to evaluate showthe.link first
Put showthe.link on the priority trial list when the task aligns with “Infographics” and especially Research, Summarizer, AI, content repurposing, education, and link summary. This follows recorded positioning and does not imply unlisted capabilities are absent.
showthe.link also currently records: pricing is freemium, product type is website, 1.4K verified monthly visits, no verified user rating. Verify any hard requirement around price, platform, or reach before trial, and do not let sparse review data substitute for testing.
How to validate the recommendation before deciding
The available data describes positioning, public visibility, and community signals, but it cannot prove output quality, speed, integration effort, privacy, or long-term cost in your workflow. Before deciding, run the same representative tasks in PicDoc and showthe.link, then record completion time, accuracy, manual corrections, and the real paid threshold. A like-for-like trial turns this comparison into a defensible adoption decision.
Comparison FAQ
How should I choose between PicDoc and showthe.link?
Where does this comparison data come from?
What do unknown fields mean?
Related AI tools

graphicinfo
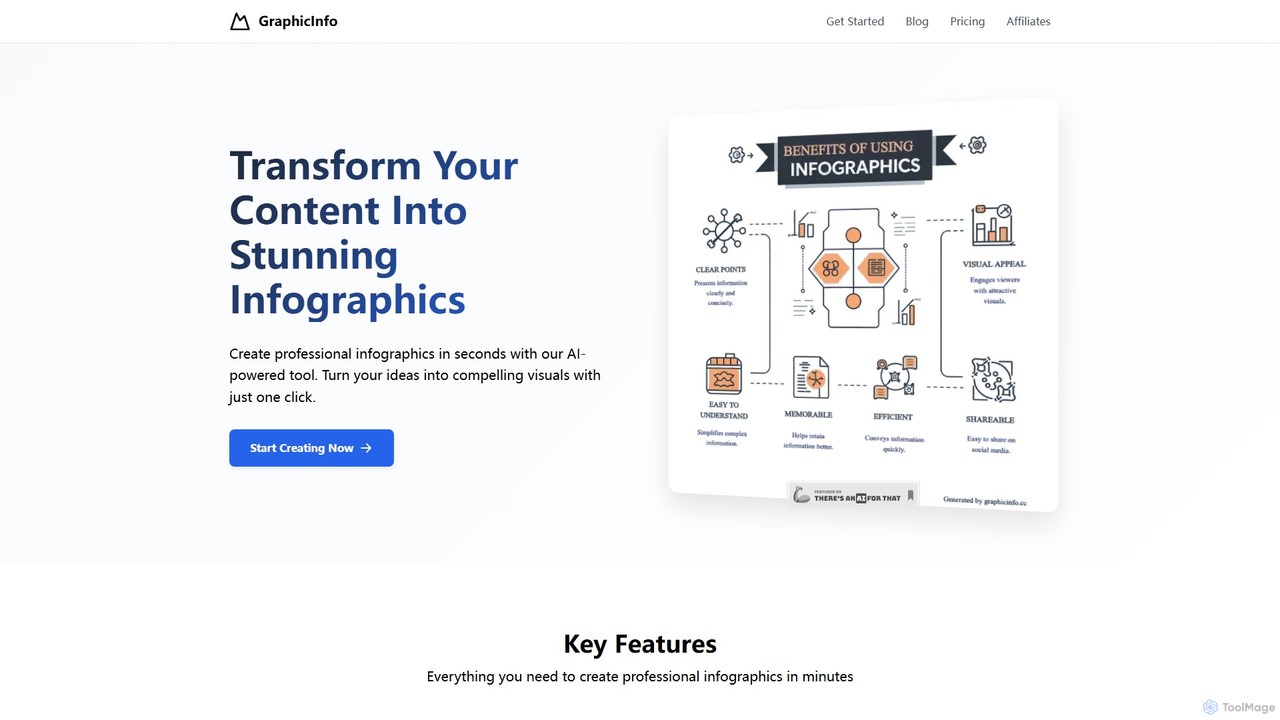
graphicinfo is an AI-powered infographic generator that transforms your text and ideas into stunning, professional visuals in seconds. With just one click, create customizable, data-rich infographics for marketing, education, and business, no design skills required.
Infographics
MyLens
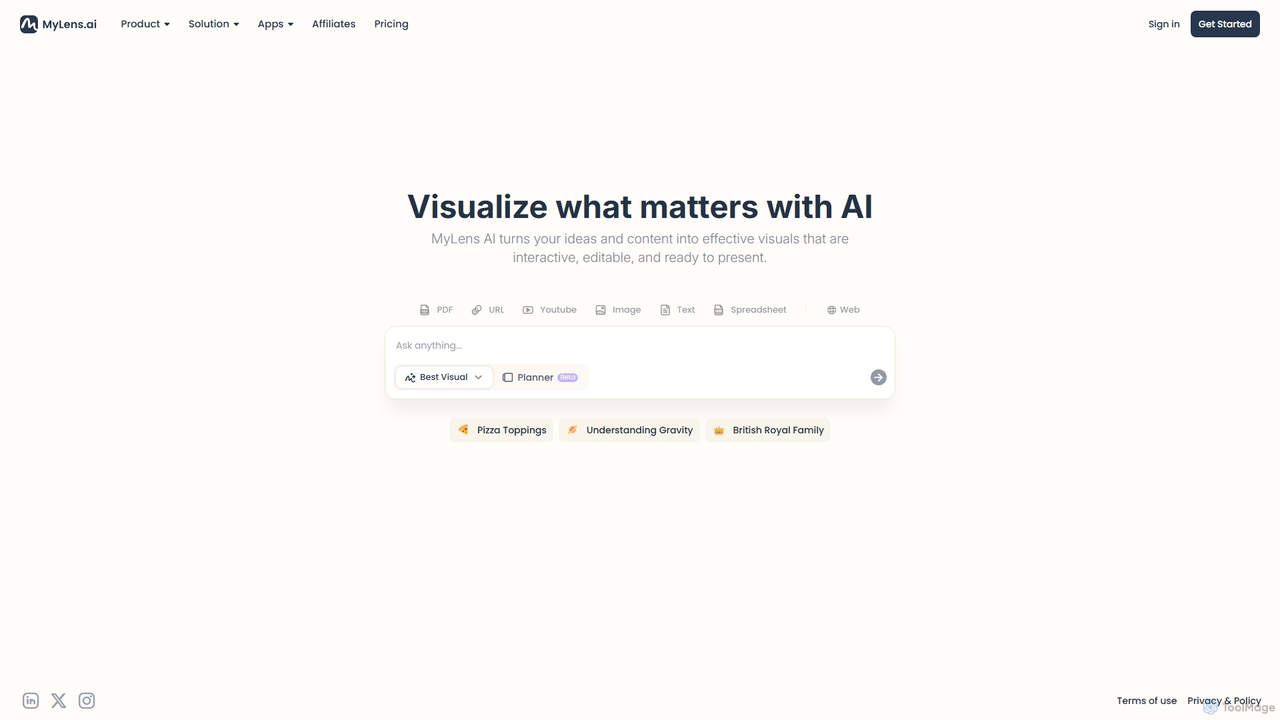
MyLens is an AI-powered visualization platform that transforms your text, data, and ideas into interactive, editable, and presentation-ready visuals. Effortlessly create stunning infographics, charts, diagrams, and presentations to communicate complex information with clarity and impact.
Infographics
Text2Infographic
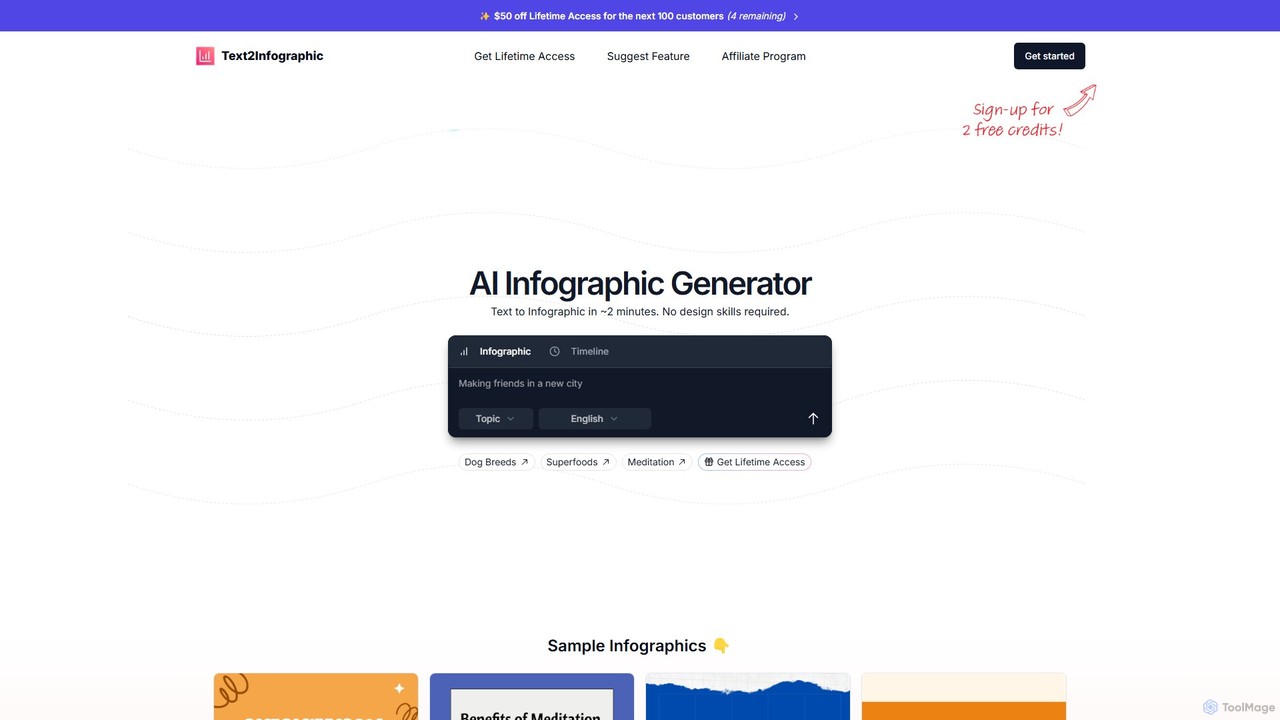
Text2Infographic is an AI-powered generator that transforms text, blog posts, or data into professional-quality infographics in minutes. It automates research, image sourcing, and design, making it ideal for content creators, marketers, and bloggers without design skills. It supports over 20 languages and offers brand customization.

Infographics
infographics.so
infographics.so is an AI-powered tool that instantly transforms text into stunning, professional infographics. It supports various formats like timelines, roadmaps, and funnels, offering full customization to match your brand. Ideal for marketers, project managers, and content creators looking to create engaging visuals for reports, blogs, and presentations in seconds, with no design skills required.
Infographics
Outline Ninja
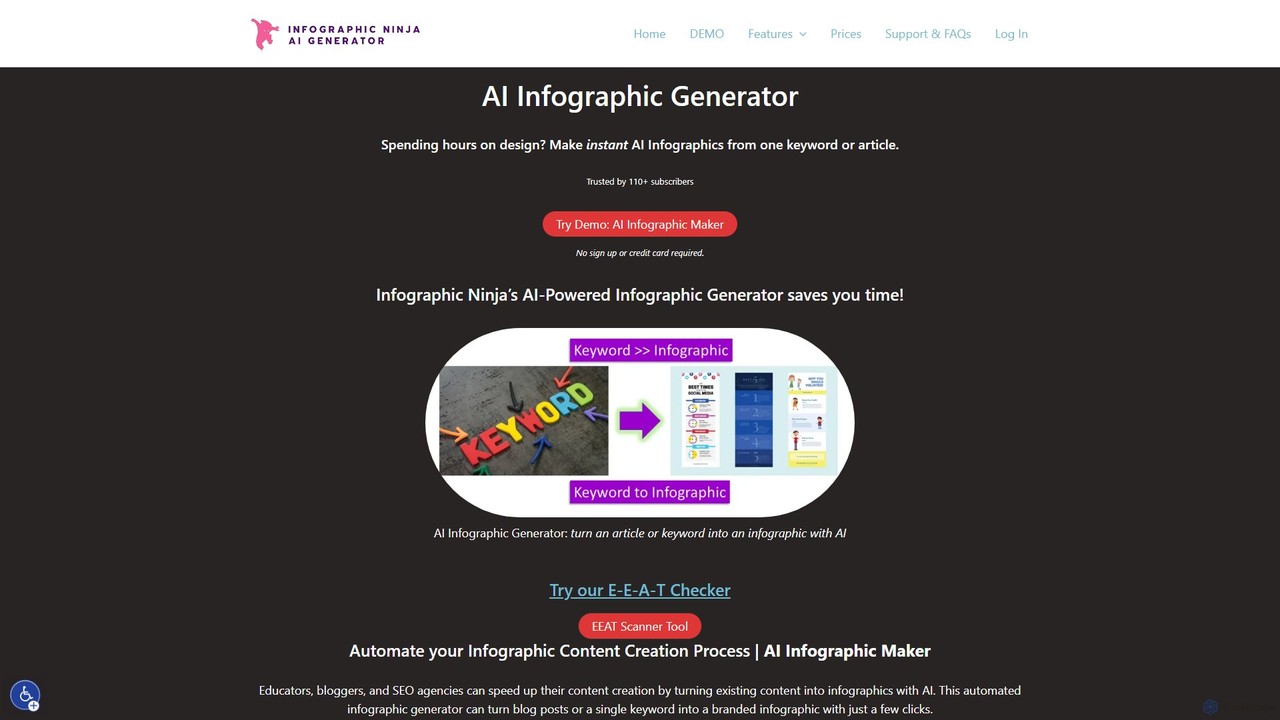
Outline Ninja is a comprehensive AI-powered suite for SEO and content creation. It features an AI Infographic Generator that turns keywords or articles into visuals instantly. The suite also includes an all-in-one topic research tool, a HowTo schema generator, and an E-E-A-T auditor to help bloggers, marketers, and agencies create high-ranking, comprehensive content efficiently.
Summarizing
Infografix
Infografix is an AI-powered infographic generator that transforms simple text prompts into professional-quality visuals. Create stunning charts, diagrams, mind maps, and timelines in seconds without any design skills. Available on web and mobile, it's perfect for marketers, students, and professionals who need to visualize data quickly and effectively.
Infographics
Infography
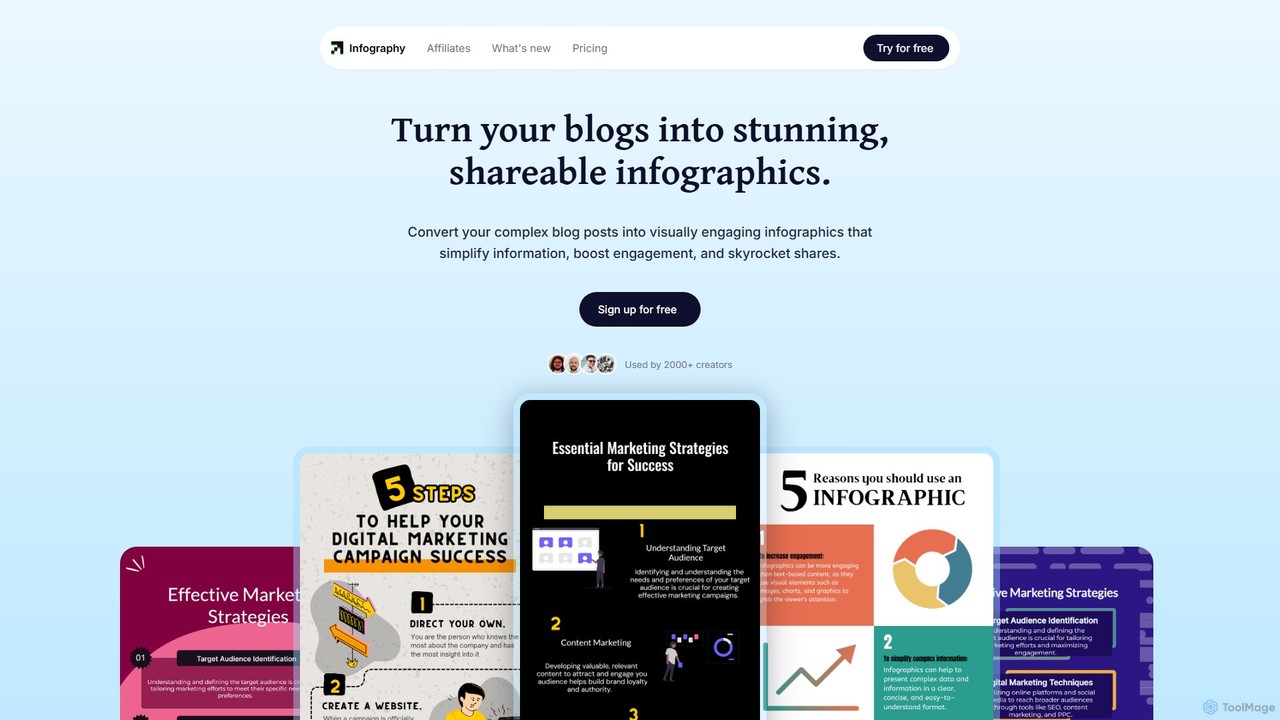
Infography is an AI-powered tool that instantly transforms blog posts, articles, or simple text into stunning, shareable infographics. It simplifies complex information, boosts content engagement, and automates visual creation, making it ideal for marketers, creators, and businesses looking to enhance their content strategy.
Infographics
SlidesAI
SlidesAI is an AI-powered presentation maker that integrates directly into Google Slides and PowerPoint. It instantly transforms your text, documents, or ideas into professionally designed, ready-to-present slides. Save hours of manual work by automatically generating outlines, content, and visuals. It's perfect for educators, professionals, and students who need to create compelling presentations quickly and efficiently, with support for over 100 languages.
Automation
Inboxhiiv
Inboxhiiv is an AI-powered platform for podcast listeners and creators. It delivers personalized summaries, chapter breakdowns, and highlights to listeners' inboxes. For podcasters, it automates content creation by generating transcripts, show notes, newsletters, and social media content from their RSS feed, saving time and boosting audience growth.
Podcast
SmartVisuals
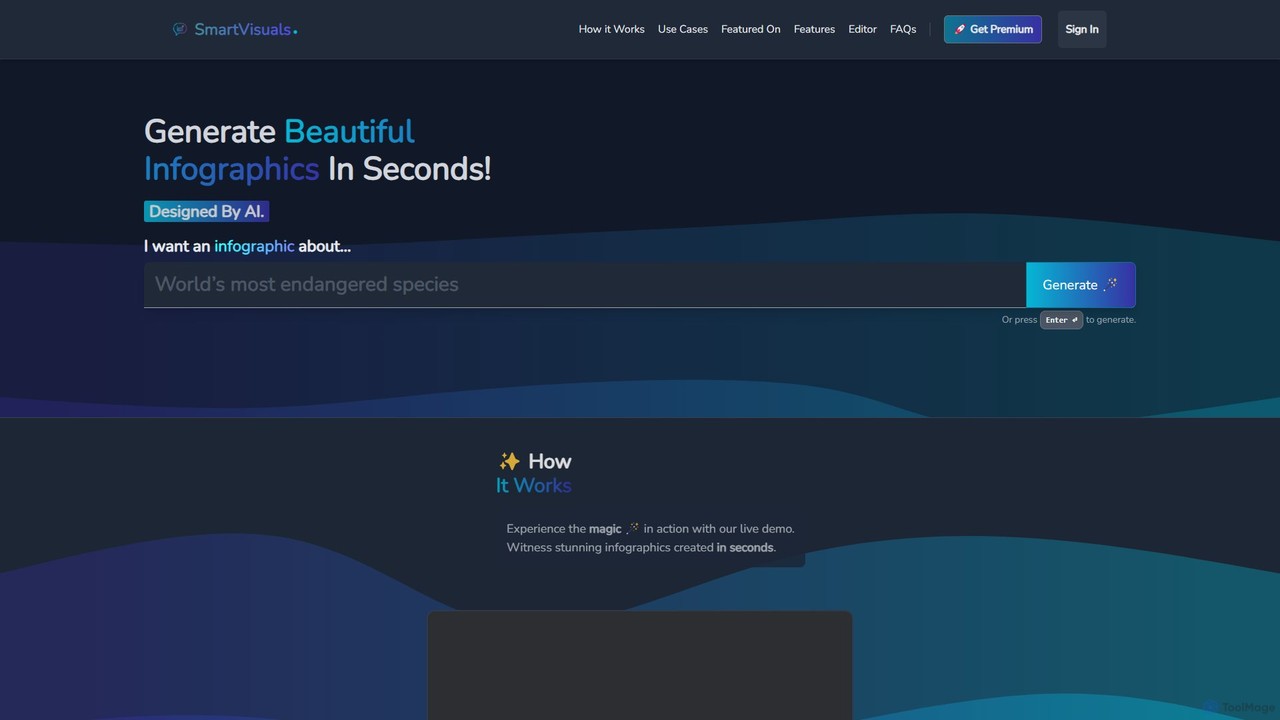
SmartVisuals is an AI-powered infographic generator that transforms text prompts into visually compelling and structured infographics. Simply describe your topic, and the AI will automatically design and populate a professional-looking visual, making complex information easy to understand and share. It's ideal for marketers, educators, students, and professionals who need to create high-quality visuals quickly without any design skills.
Infographics
MyLens
MyLens is an AI-powered visualization tool that transforms your ideas and various content formats—like PDFs, URLs, text, and videos—into clear, interactive, and editable diagrams. With a single click, it helps you understand complex information, brainstorm effectively, and create presentation-ready visuals, acting as your personal visual planner.
Visualization
twitterspacegpt
An AI-powered platform that converts Twitter Spaces into text, summaries, and mind maps. Effortlessly download, transcribe, and analyze audio conversations to save time and unlock key insights from long-form audio content.
Summarization
JustThink
JustThink is a comprehensive, all-in-one AI platform that integrates generative chat, content writing, text-to-speech, AI art, and video creation. It is designed for marketers, educators, content creators, and businesses to enhance productivity, streamline workflows, and foster creativity through a single, collaborative interface.
Image Generation
mapmindai
mapmindai is an AI-powered mind mapping tool that transforms your ideas, notes, and documents into clear, beautiful visual diagrams. Simply provide a central topic or text, and our AI will automatically generate a structured mind map, helping you brainstorm, organize thoughts, and plan projects with unprecedented speed and ease. It's perfect for students, professionals, and creatives looking to unlock their full potential.
Planning
Doc2Q
Doc2Q is an AI-powered tool that transforms documents (PDF, DOCX, images) into various formats like infographics, quizzes, diagrams, and datasets. It operates on a flexible pay-as-you-go credit system, allowing users to convert content quickly and efficiently for marketing, education, or data analysis purposes.
Visualization