VisActor
Visit Website
VisActor Overview
VisActor is a comprehensive, open-source visualization solution developed by ByteDance, designed to empower users to create compelling and narrative-driven data visualizations. It's not just a single tool but a suite of powerful, interoperable components that cater to a wide range of visualization needs, from simple charts to complex, interactive data stories. The core philosophy of VisActor is to go beyond static data representation and enable 'narrative visualization,' where data is presented in a dynamic, engaging, and insightful manner. The project is battle-tested within ByteDance's ecosystem, powering visualizations in popular applications like Douyin (TikTok), Feishu (Lark), and Volcano Engine.
At the heart of the VisActor suite is its intelligent component, VMind, which leverages AI to automate and simplify the visualization process. By understanding data and user intent, VMind can automatically recommend and generate appropriate charts, significantly lowering the barrier for users to create effective visualizations. This makes VisActor a powerful tool for both seasoned developers and users with less technical expertise.
How to use VisActor
As a developer-focused framework, using VisActor typically involves integrating its libraries into a web or application project. The general workflow is as follows:
- Choose the Right Component: Select the appropriate library for your needs. Use VChart for a wide variety of charts, VTable for high-performance, multi-dimensional tables, or VGrammar for building highly customized visualizations from the ground up.
- Installation: Install the chosen package into your project using a package manager like npm or yarn (e.g.,
npm install @visactor/vchart). - Import and Initialize: Import the library into your JavaScript or TypeScript file. Create an instance of the component, linking it to a specific DOM container in your HTML.
- Prepare Data: Structure your data in a format that the library can understand, typically an array of objects.
- Configure the Specification: Define the visualization's appearance and behavior through a JSON-like configuration object. This includes specifying the chart type, data fields, axes, colors, animations, and interactive elements. For AI-powered generation with VMind, you might provide the data and a natural language prompt instead of a full specification.
- Render the Visualization: Call the render method to display the chart or table on your webpage. The components are designed to be responsive and performant across different environments.
Core Features of VisActor
- VMind (Intelligent Visualization): An AI-powered engine that automatically generates chart specifications from data, making visualization creation faster and more intuitive.
- VChart (Storytelling Chart Library): An out-of-the-box, multi-platform chart library that supports a rich variety of chart types, complex compositions, and powerful animations to facilitate data storytelling.
- VTable (High-Performance Table): A high-performance, multi-dimensional data analysis table component capable of rendering millions of data points smoothly, supporting features like pivot tables and custom cell layouts.
- VGrammar (Grammar of Graphics): A flexible and extensible visualization grammar that allows developers to construct a vast range of custom charts and visualizations by combining graphical elements.
- VRender (Rendering Engine): A versatile rendering engine that provides the foundational drawing and animation capabilities for all VisActor components.
- Cross-Platform Compatibility: Built with a 'write once, run anywhere' philosophy, VisActor components seamlessly adapt to desktop browsers, H5 mobile environments, and various mini-app ecosystems.
- Narrative-Driven Animations: A strong focus on meaningful animations and transitions that guide the viewer through the data and highlight key insights, turning static charts into dynamic stories.
Use Cases for VisActor
VisActor's versatility makes it suitable for a wide array of applications:
- Business Intelligence (BI): Building interactive and customizable dashboards for real-time data monitoring and business analysis.
- Large-Screen Data Displays: Creating visually stunning and dynamic data walls for command centers, exhibitions, and corporate presentations.
- Office & Productivity Suites: Embedding rich, interactive charts and tables into documents, reports, and collaborative platforms like Feishu.
- Digital Journalism & Content Creation: Producing animated and narrative-driven infographics for articles and videos to explain complex data in an accessible way.
- Scientific and Academic Research: Presenting research data and findings through clear, accurate, and publication-quality visualizations.
Advantages of VisActor
VisActor stands out due to several key advantages:
- Open Source: Being fully open-source, it is free to use, modify, and distribute, fostering a collaborative community.
- Comprehensive Ecosystem: It provides a complete, integrated solution, from rendering to intelligent generation, eliminating the need to piece together multiple third-party libraries.
- AI-Powered Efficiency: The VMind component democratizes data visualization, allowing users to generate charts from simple descriptions, saving time and effort.
- Proven Performance and Reliability: It is hardened by its use in massive-scale applications within ByteDance, ensuring high performance and stability.
- Focus on Storytelling: It uniquely prioritizes narrative, equipping developers with the tools to create visualizations that don't just show data but also tell a story.
Pricing and Plans
VisActor is a completely free and open-source project. It is available on GitHub and can be used without any licensing fees or subscriptions in both personal and commercial projects, subject to the terms of its open-source license.
VisActor Comments (0)
Log in to post comments
Log in nowVisActorWebsite Traffic Analysis
Latest Traffic
Status
Monthly Traffic Trend
Geography
Top 5 Countries/Regions
-
🇨🇳 China85.43%
-
🇻🇳 Vietnam6.65%
-
🇺🇸 United States3.52%
-
🇰🇷 Korea, Republic of2.38%
-
🇸🇬 Singapore2.02%
Traffic source
| Source Type | Percentage |
|---|---|
|
Direct Access
|
79.22% |
|
Referral
|
20.78% |
Popular Keywords
| Keyword | Cost Per Click |
|---|---|
|
$0.00
|
|
|
$0.00
|
|
|
$0.00
|
|
|
$0.00
|
|
|
$5.41
|
VisActor Alternatives
View All
vizbox
vizbox is an AI-powered data visualization platform that transforms raw data into insightful charts, graphs, and interactive dashboards. …
vizbox is an AI-powered data visualization platform that transforms raw data into insightful charts, graphs, and interactive dashboards. Users can simply upload data or use natural language prompts to generate compelling visuals, making data analysis accessible to everyone, regardless of technical skill.
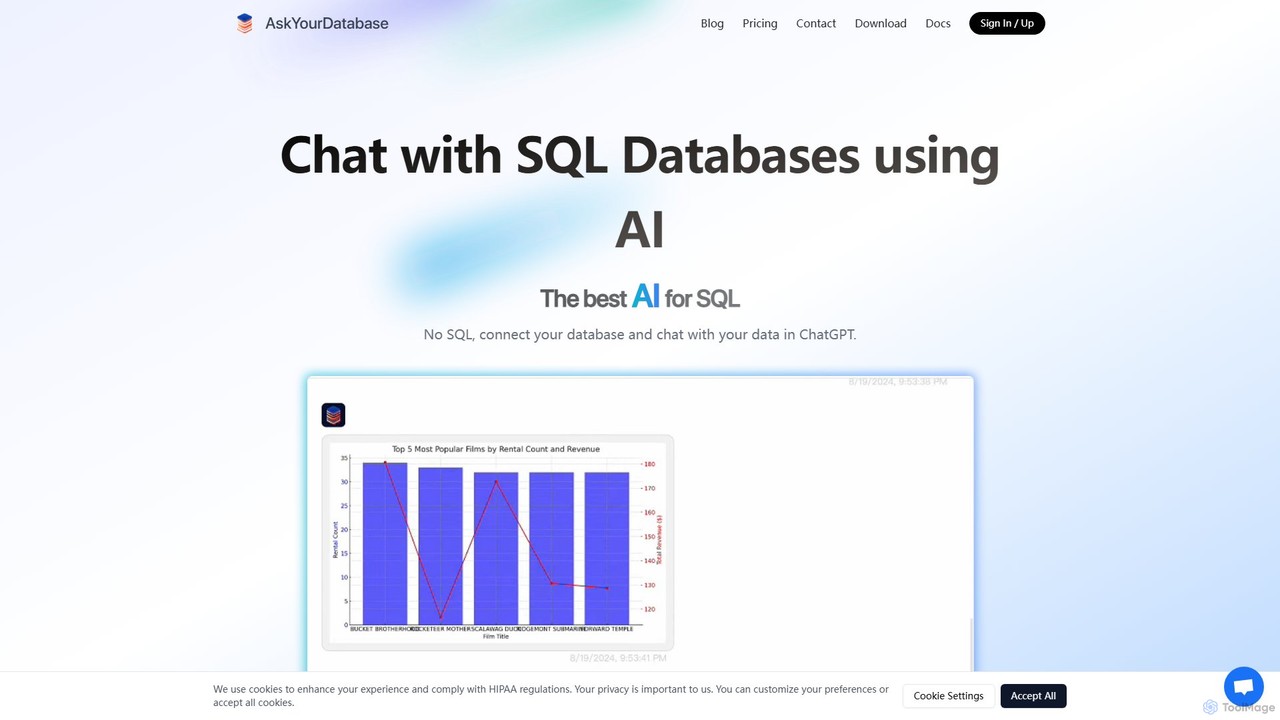
AskYourDatabase
AskYourDatabase is a powerful AI SQL assistant that allows you to interact with your databases using natural language. …
AskYourDatabase is a powerful AI SQL assistant that allows you to interact with your databases using natural language. Query data, create visualizations, and build interactive dashboards without writing a single line of SQL. It supports various databases, offers both desktop and embeddable chatbot versions, and prioritizes data security with on-premise deployment options.
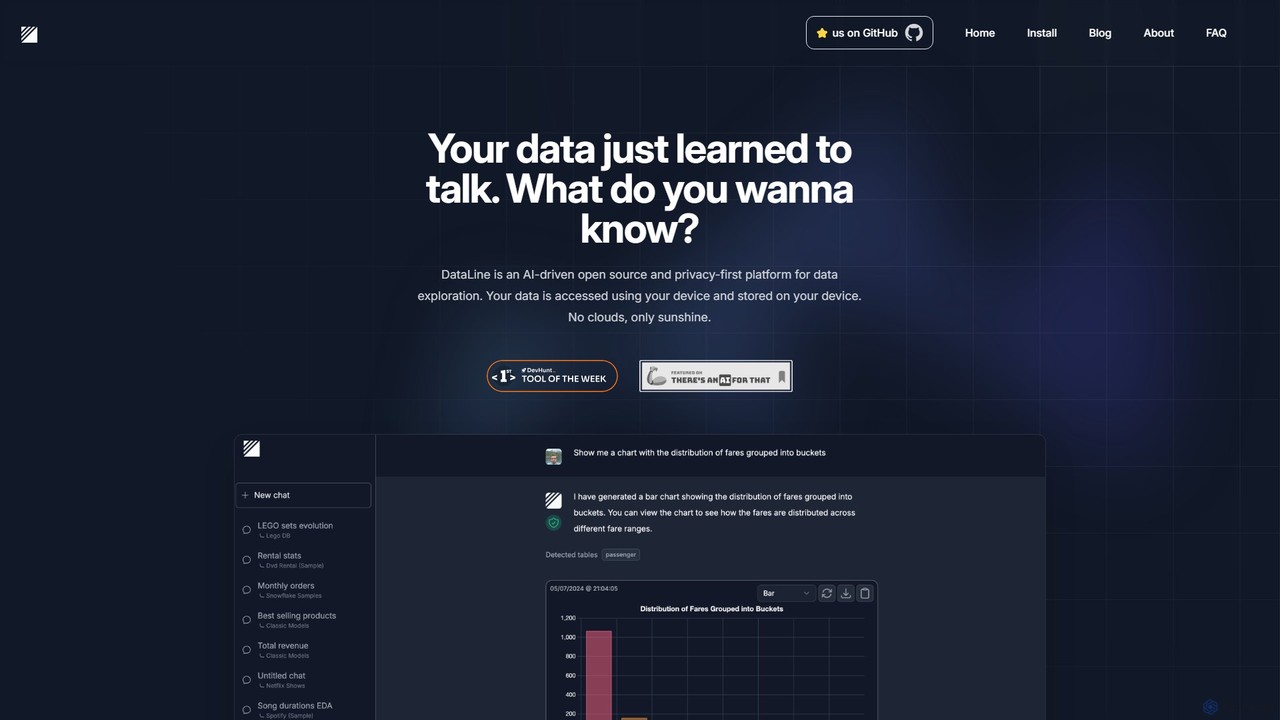
DataLine
DataLine is an open-source, privacy-first AI platform that allows you to explore your data through natural language. Securely …
DataLine is an open-source, privacy-first AI platform that allows you to explore your data through natural language. Securely connect to your databases and files, ask questions, and get instant insights and visualizations without your data ever leaving your machine.
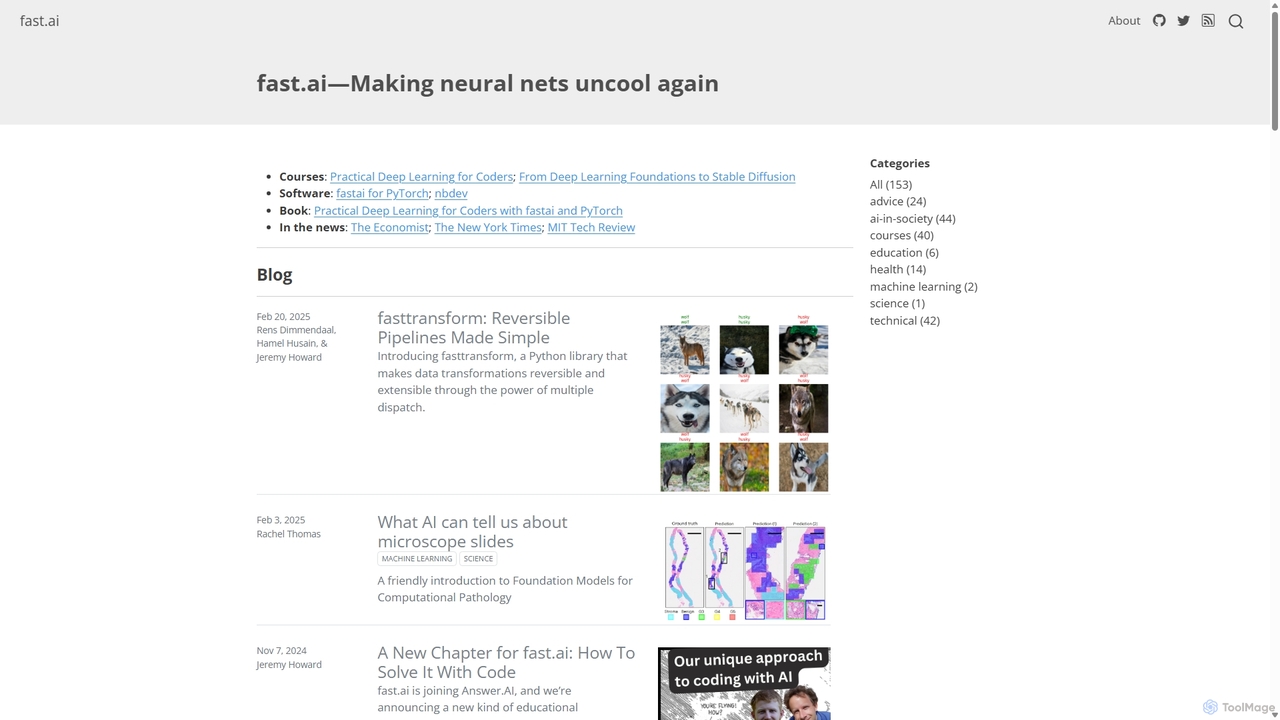
Fast.ai
Fast.ai is a research institute dedicated to making deep learning accessible to everyone. It offers free courses, an …
Fast.ai is a research institute dedicated to making deep learning accessible to everyone. It offers free courses, an open-source software library (fastai), cutting-edge research, and a vibrant community, empowering coders of all backgrounds to become deep learning practitioners.
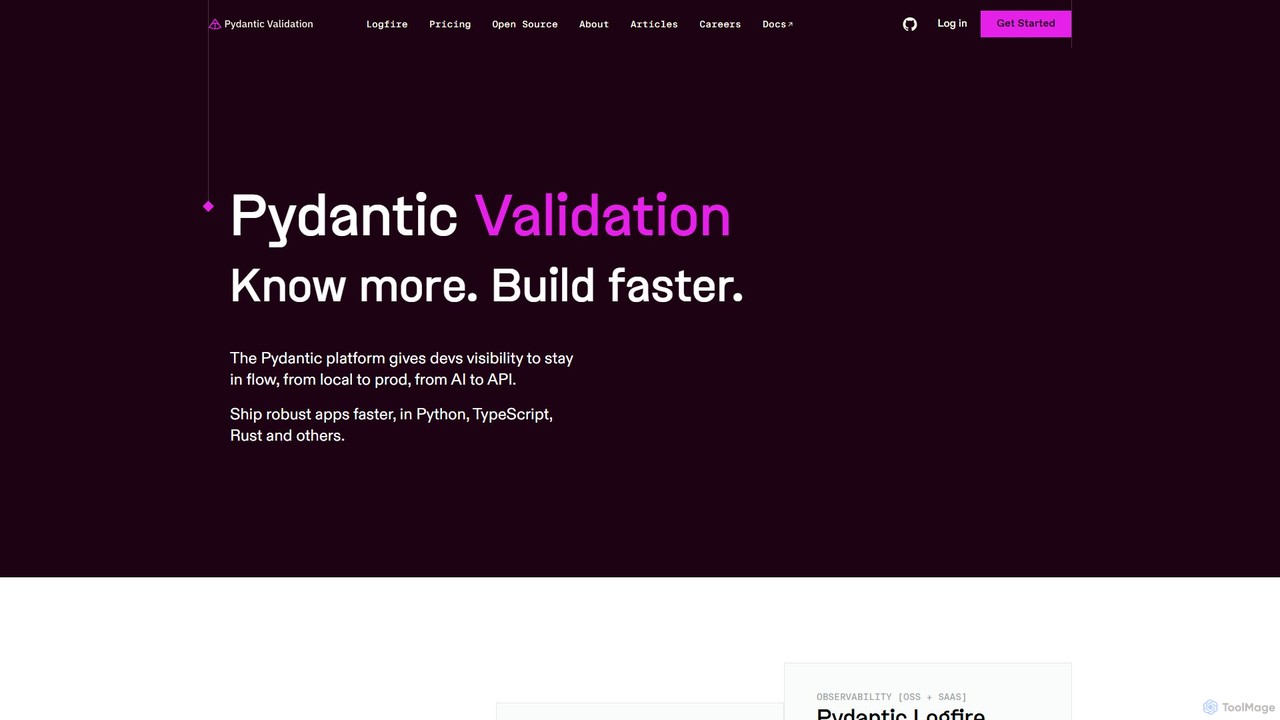
Pydantic
Pydantic is a comprehensive platform for developers, offering powerful data validation, AI development tools, and a full-stack observability …
Pydantic is a comprehensive platform for developers, offering powerful data validation, AI development tools, and a full-stack observability solution. It enables faster, more robust application development in Python and other languages by leveraging type hints for runtime data validation and providing deep insights from local development to production.
NeoBase
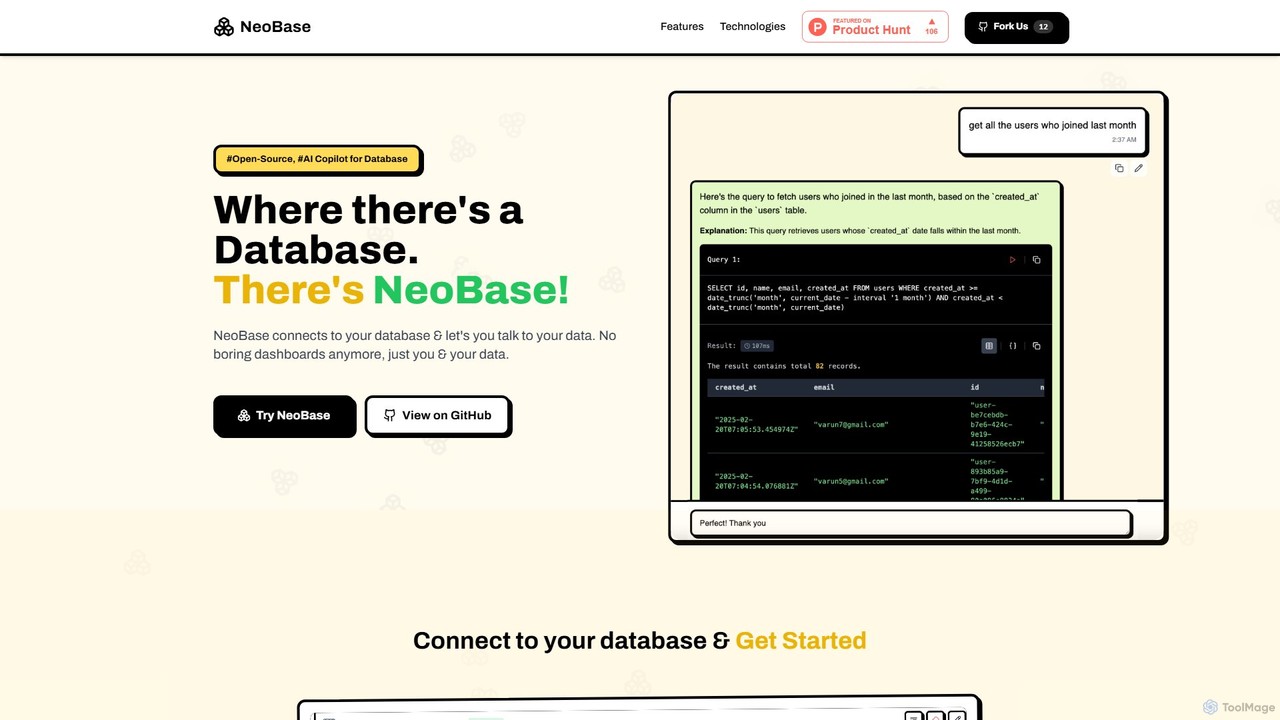
NeoBase is an open-source AI copilot for databases, enabling users to interact with their data using natural language. …
NeoBase is an open-source AI copilot for databases, enabling users to interact with their data using natural language. It connects to various SQL and NoSQL databases, translates plain English queries into optimized code, and visualizes the results. Designed for both technical and non-technical users, it streamlines data analysis, debugging, and reporting, eliminating the need for complex query writing and providing full data control through self-hosting.
SQL Chat
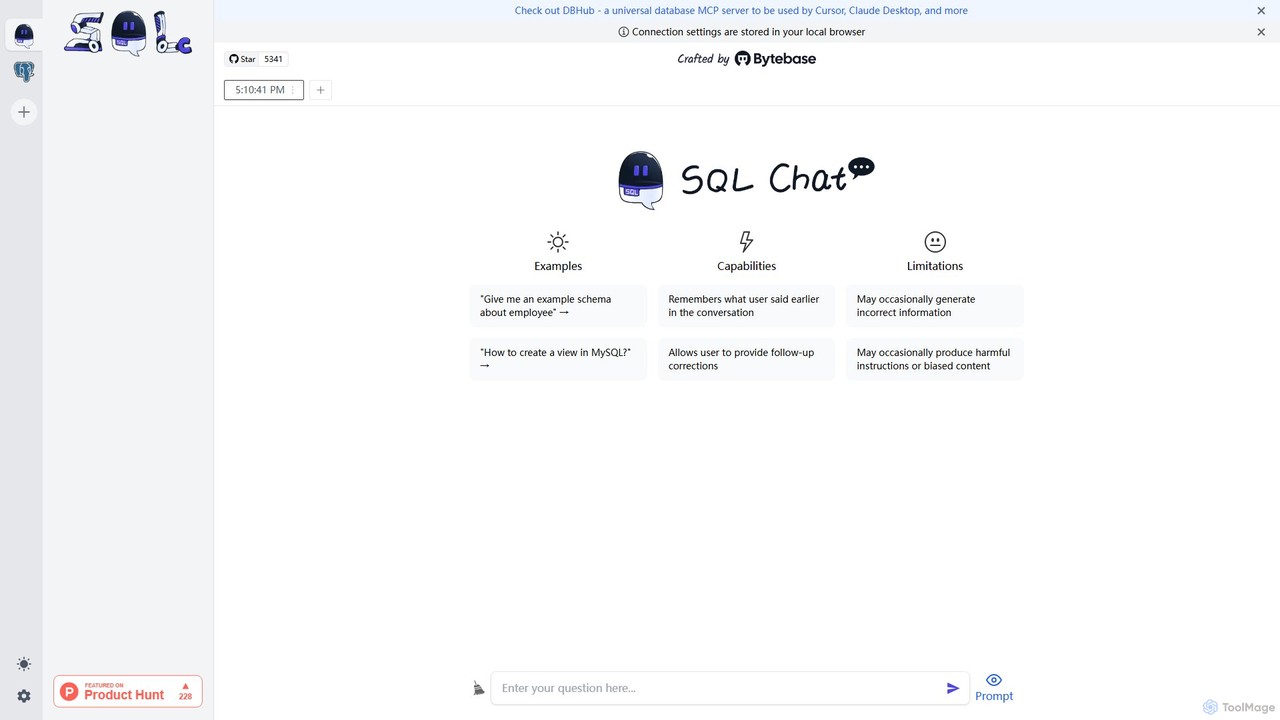
SQL Chat is an open-source, chat-based SQL client and editor that uses AI to translate natural language questions …
SQL Chat is an open-source, chat-based SQL client and editor that uses AI to translate natural language questions into SQL queries. Connect to your database, ask questions in plain English, and get results instantly, democratizing data access for both technical and non-technical users.
Minusx
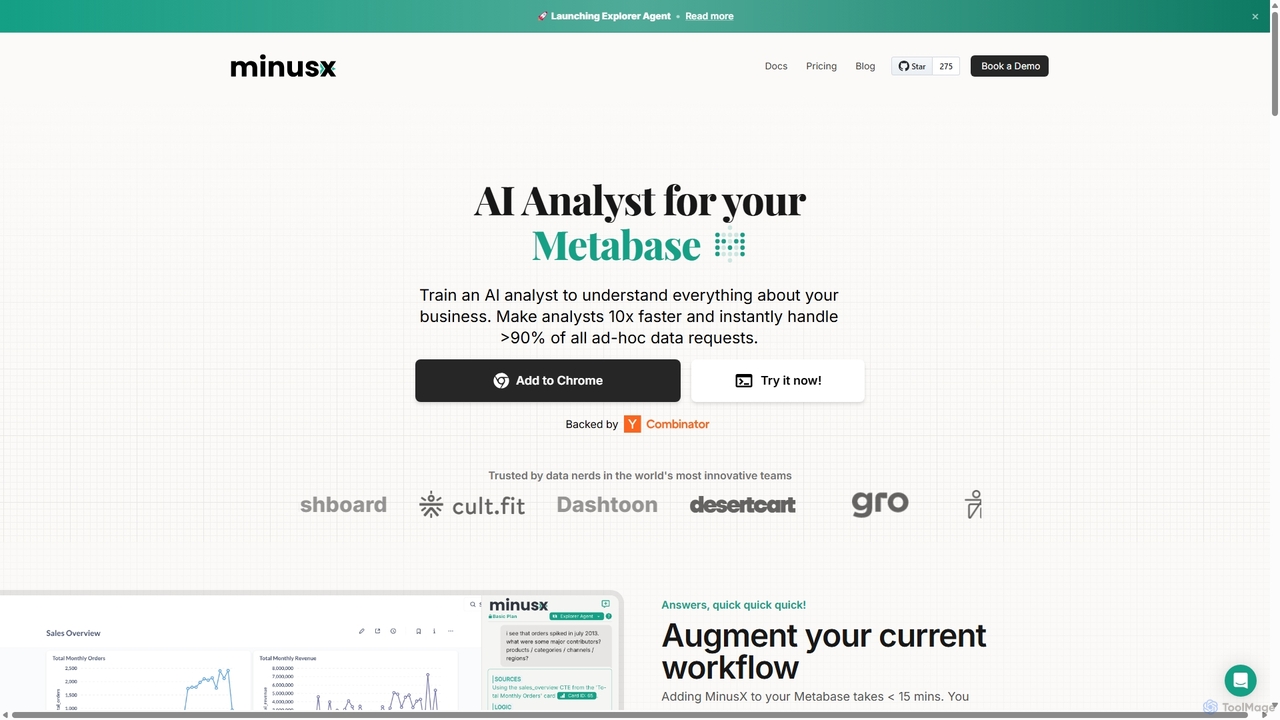
Minusx is an AI data analyst designed to integrate seamlessly with Metabase. It empowers data analysts, business users, …
Minusx is an AI data analyst designed to integrate seamlessly with Metabase. It empowers data analysts, business users, and executives to query data using natural language, handling over 90% of ad-hoc requests instantly. By acting as a Chrome extension within your existing workflow, Minusx enhances productivity, codifies business knowledge through 'Context Engineering', and provides quick, accurate insights directly from your dashboards and reports, all while ensuring data security.

Textify Analytics
Textify Analytics is an AI-powered data analysis platform that transforms raw text and numerical data into actionable insights. …
Textify Analytics is an AI-powered data analysis platform that transforms raw text and numerical data into actionable insights. Designed for students, analysts, and businesses, it offers intuitive tools for market research, recruiting intelligence, and data-driven decision-making, supported by a vast database of charts and analytics.

Graphitup
Graphitup is an AI-powered data visualization tool that transforms raw data from Excel or Google Sheets into stunning, …
Graphitup is an AI-powered data visualization tool that transforms raw data from Excel or Google Sheets into stunning, on-brand charts and interactive dashboards. It offers robust theming, extensive customization, and easy publishing options, enabling businesses and creators to tell compelling data stories and build lasting digital assets.
VisActor Category
VisActor Tag
VisActor AI Tool Comparison
VisActor Embed Feature
Just copy the embed code below and paste this beautiful badge on your blog, article, or official app website to drive traffic directly to this tool's detail page and quickly boost your exposure and user count!

No comments yet, be the first to comment!