
SentinelQA
SentinelQA is an AI-powered test intelligence platform designed to help developers and QA engineers fix CI/CD failures faster. …
SentinelQA is an AI-powered test intelligence platform designed to help developers and QA engineers fix CI/CD failures faster. It analyzes test runs to automatically identify flaky tests, detect regressions, and provide clear AI-generated summaries and actionable insights.
Unfold AI
Unfold AI is an all-in-one AI coding assistant designed for developers. It integrates into your IDE to provide …
Unfold AI is an all-in-one AI coding assistant designed for developers. It integrates into your IDE to provide real-time error and bug solutions, generate code from natural language, and complete code snippets. A key feature is its ability to be trained on your private codebase for highly customized and accurate assistance across 20+ programming languages.
Parea AI
Parea AI is an end-to-end platform for developing, testing, and monitoring LLM applications. It provides tools for experiment …
Parea AI is an end-to-end platform for developing, testing, and monitoring LLM applications. It provides tools for experiment tracking, observability, evaluation, and human annotation to help teams confidently ship AI systems to production.
Tropir
Tropir is the first autonomous LLM-Ops engineer, designed to help developers build, debug, and optimize complex AI and …
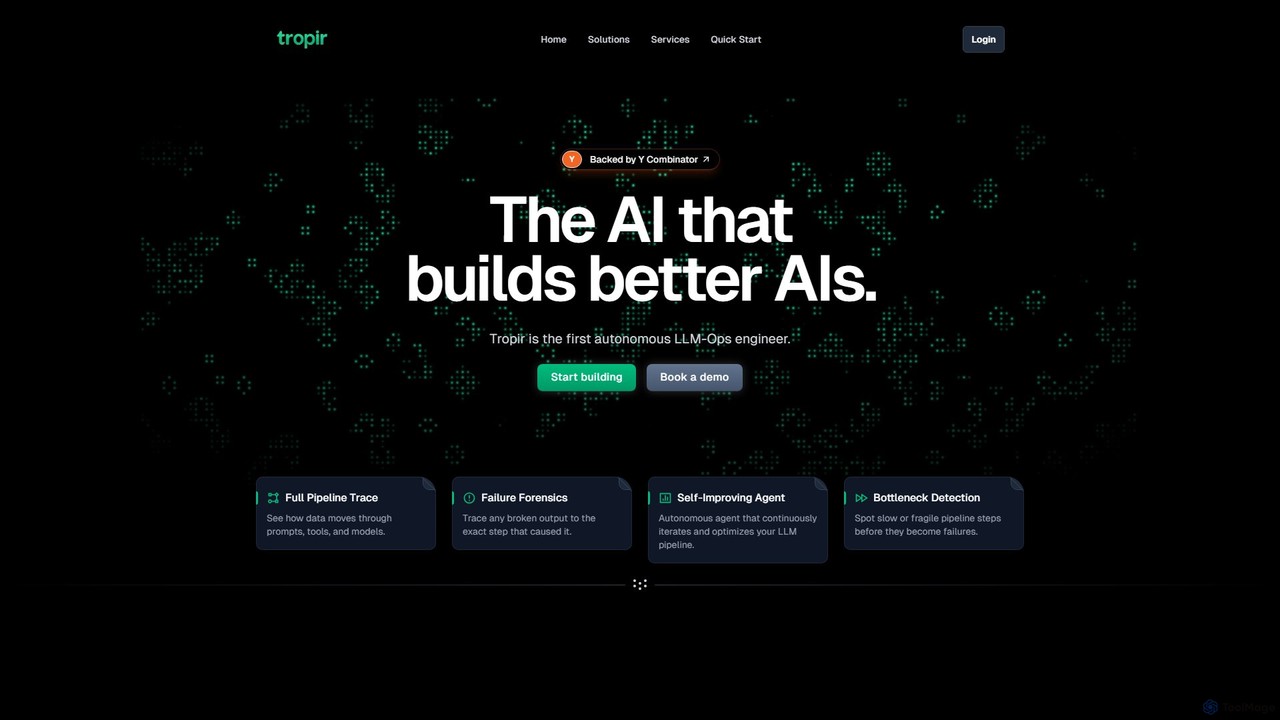
Tropir is the first autonomous LLM-Ops engineer, designed to help developers build, debug, and optimize complex AI and LLM applications. It provides full pipeline tracing, failure forensics, and a self-improving agent to enhance AI performance and reliability.
Captum
Captum is an open-source model interpretability and explainability library for PyTorch. It provides state-of-the-art algorithms to help developers …
Captum is an open-source model interpretability and explainability library for PyTorch. It provides state-of-the-art algorithms to help developers and researchers understand which features influence a model's predictions. Supporting multi-modal data like text, vision, and more, Captum makes it easy to debug models, improve transparency, and benchmark new interpretability techniques within the PyTorch ecosystem.
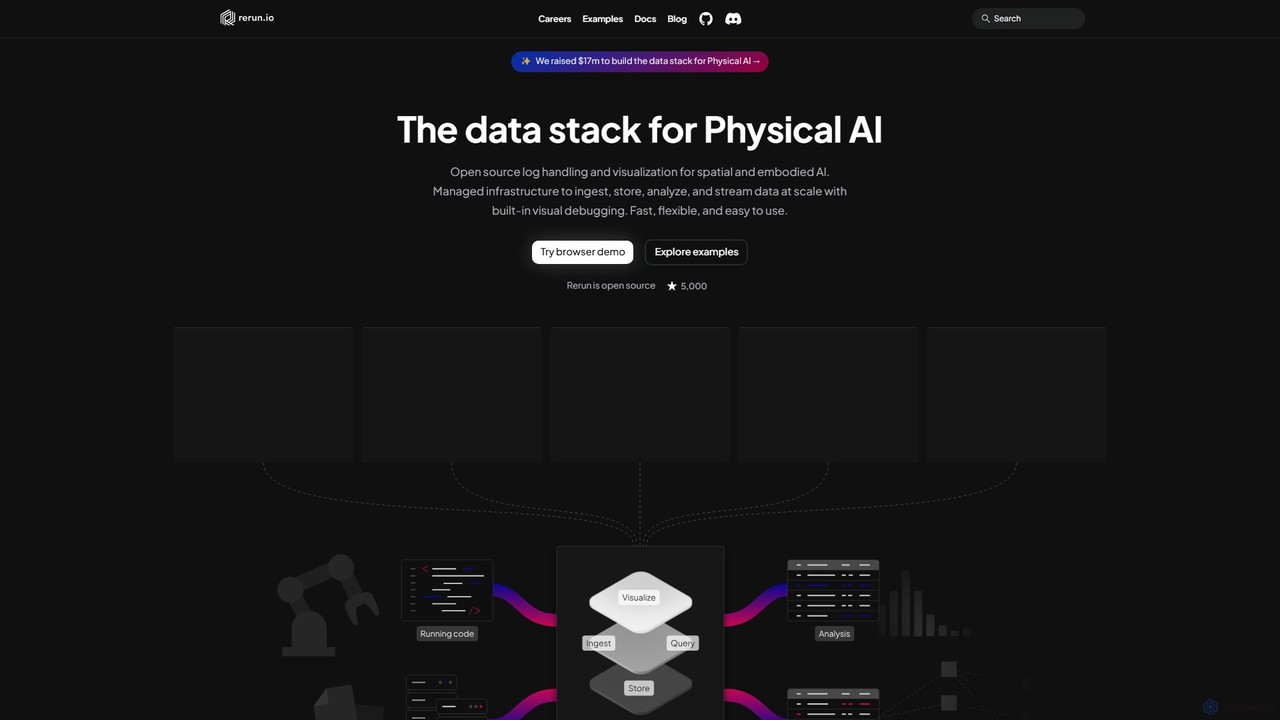
Rerun
Rerun is an open-source data stack for Physical AI, providing powerful logging and visualization tools for multimodal, time-series …
Rerun is an open-source data stack for Physical AI, providing powerful logging and visualization tools for multimodal, time-series data. Designed for robotics, computer vision, and spatial computing, it helps developers understand and debug complex systems with SDKs for Python, Rust, and C++.
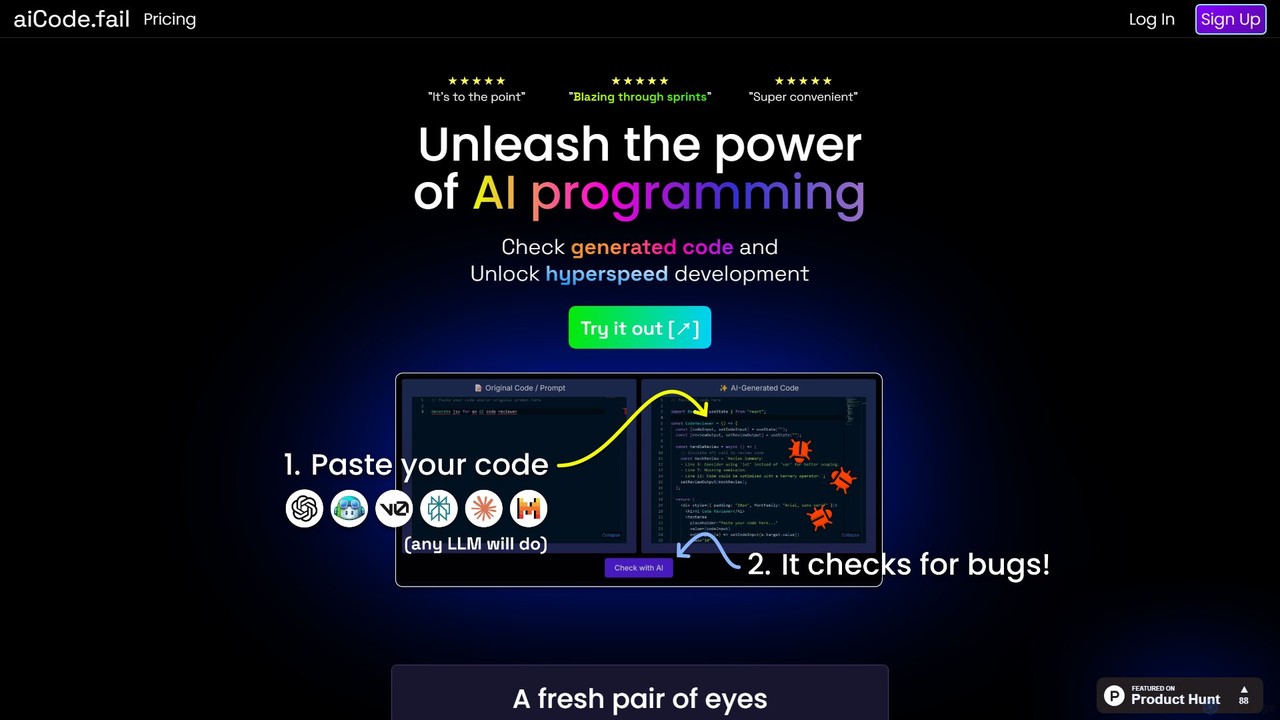
aiCode.fail
aiCode.fail is a specialized AI-powered code checker designed to audit, debug, and secure code generated by LLMs like …
aiCode.fail is a specialized AI-powered code checker designed to audit, debug, and secure code generated by LLMs like GPT. It acts as a critical 'second pair of eyes' to detect hallucinations, expose security vulnerabilities, and accelerate the development process for any programming language, ensuring higher code quality and reliability.
About Debugging
AI Debugging tools are a class of software that leverages artificial intelligence to help developers identify, analyze, and resolve errors in code. These tools utilize machine learning models to understand code context, interpret complex error logs, and suggest potential fixes. Their primary value lies in significantly accelerating development cycles by reducing the time spent on manual troubleshooting and root cause analysis. By providing intelligent insights, they empower developers to fix bugs faster and write more reliable code.
Core Features
- Automated Root Cause Analysis: Intelligently analyzes stack traces, logs, and application state to pinpoint the origin of an error automatically.
- Context-Aware Fix Suggestions: Provides relevant code snippets and repair strategies based on the specific error and surrounding code.
- Natural Language Querying: Allows developers to describe a problem in plain English and receive diagnostic information or solutions.
- Predictive Bug Detection: Analyzes code changes before they are committed to forecast and prevent potential bugs from entering production.
- Anomaly Detection in Logs: Monitors application logs in real-time to identify unusual patterns or error spikes that may indicate a hidden issue.
Use Cases
AI Debugging tools are primarily used by software developers, DevOps engineers, and Site Reliability Engineers (SREs). They are invaluable in complex environments like microservices architectures, large-scale enterprise applications, and real-time data processing systems. For instance, a developer can use them to quickly understand a bug in an unfamiliar legacy codebase, or an SRE can diagnose a critical production failure by analyzing terabytes of logs in minutes.
How to Choose
When selecting an AI Debugging tool, consider the following: First, evaluate its language and framework support to ensure it aligns with your tech stack. Second, check its integration capabilities with your existing IDE, version control system (like Git), and CI/CD pipeline. Third, assess the depth of its analysis—whether it's limited to static code or includes runtime analysis and log monitoring. Finally, review its security policies and deployment options (cloud vs. on-premise) to protect your proprietary code.
DebuggingUse Cases
Diagnose Critical Production Failures
A Site Reliability Engineer (SRE) receives an alert for a critical failure in a live e-commerce application during peak traffic. Instead of manually sifting through millions of log entries from multiple microservices, the SRE feeds the error data into an AI Debugging tool. The tool analyzes patterns across distributed logs, correlates events, and identifies the root cause within minutes: a specific database query timing out under heavy load. It also suggests an optimized query and recommends adding a specific index to the database, reducing the Mean Time To Resolution (MTTR) from hours to minutes and preventing revenue loss.
Accelerate Developer Onboarding
A junior developer joins a team and is tasked with fixing a bug in a large, unfamiliar legacy codebase. They struggle to understand the complex logic and data flow. Using an AI Debugging tool with a natural language interface, they can ask questions like, 'Explain the purpose of this function' or 'Trace the execution path for this user request.' The AI provides clear, concise explanations and visualizations of the code's behavior, dramatically reducing the time it takes for the new developer to become productive and confidently contribute to the project.
Proactively Prevent Bugs in CI/CD Pipelines
A DevOps team integrates a predictive AI Debugging tool into their Continuous Integration/Continuous Deployment (CI/CD) pipeline. When a developer submits a pull request, the AI tool automatically scans the code changes. It analyzes the complexity, dependencies, and historical bug data related to the modified files. The tool then flags a specific change as having a high probability of introducing a performance regression. It provides a detailed report to the developer before the code is merged, allowing them to address the potential issue proactively, thus preventing a costly bug from ever reaching production.
Optimize Application Performance Bottlenecks
A performance engineer is tasked with improving the response time of a web service. Traditional profiling tools show high CPU usage but don't pinpoint the exact cause. The engineer uses an AI Debugging tool that analyzes runtime traces and resource consumption patterns. The AI identifies an inefficient algorithm in a data processing module that causes excessive object allocations and garbage collection cycles. It highlights the specific lines of code and suggests a more efficient, memory-friendly alternative, enabling the engineer to resolve a subtle performance issue that was difficult to detect with standard tools.
Simplify Debugging of Asynchronous Code
A backend developer is troubleshooting a bug in a microservices architecture where a user action triggers a chain of asynchronous events across multiple services. Tracing the request manually is complex and time-consuming. By using an AI Debugging tool with distributed tracing capabilities, the developer gets a unified view of the entire transaction. The AI visualizes the flow of the request, highlights latency between service calls, and pinpoints the exact service where an error occurred. It correlates the error with a specific log message, providing the full context needed to fix the bug quickly.
Improve Code Quality During Code Reviews
A senior developer is conducting a code review for a feature submitted by a team member. Instead of just relying on manual inspection, they use an AI Debugging assistant integrated into their Git platform. The AI tool automatically flags potential issues such as null pointer exceptions, resource leaks, and inefficient loops that might have been missed. It provides explanations for each issue and suggests best-practice alternatives. This allows the reviewer to focus on higher-level logic and architectural concerns, making the code review process faster, more thorough, and a valuable learning experience for the entire team.