Graphy
vs
thebricks
A comprehensive comparison of the core features, performance, user experience, and pricing strategies of two excellent AI tools
Providing objective and detailed selection advice based on real data and user feedback
Overview
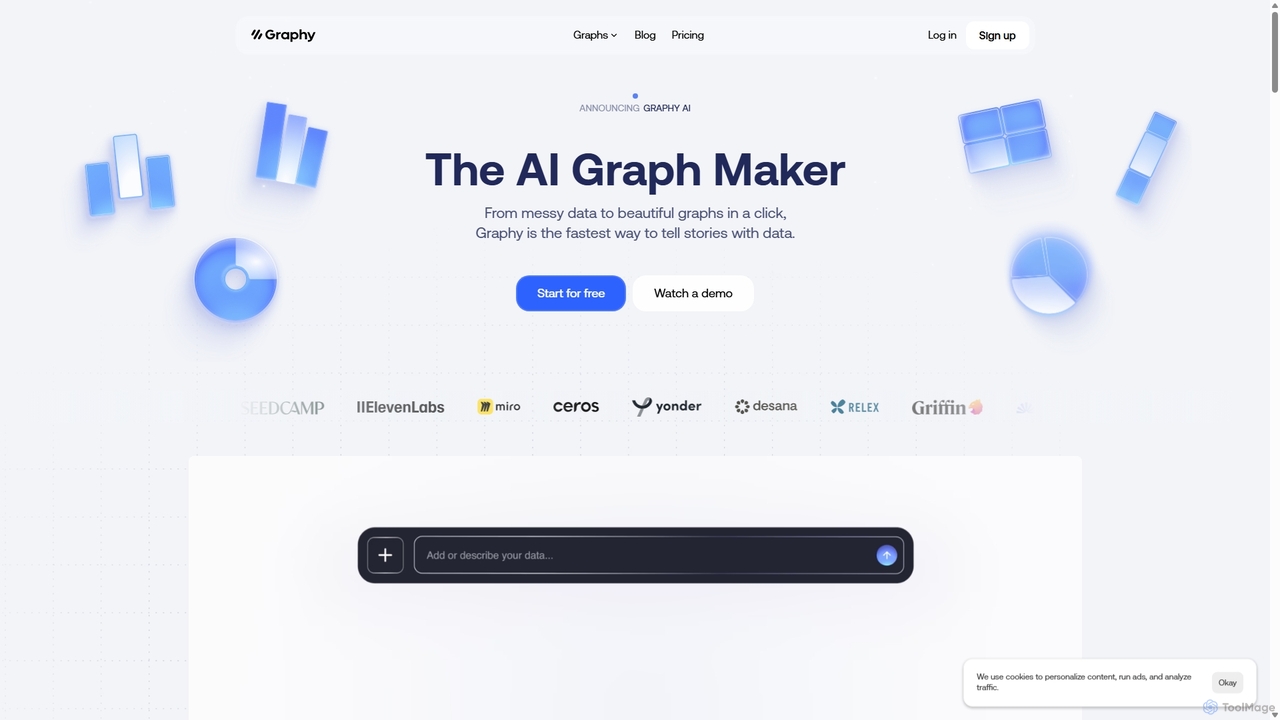
Graphy Overview
Transform messy data into stunning, interactive graphs with Graphy's AI. Connect Google Sheets, upload CSVs, or chat with your data to create compelling visual stories for reports, presentations, and social media. Start for free.
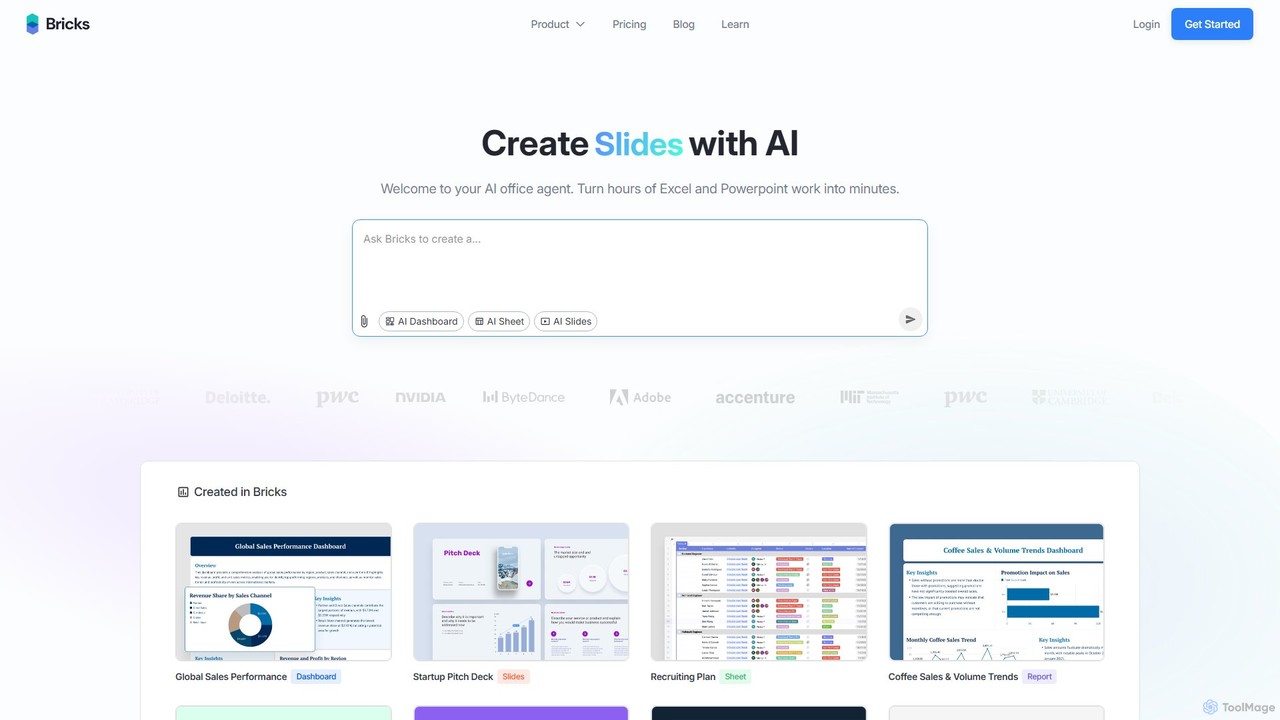
thebricks Overview
Discover thebricks, the all-in-one AI workspace to create spreadsheets, dashboards, and slides with natural language. Analyze data, build reports, and collaborate instantly. Try it for free.
Detailed Feature Comparison
Comprehensive comparison of the core features and characteristics of two AI tools
| Features | Graphy | thebricks |
|---|---|---|
| Main Categories | 3D | Spreadsheets |
| Inclusion Date | 2025-09-20 | 2025-08-11 |
| Pricing Type | Freemium | Freemium |
| Official Website | https://graphy.app/ | https://www.thebricks.com/ |
| Tool Type | Website | Website |
| Performance Data | ||
| User Rating | No Rating Yet | No Rating Yet |
| User Reviews | 0 reviews | 0 reviews |
| Monthly Visits | 200.4K | 329.3K |
| Details | View Details | View Details |
Compare Traffic / Monthly Visits
Graphy's traffic
Graphy Current monthly visible visits are 200.4K.
Latest Traffic
Monthly Traffic Trend
Geography
Top 5 Countries/Regions
| Country/Region | Percentage | Traffic |
|---|---|---|
|
🇺🇸
United States
|
43.78% | 87.7K |
|
🇮🇳
India
|
28.30% | 56.7K |
|
🇷🇺
Russia
|
10.25% | 20.5K |
|
🇰🇷
Korea, Republic of
|
9.54% | 19.1K |
|
🇬🇧
United Kingdom
|
8.13% | 16.3K |
Traffic source
| Source Type | Percentage | Traffic |
|---|---|---|
|
Direct Access
|
85.86% | 172.0K |
|
Referral
|
11.37% | 22.8K |
|
Email
|
2.77% | 5.5K |
Popular Keywords
thebricks's traffic
thebricks Current monthly visible visits are 329.3K.
Latest Traffic
Monthly Traffic Trend
Geography
Top 5 Countries/Regions
| Country/Region | Percentage | Traffic |
|---|---|---|
|
🇺🇸
United States
|
54.37% | 179.0K |
|
🇨🇦
Canada
|
18.20% | 59.9K |
|
🇮🇳
India
|
13.43% | 44.2K |
|
🇬🇧
United Kingdom
|
7.54% | 24.8K |
|
🇵🇭
Philippines
|
6.46% | 21.3K |
Traffic source
| Source Type | Percentage | Traffic |
|---|---|---|
|
Direct Access
|
79.88% | 263.0K |
|
Referral
|
18.49% | 60.9K |
|
Email
|
1.63% | 5.4K |
Popular Keywords
Usage Comparison
Compare Graphy and thebricks 's Advantages
Graphy's Core Features
thebricks's Core Features
Use Cases
Understand the specific application scenarios and functional characteristics of the two AI tools
Graphy Use Cases
thebricks Use Cases
Applicable Job
Learn which professions and roles are suitable for using these two AI tools
Graphy Applicable Job
thebricks Applicable Job
No relevant career information available
Graphy vs thebricks:In-depth Comparison Analysis and Selection Recommendations
Comprehensive comparison and evaluation based on real data and user feedback
Market Performance and User Preference Analysis
- Core positioning: Graphy leans more toward 3D, while thebricks leans more toward Spreadsheets.
- Traffic Signal: thebricks currently has higher monthly traffic, serving as a reference for market attention.
- Neither tool has reviewed ratings yet; it is recommended to prioritize comparing functional positioning, price, and actual trial experience.
thebricks has about 329.3K monthly visits, higher than Graphy at 200.4K. Use this as a signal of market attention, not as product quality by itself.
In-depth Analysis of User Engagement
Both tools have third-party traffic analysis records, allowing comparison of visits, dwell time, pages per visit, and bounce rate; these metrics should be considered alongside the tool's purpose.
User Reviews vs. Community Feedback
Graphy has no reviewed ratings yet. thebricks has no reviewed ratings yet.
Product Positioning and Application Scenario Analysis
Graphy is in 3D with a Freemium pricing model; thebricks is in Spreadsheets with a Freemium pricing model. Prioritize fit for your specific tasks rather than traffic or default ratings alone.
Frequently Asked Questions
FAQs about these two tools to help you better understand their features and differences
What are the biggest differences between the two?
Graphy is primarily positioned in 3D, while thebricks is primarily positioned in Spreadsheets. Which one suits you depends on which type of use case and workflow you need more.
Which tool is better to try first?
thebricks currently has higher market attention, making it suitable for initial understanding; the final decision should still be based on specific functional needs after trial.
How should ratings and traffic data be interpreted?
Ratings only count reviewed user comments; no default 5-star rating is given when there are no comments. Traffic is used to gauge market attention but cannot solely represent product quality.
Related Tool Recommendations
Discover more excellent AI tools of the same kind
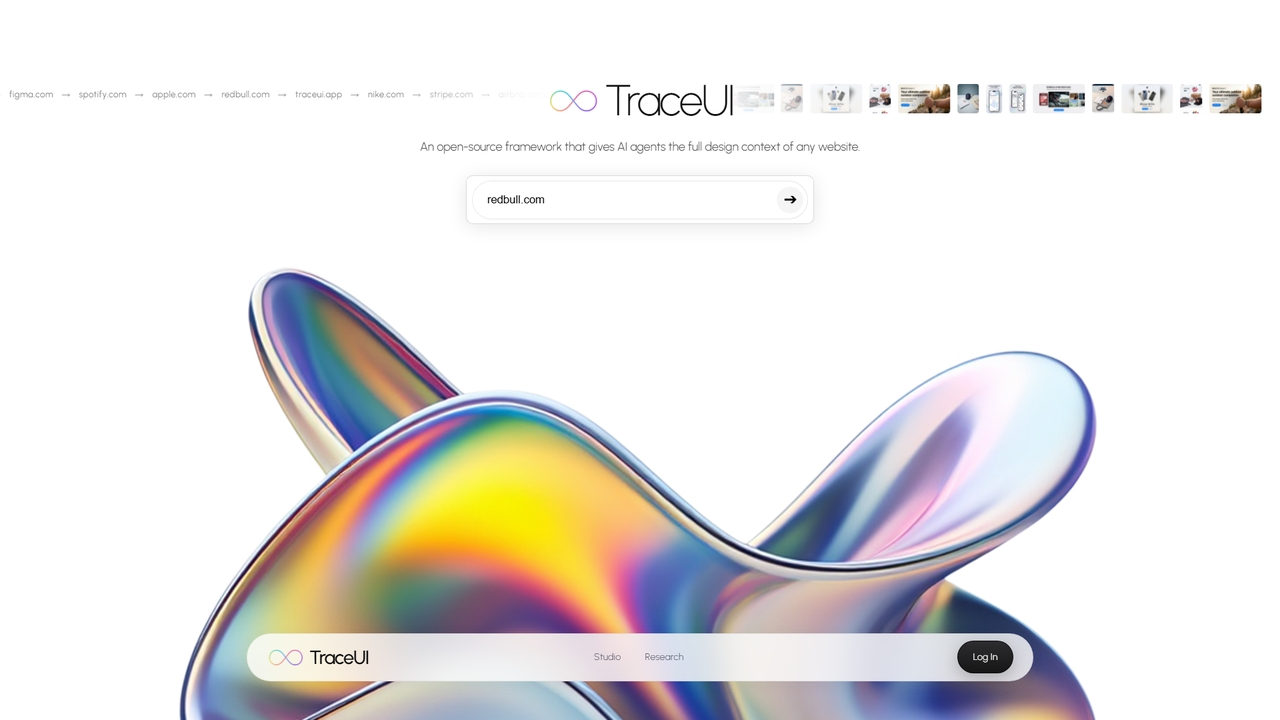
TraceUI
An open-source framework that gives AI agents the full design context of any website, enabling brand-consistent ad generation …
An open-source framework that gives AI agents the full design context of any website, enabling brand-consistent ad generation and mockup creation.

Raccoon AI
Raccoon AI is a collaborative AI workspace that transforms conversations into web applications, presentations, reports, and designs. It …
Raccoon AI is a collaborative AI workspace that transforms conversations into web applications, presentations, reports, and designs. It integrates with your favorite tools to automate and execute complex creative and technical tasks.
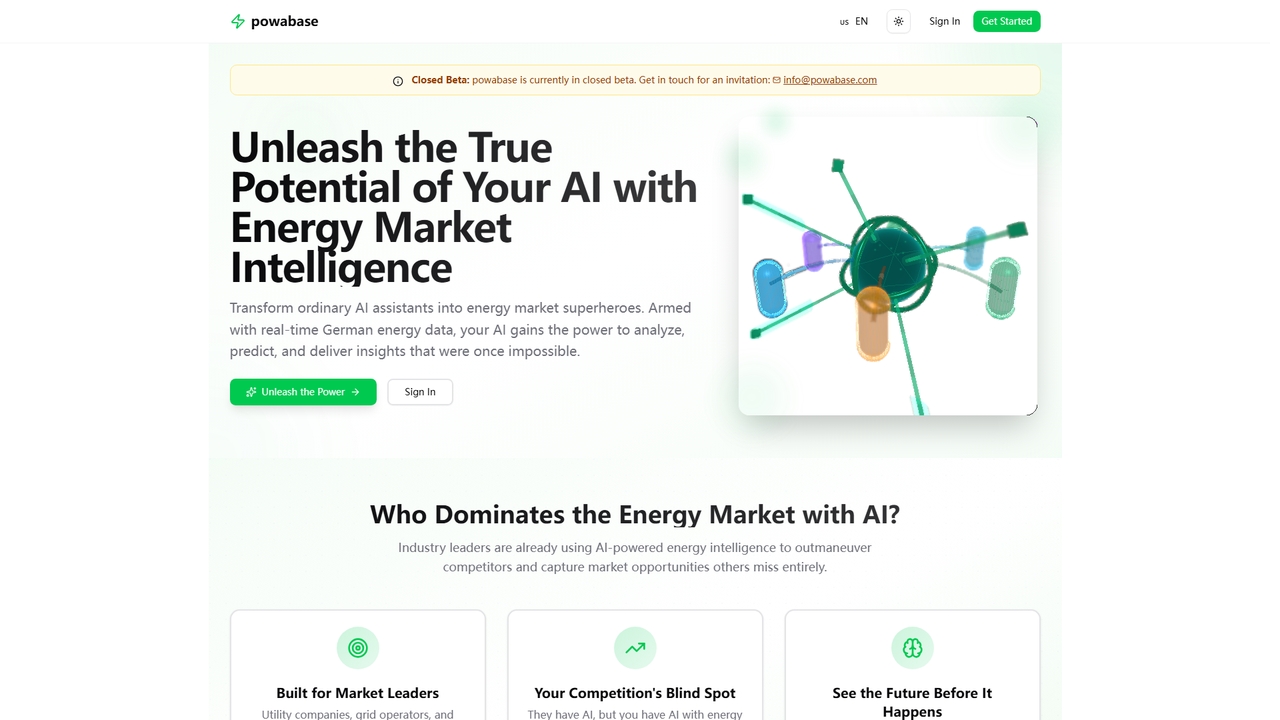
Powabase
An energy market intelligence platform that transforms AI assistants into experts by providing real-time, integrated German energy data. …
An energy market intelligence platform that transforms AI assistants into experts by providing real-time, integrated German energy data. Currently in closed beta.
Onform
Onform is an intelligent, MCP-native form builder enabling unlimited forms and submissions. It offers conversational forms, self-hosting options, …
Onform is an intelligent, MCP-native form builder enabling unlimited forms and submissions. It offers conversational forms, self-hosting options, and powerful integrations for lead generation and data collection without per-response fees.
From Process
A platform for operators to quickly create forms, pages, and bio links with embedded options and agent support.
A platform for operators to quickly create forms, pages, and bio links with embedded options and agent support.
Brila
Brila uses AI and the Jobs To Be Done framework to analyze your Google Maps reviews and automatically …
Brila uses AI and the Jobs To Be Done framework to analyze your Google Maps reviews and automatically generate a website with compelling, customer-centric messaging for your local business.
Yansu
Yansu is a proactive AI application builder that observes your work habits and automatically constructs custom tools and …
Yansu is a proactive AI application builder that observes your work habits and automatically constructs custom tools and workflows, requiring no prompts or coding. It operates quietly in the background to enhance productivity.
Tweet
Tweet converts X (Twitter) posts and threads into clean, LLM-ready Markdown format. Simply swap 'x.com' with 'tweet.md' in …
Tweet converts X (Twitter) posts and threads into clean, LLM-ready Markdown format. Simply swap 'x.com' with 'tweet.md' in any post URL to get structured text optimized for AI agents, research, and note-taking tools.

Orchestria
An AI music studio where specialized agents (drummer, melodist, critic, mixer) collaborate in real-time to turn your ideas …
An AI music studio where specialized agents (drummer, melodist, critic, mixer) collaborate in real-time to turn your ideas into studio-quality tracks via natural language commands.
Databerry
A business intelligence dashboard for founders that unifies data from tools like Stripe, PostHog, and Google Analytics. Track …
A business intelligence dashboard for founders that unifies data from tools like Stripe, PostHog, and Google Analytics. Track all key metrics like MRR, user sign-ups, and errors on a single page with no code required.
Vibedock
A macOS menu bar application for developers to instantly toggle Claude MCP servers on or off per project, …
A macOS menu bar application for developers to instantly toggle Claude MCP servers on or off per project, saving context window tokens and eliminating manual config file editing.
Vela
Vela is an AI-powered motion graphics generator that creates professional animated videos from a single text description in …
Vela is an AI-powered motion graphics generator that creates professional animated videos from a single text description in under three minutes, requiring no design skills or subscriptions.

Memdex
A Chrome extension that saves your AI conversations from ChatGPT, Claude, and Gemini, automatically suggesting relevant context in …
A Chrome extension that saves your AI conversations from ChatGPT, Claude, and Gemini, automatically suggesting relevant context in new chats to enhance productivity.
Forsy
Forsy is a platform designed to transform AI agents into strategic business assets through native capture, full coverage …
Forsy is a platform designed to transform AI agents into strategic business assets through native capture, full coverage tracking, trade agent data, and high-fidelity analytics across all environments.

Tycoon
An AI-run company platform providing an AI CEO (Astra) and a team of specialized AI employees to build, …
An AI-run company platform providing an AI CEO (Astra) and a team of specialized AI employees to build, operate, and scale a one-person company. Handles coding, marketing, sales, research, and more for a monthly subscription starting at $49.