Diagramming AI
Diagramming AI is an advanced AI-powered platform that instantly generates and edits a wide range of diagrams from …
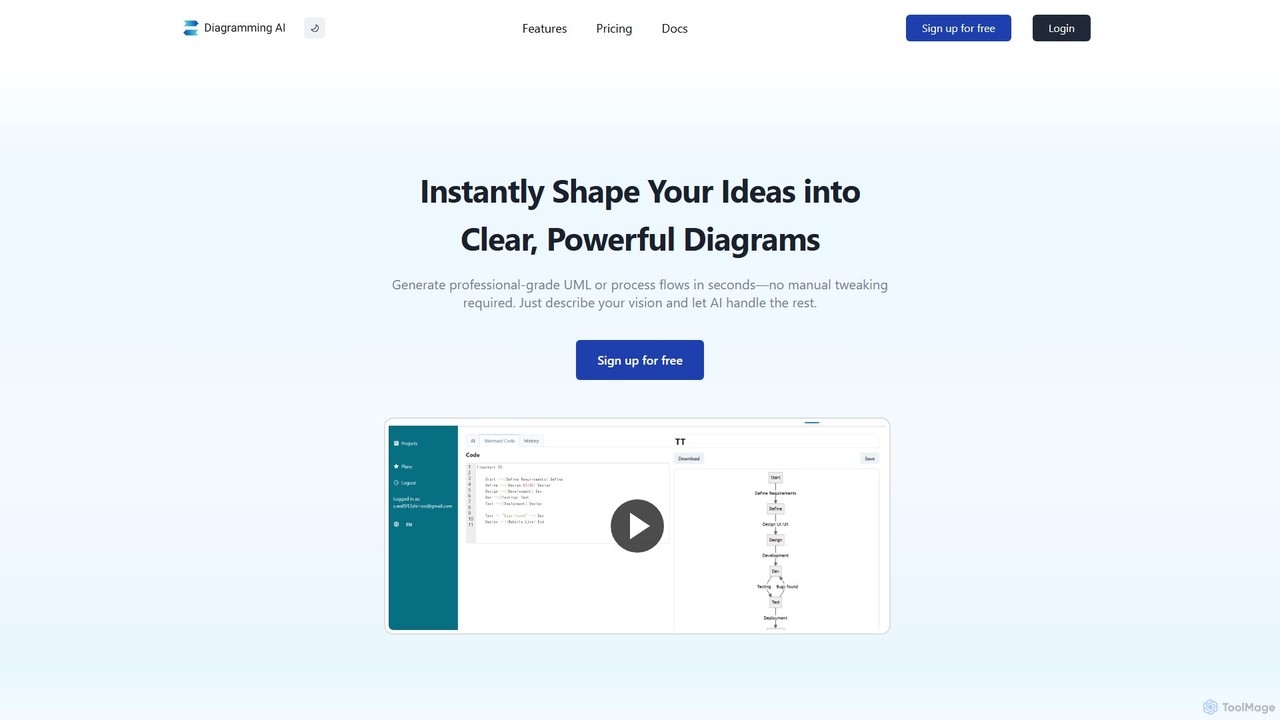
Diagramming AI is an advanced AI-powered platform that instantly generates and edits a wide range of diagrams from text, URLs, or images. It supports popular formats like Mermaid, PlantUML, and Graphviz, and features an intuitive AI chat for real-time modifications and a visual editor integration with Excalidraw for precise adjustments.
About Visualization
Visualization tools are AI-powered applications designed to transform complex data, abstract concepts, or textual descriptions into clear, intuitive, and engaging visual representations. These tools leverage advanced algorithms to automate the creation of charts, graphs, infographics, 3D models, and interactive dashboards, making information more accessible and understandable. They significantly enhance communication and decision-making by revealing patterns, trends, and insights that might otherwise remain hidden within raw data, serving as a crucial bridge between data and understanding within the broader Design & Art landscape.
Core Features
- Automated Chart & Graph Generation: Automatically selects and creates appropriate charts (bar, line, pie, scatter) from raw datasets, often suggesting optimal visual types.
- Interactive Dashboard Creation: Builds dynamic, customizable dashboards that allow users to explore data through filters, drill-downs, and real-time updates.
- Concept-to-Visual Rendering: Generates visual representations, such as mockups, storyboards, or 3D models, from textual descriptions or abstract ideas.
- Data Storytelling & Annotation: Integrates narrative elements and intelligent annotations to guide viewers through key insights and highlight important data points.
- Style Transfer & Enhancement: Applies artistic styles or optimizes visual aesthetics to existing data visualizations for improved impact and brand consistency.
Applicable Scenarios
AI visualization tools are indispensable across various sectors. Data analysts use them to quickly generate comprehensive reports and identify critical trends. Marketing teams leverage them to create compelling infographics and visual content for campaigns. Product designers utilize these tools to visualize user flows and product mockups from early concepts. Researchers benefit from their ability to produce accurate scientific diagrams and statistical plots, while business intelligence professionals rely on them for real-time performance monitoring dashboards.
How to Choose
When selecting an AI visualization tool, consider its data source compatibility, ensuring it integrates with your existing databases or platforms. Evaluate the range and customization options for output formats, from static images to interactive web dashboards. Assess the level of automation versus manual control, balancing ease of use with specific design needs. Finally, review its scalability, pricing model, and the clarity of its AI-driven insights to match your project's complexity and budget.
VisualizationUse Cases
Automating Financial Report Visuals
A financial analyst needs to present quarterly performance to stakeholders. Instead of manually creating charts in spreadsheets, they use an AI visualization tool to automatically process raw financial data, generating a series of interactive line graphs, bar charts, and pie charts that highlight revenue growth, expenditure breakdown, and profit margins, saving hours of manual work and ensuring data accuracy.
Creating Engaging Marketing Infographics
A marketing specialist is launching a new campaign and requires visually appealing infographics to explain complex product benefits on social media. They input key statistics and textual descriptions into an AI visualization tool, which then suggests various infographic layouts, color schemes, and icon sets, allowing them to quickly generate multiple design options that resonate with their target audience.
Visualizing User Journey Maps for Product Design
A UX designer is developing a new mobile application and needs to visualize the user journey from onboarding to feature usage. By inputting user research data and textual descriptions of user interactions, an AI visualization tool generates detailed flowcharts and interactive journey maps, helping the design team identify pain points and optimize the user experience before development begins.
Generating Scientific Data Plots for Research Papers
A scientific researcher has collected extensive experimental data and needs to create precise, publication-ready plots for a journal submission. They feed their datasets into an AI visualization platform that automatically generates scatter plots, heatmaps, and statistical distributions, ensuring adherence to scientific standards and allowing for quick iteration on visual parameters to best illustrate their findings.
Developing Real-time Business Performance Dashboards
A business intelligence manager requires a dynamic dashboard to monitor sales, customer engagement, and operational efficiency in real-time. An AI visualization tool connects to various enterprise data sources, automatically updating and displaying key performance indicators (KPIs) through interactive gauges, trend lines, and geographical maps, enabling immediate insights and proactive decision-making.
Transforming Complex Concepts into Educational Visuals
An educator wants to explain a complex scientific theory to students in an engaging way. They use an AI visualization tool to input the core concepts and relationships, which then generates animated diagrams, interactive models, or sequential infographics. This helps students grasp abstract ideas more easily, fostering better understanding and retention of the material.