ToolMage
Sign in

Best 1 Diagramming AI tools for Developer Tools

Popular Diagramming AI tools in Developer Tools include Eraser, helping you work more efficiently.

Eraser
Freemium

Eraser

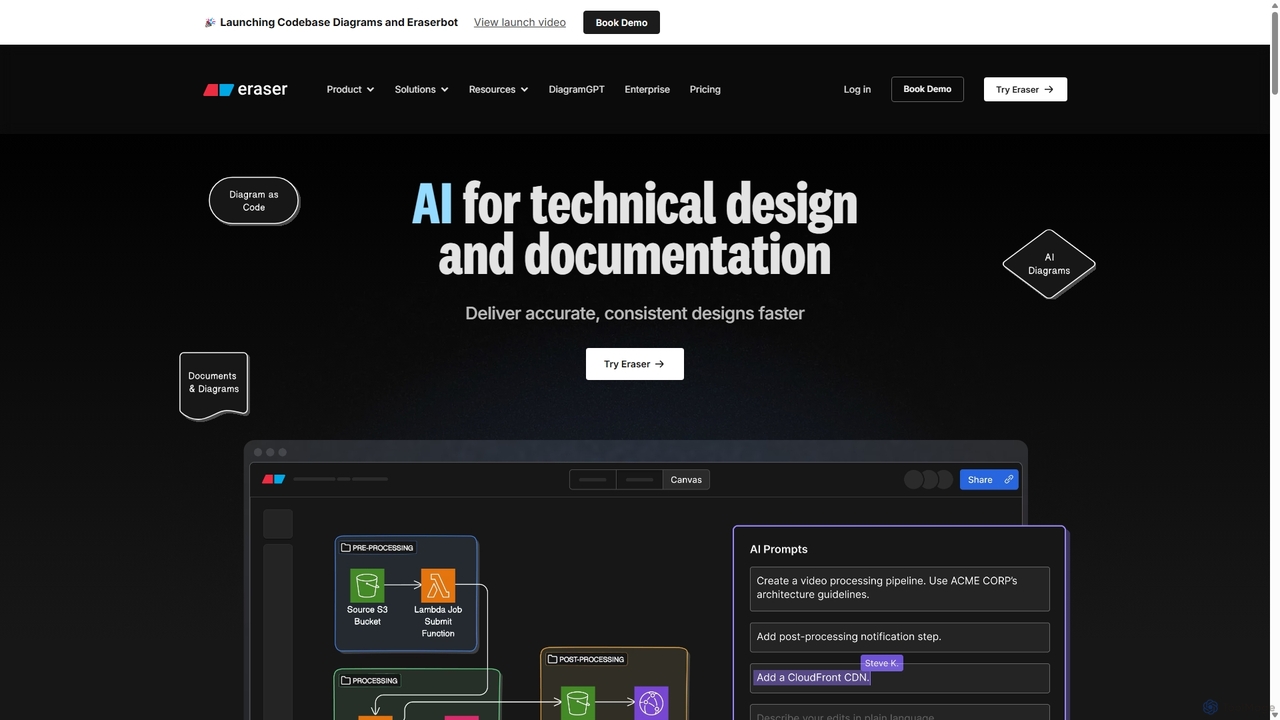
Eraser is an AI-powered co-pilot for technical design and documentation, built for engineering teams. It enables users to generate and edit diagrams like architecture, flowcharts, and ERDs using natural language prompts. It combines a collaborative canvas with a markdown editor and diagram-as-code functionality to streamline the entire design process, from brainstorming to documentation.

Whiteboard
Visits 876.6KFavorites 93Likes 107

About Diagramming

AI Diagramming tools are a specialized category of developer tools that automate the creation of visual diagrams from text, code, or data. They leverage natural language processing and graph algorithms to interpret inputs and generate structured visuals like flowcharts, UML diagrams, and system architectures. This significantly accelerates the process of system design, documentation, and communication for technical teams. Unlike manual drag-and-drop editors, these AI tools can intelligently suggest layouts, identify connections, and even validate diagram logic.

Core Features

  • Text-to-Diagram: Instantly generate complex diagrams from natural language prompts or structured text.
  • Automated Layout: Intelligently arrange elements for optimal readability and adherence to standard notations.
  • Code-to-Diagram: Visualize existing codebases by automatically generating class diagrams or sequence diagrams.
  • Smart Suggestions: Receive AI-powered recommendations for connecting nodes, adding elements, or improving diagram clarity.
  • Diagram Validation: Analyze diagrams for logical inconsistencies or errors in flowcharts and state machines.

Use Cases

These tools are essential for software developers, system architects, business analysts, and DevOps engineers. They are used for designing new software architectures, documenting existing systems, modeling business processes, and planning cloud infrastructure deployments. This streamlines complex planning and documentation workflows, ensuring clarity and consistency across teams.

How to Choose

When selecting a tool, consider the specific diagram types it supports (e.g., UML, BPMN, ERD). Evaluate its integration capabilities with your existing toolchain, such as IDEs, version control systems (like Git), and project management platforms. Also, assess the sophistication of its AI features, collaboration options, and available export formats to ensure it meets your team's specific needs.

Featured tool rankings

Diagramming use cases

1

Rapid Software Architecture Prototyping

A system architect needs to design a new microservices architecture for an e-commerce platform. Instead of manually drawing boxes and lines, they use an AI diagramming tool. They write a high-level description like: 'Create a system with a user service, a product service, and an order service. The user service authenticates requests and forwards them to the other services via an API Gateway.' The AI instantly generates a clean, well-structured architecture diagram, including standard icons for databases and APIs. This allows the architect to iterate on designs in minutes rather than hours, facilitating faster feedback cycles with the development team.

2

Visualizing Existing Codebases for Refactoring

A development team inherits a legacy codebase with poor documentation. To understand the complex relationships between classes and modules, they use an AI diagramming tool with code-to-diagram functionality. By pointing the tool to their source code repository, it automatically generates a detailed UML class diagram. The AI identifies inheritance, composition, and dependencies, visually mapping out the entire system. This visual representation helps the team identify tightly coupled components, pinpoint areas for refactoring, and onboard new developers much more effectively.

3

Automating Business Process Modeling (BPMN)

A business analyst is tasked with documenting and optimizing a company's customer onboarding process. They conduct interviews and gather requirements in a text document. Instead of manually creating a BPMN (Business Process Model and Notation) diagram, they paste their notes into an AI diagramming tool. The AI parses the text, identifies steps, decision points, and actors, and generates a compliant BPMN 2.0 diagram. The analyst can then easily modify the diagram by typing commands like 'Add an approval step after identity verification,' saving significant time and ensuring standardization.

4

Generating Cloud Infrastructure Diagrams

A DevOps engineer is planning a new deployment on AWS. They need to create a detailed infrastructure diagram for a security review. Using an AI diagramming tool, they simply list the required resources in text: 'An EC2 instance in a public subnet, an RDS database in a private subnet, and an S3 bucket for storage, all within a VPC.' The tool automatically generates a diagram using official AWS icons, correctly placing resources in their respective subnets and showing the network connections. This not only saves time but also reduces the risk of human error in representing complex cloud architectures.

5

Creating ERDs from SQL Schemas

A database administrator (DBA) needs to document a complex database structure for a new team member. The database has hundreds of tables with intricate foreign key relationships. Instead of manually mapping them out, the DBA pastes the SQL `CREATE TABLE` statements into an AI diagramming tool. The tool parses the SQL, identifies tables, columns, primary keys, and foreign keys, and automatically generates a complete and accurate Entity-Relationship Diagram (ERD). This visual model makes the database schema instantly understandable, accelerating the learning curve for the new developer.

6

AI-Assisted Mind Mapping for Project Planning

A product manager is brainstorming features for a new mobile app. They start with a central idea in an AI-powered mind mapping tool. As they add main branches like 'User Profiles,' 'Payment Gateway,' and 'Notifications,' the AI suggests relevant sub-topics. For 'Payment Gateway,' it might suggest 'Credit Card,' 'PayPal,' and 'Stripe Integration.' This assistive feature helps the manager explore all facets of the project, organize thoughts systematically, and ensure no critical component is overlooked during the initial planning phase, turning a simple brainstorm into a structured project outline.

Diagramming FAQ

What are AI Diagramming tools?

AI Diagramming tools are advanced software applications that use artificial intelligence to automate the creation and management of diagrams. Unlike traditional manual editors, they can interpret natural language, code, or data to automatically generate visuals like flowcharts, UML diagrams, system architecture maps, and mind maps. Their core purpose is to accelerate the design and documentation process for developers, architects, and analysts by transforming complex information into clear, structured diagrams with minimal manual effort.

How do AI Diagramming tools differ from traditional diagram editors?

The key difference lies in automation and intelligence. Traditional editors (like Visio or Draw.io) are digital drawing boards requiring users to manually place, connect, and style every element. AI Diagramming tools act as intelligent assistants. They can:

  • Generate diagrams from input: Create entire diagrams from text descriptions or code, a feature absent in traditional tools.
  • Automate layout: Intelligently arrange elements for clarity and consistency, whereas manual tools require tedious adjustments.
  • Provide smart suggestions: Recommend connections or next steps based on the diagram's context.
  • Understand context: Parse code to create UML diagrams or SQL to create ERDs, showing a deeper level of understanding.

In essence, traditional tools help you draw a diagram, while AI tools help you build and understand the system the diagram represents.

How to choose the right AI Diagramming tool for development teams?

When selecting an AI Diagramming tool for a development team, consider these factors:

  • Supported Diagram Types: Ensure it supports the notations your team uses, such as UML (Class, Sequence), C4 Model, ERD, or specific cloud architecture icons (AWS, GCP, Azure).
  • Input Methods: Check if it accepts the inputs you need, like natural language, Markdown, Mermaid syntax, SQL schemas, or direct code analysis.
  • Integrations: Look for integrations with your workflow tools, such as VS Code, IntelliJ, GitHub, Jira, or Confluence. Seamless integration prevents context switching.
  • Collaboration Features: Real-time editing, commenting, and version history are crucial for team-based design and review sessions.
  • Export and Interoperability: The ability to export to various formats (PNG, SVG, PDF) and potentially other diagramming tool formats is important for sharing and documentation.
Can AI Diagramming tools understand and generate code?

Yes, this is a key feature for many advanced AI Diagramming tools. They can perform two main functions related to code:

  • Code-to-Diagram (Reverse Engineering): They can analyze an existing codebase (e.g., Java, Python, C) and automatically generate UML class diagrams or dependency graphs. This is extremely useful for understanding and documenting legacy systems.
  • Diagram-to-Code (Code Generation): They can take a visual diagram, such as a UML class diagram or a state machine, and generate boilerplate code in a specified programming language. This accelerates the initial development phase by creating the basic structure of classes, methods, and attributes, allowing developers to focus on implementing the core logic.

The accuracy and completeness of the generated code can vary, but it provides a strong foundation for developers to build upon.

Who are the primary users of AI Diagramming tools?

AI Diagramming tools are primarily used by technical professionals who need to visualize and communicate complex systems. Key user groups include:

  • Software Developers & Engineers: For understanding codebases, planning features with flowcharts, and designing class structures with UML.
  • System Architects: For designing and documenting high-level system architectures, microservices, and cloud infrastructure.
  • Business Analysts: For modeling business processes (BPMN), mapping user flows, and translating requirements into technical diagrams.
  • DevOps & SREs: For planning and visualizing cloud deployments, network topologies, and CI/CD pipelines.
  • Data Scientists & Analysts: For creating diagrams of data pipelines, database schemas (ERDs), and model architectures.