Helicone
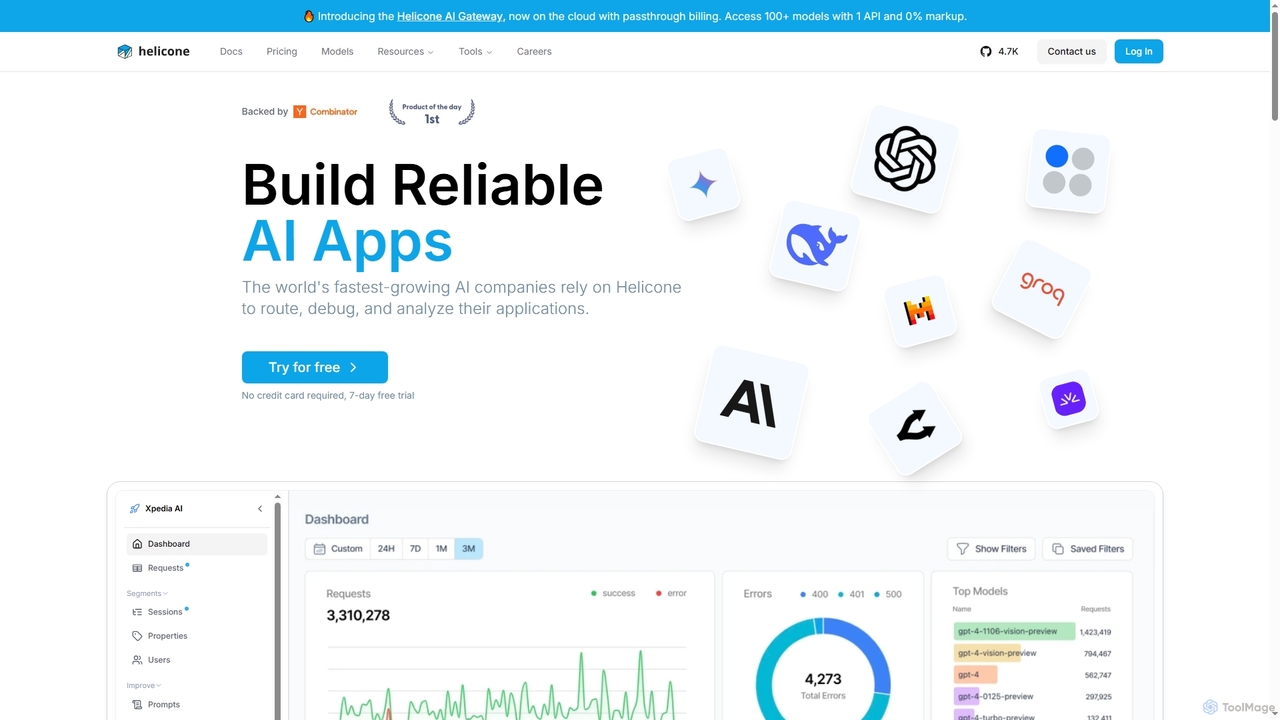
Helicone is an open-source platform offering an AI Gateway and LLM Observability for developers. It helps build reliable …
Helicone is an open-source platform offering an AI Gateway and LLM Observability for developers. It helps build reliable AI applications by providing tools to route, monitor, debug, and analyze LLM usage. Key features include a unified API for 100+ models, intelligent caching, rate limiting, prompt management, and detailed performance analytics.
Anomify
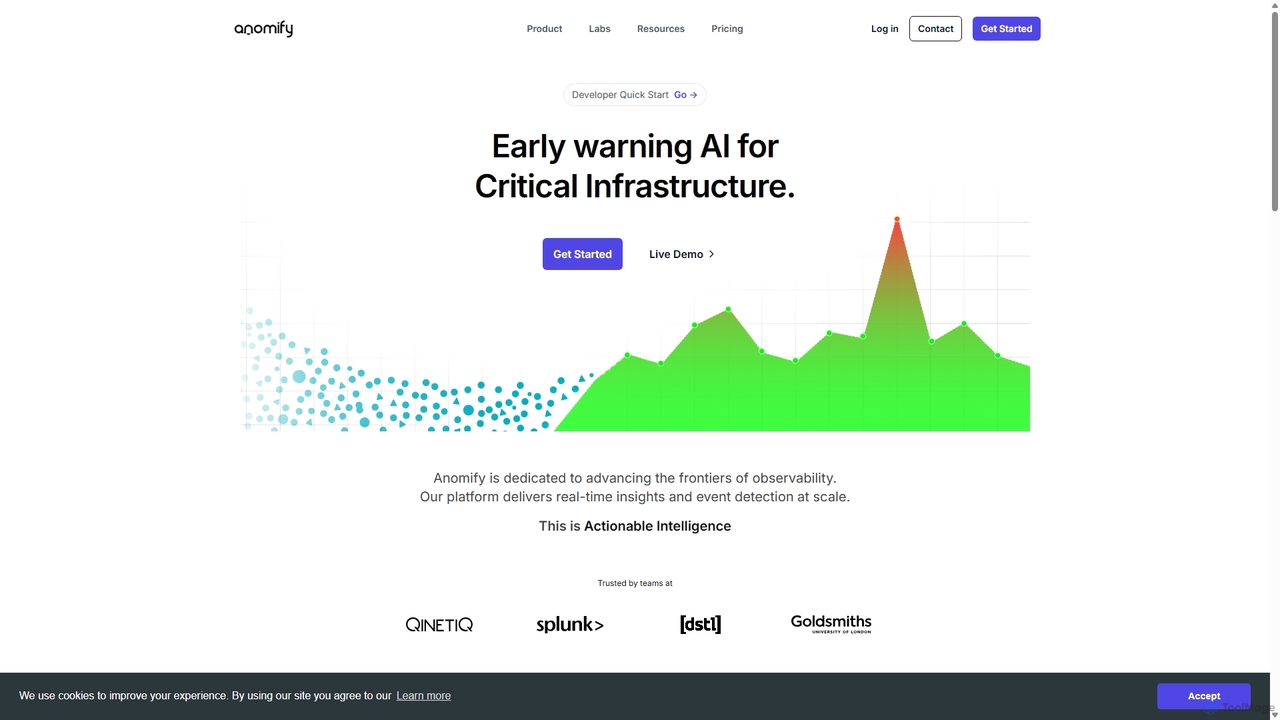
Anomify is an AI-powered early warning platform for critical infrastructure, offering real-time anomaly detection and observability at scale. …
Anomify is an AI-powered early warning platform for critical infrastructure, offering real-time anomaly detection and observability at scale. It leverages multi-stage machine learning to analyze time-series data, significantly reduce false positives, and accelerate root cause analysis. Designed for DevOps, SREs, and IT teams, Anomify transforms monitoring from reactive to proactive, ensuring system performance and reliability.
WebTotem
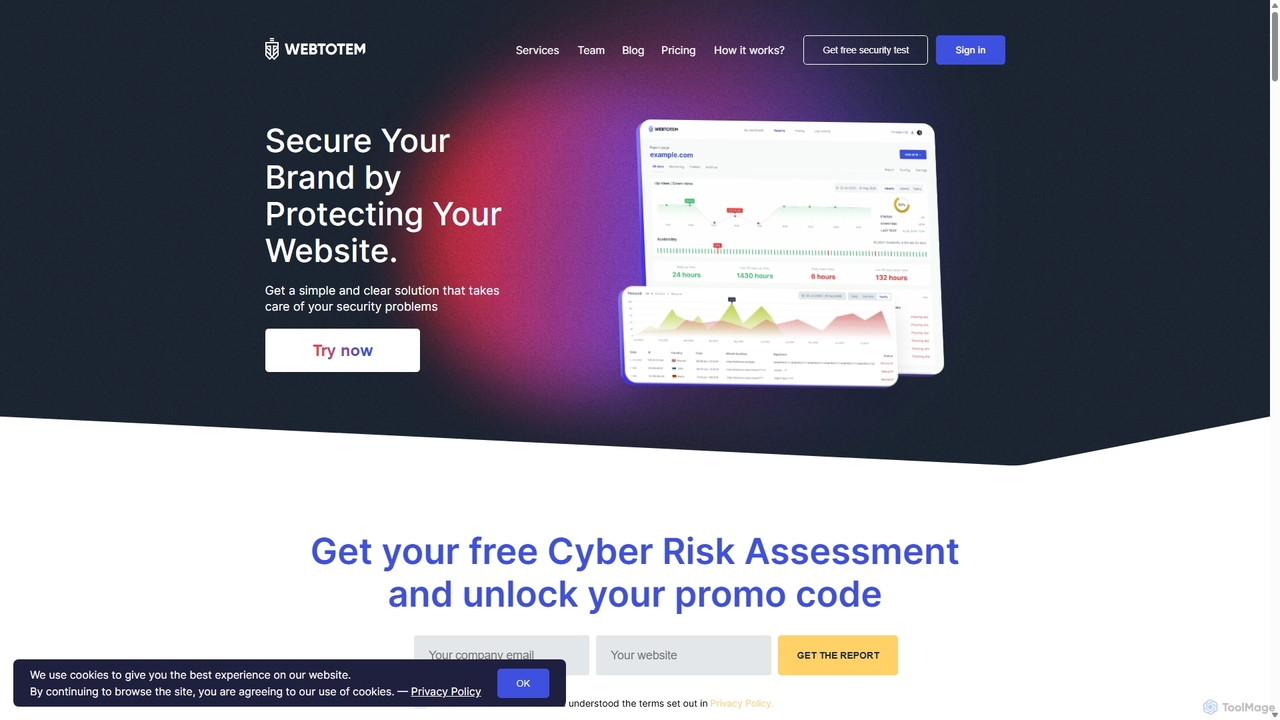
WebTotem is an AI-powered, all-in-one website security platform for individuals, SMBs, and agencies. It offers comprehensive protection with …
WebTotem is an AI-powered, all-in-one website security platform for individuals, SMBs, and agencies. It offers comprehensive protection with an intelligent firewall (WAF), server-side antivirus, continuous monitoring, and vulnerability management. Secure your brand, prevent data loss, and ensure website availability with a simple setup and proactive threat detection.
Outoftheblue
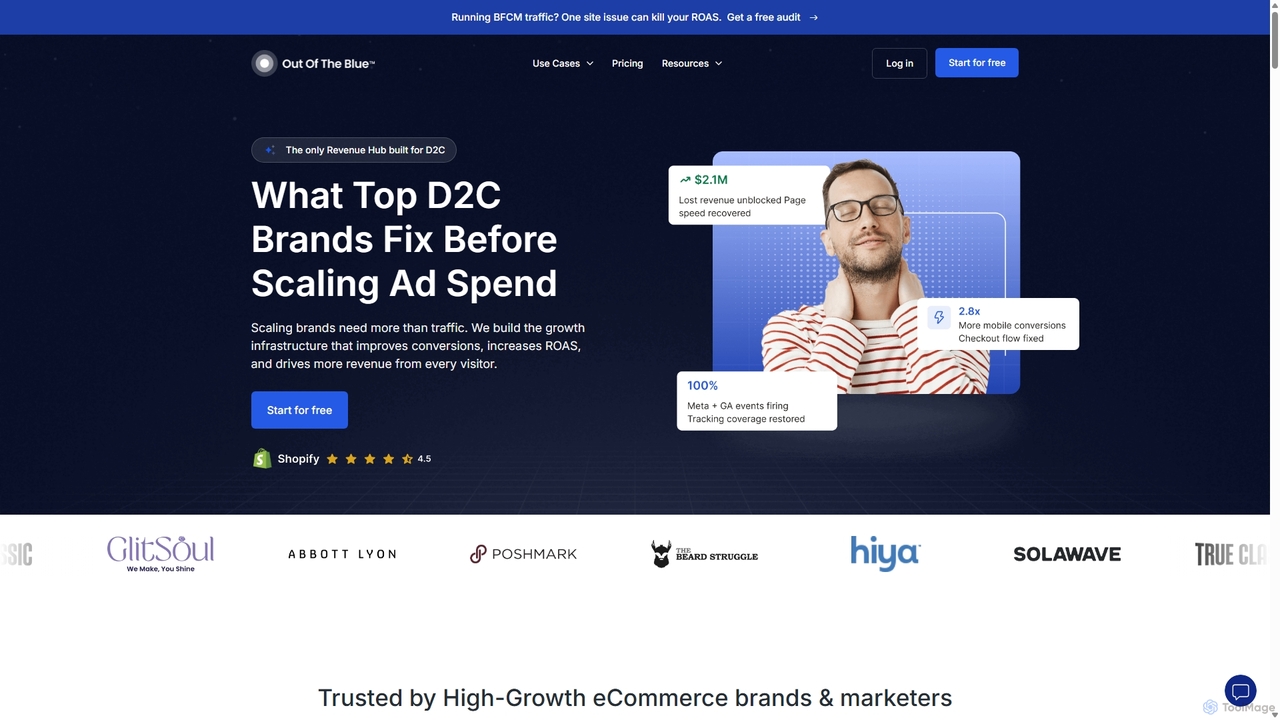
Outoftheblue is an AI-powered eCommerce observability platform for D2C brands. It provides real-time monitoring of over 100 ad …
Outoftheblue is an AI-powered eCommerce observability platform for D2C brands. It provides real-time monitoring of over 100 ad and site signals, instantly alerting businesses to revenue-impacting issues like broken pixels, checkout failures, and ad spend inefficiencies. This proactive approach helps brands protect ROAS, improve conversions, and scale confidently.
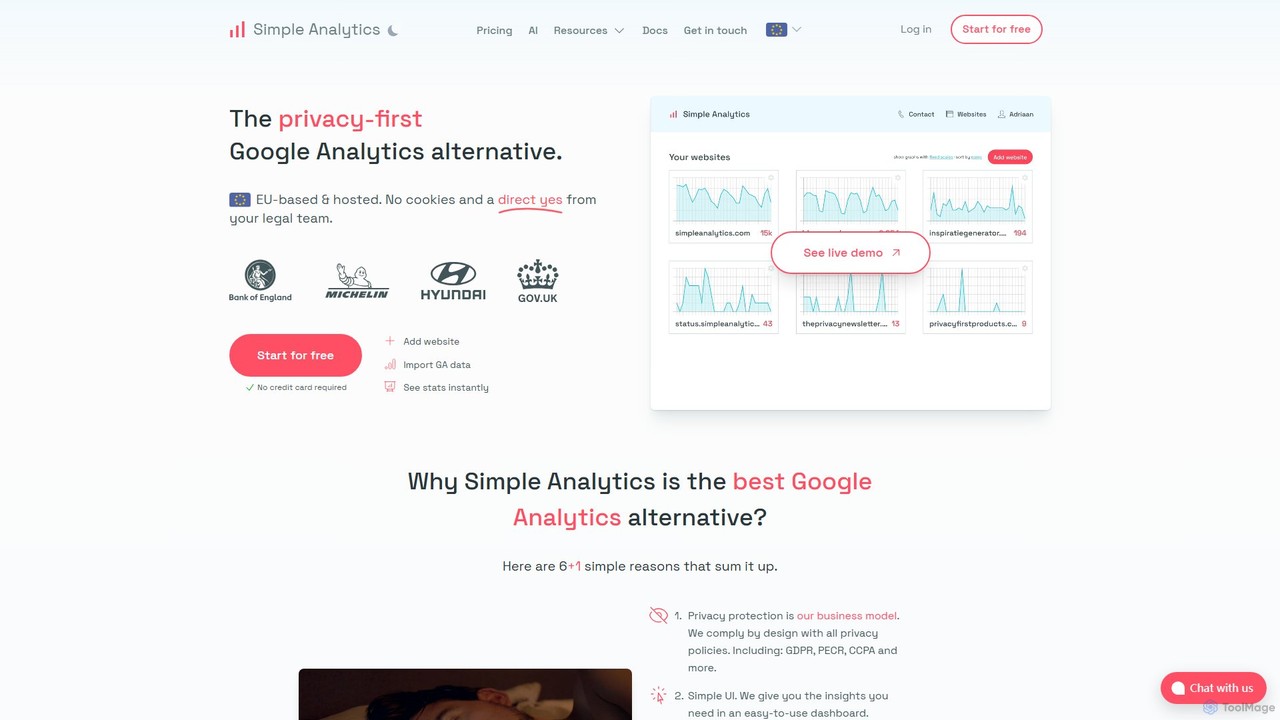
Simple Analytics
Simple Analytics is the privacy-first alternative to Google Analytics. It offers a clean, simple dashboard and powerful insights …
Simple Analytics is the privacy-first alternative to Google Analytics. It offers a clean, simple dashboard and powerful insights without using cookies or collecting personal data. A standout feature is its AI assistant, allowing you to chat with your analytics to get instant answers. Based in the EU and fully GDPR compliant, it provides accurate, lightweight tracking that respects your visitors and improves your website's speed.
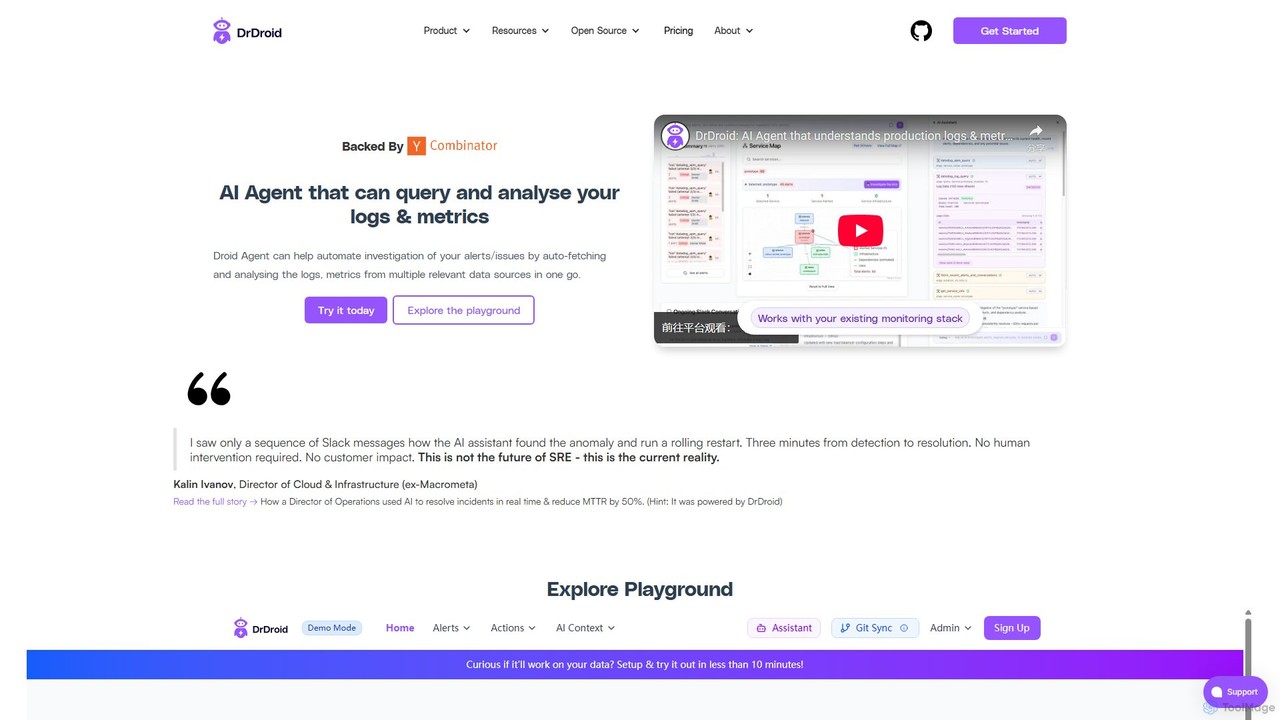
drdroid
drdroid is an AI-powered agent for observability and production monitoring, designed for SRE and DevOps teams. It automates …
drdroid is an AI-powered agent for observability and production monitoring, designed for SRE and DevOps teams. It automates incident investigation by querying and analyzing logs and metrics from multiple sources. By integrating with your existing stack via Slack, it helps reduce alert fatigue, slash MTTR (Mean Time to Resolution), and transform runbooks into self-healing systems, acting as a 24/7 AI SRE.

Seline
Seline is a privacy-first, lightweight, and user-friendly website and product analytics platform. As a cookieless alternative to Google …
Seline is a privacy-first, lightweight, and user-friendly website and product analytics platform. As a cookieless alternative to Google Analytics, it offers real-time insights through an intuitive dashboard, visitor journey tracking, conversion funnels, and AI-powered chat. Designed for simplicity and performance, Seline helps businesses, SaaS companies, and e-commerce stores understand user behavior without compromising on privacy or site speed. It's GDPR compliant and easy to integrate in minutes.
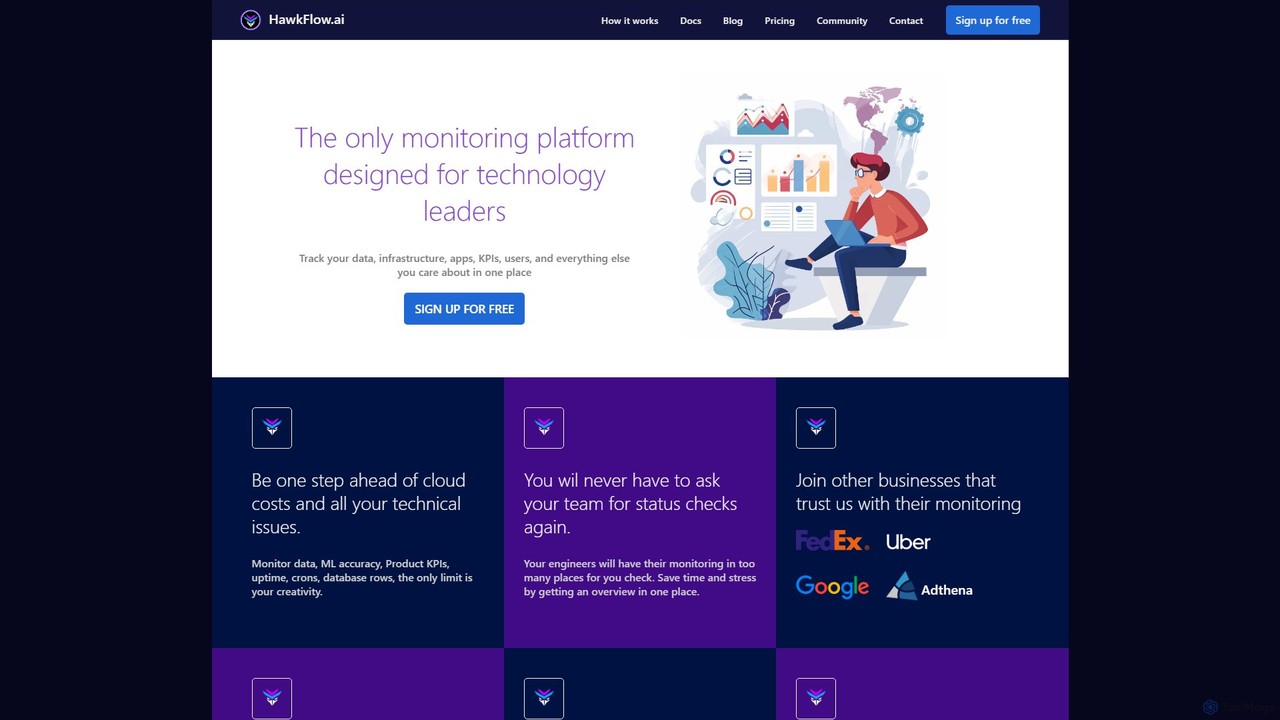
hawkflow.ai
HawkFlow.ai is a unified monitoring platform for developers and technology leaders. It allows you to track application performance, …
HawkFlow.ai is a unified monitoring platform for developers and technology leaders. It allows you to track application performance, infrastructure, data, KPIs, and ML models in one centralized place. With simple code integration, it helps teams proactively identify issues, monitor costs, and gain a comprehensive overview of their entire tech stack.
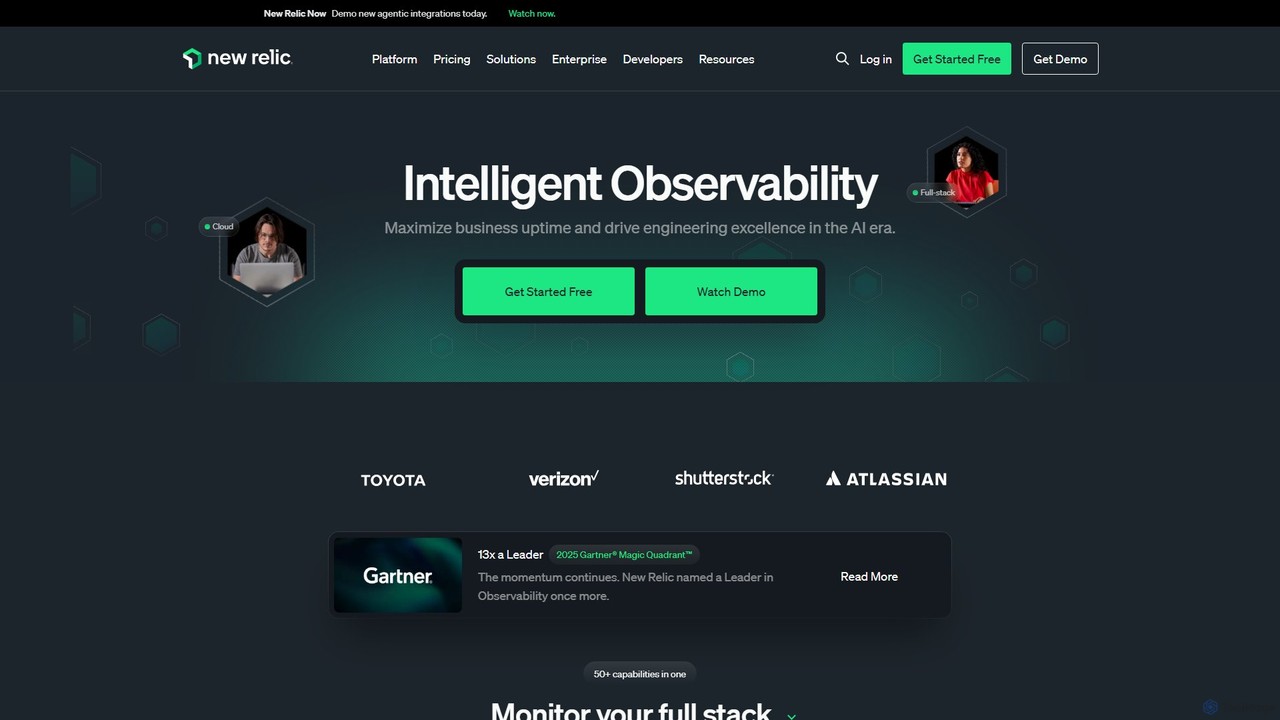
New Relic
New Relic is an AI-powered, full-stack observability platform that helps engineering teams monitor, debug, and improve their entire …
New Relic is an AI-powered, full-stack observability platform that helps engineering teams monitor, debug, and improve their entire software stack. It provides a unified view of all telemetry data—metrics, events, logs, and traces—to enable faster problem resolution and optimized performance in the AI era.
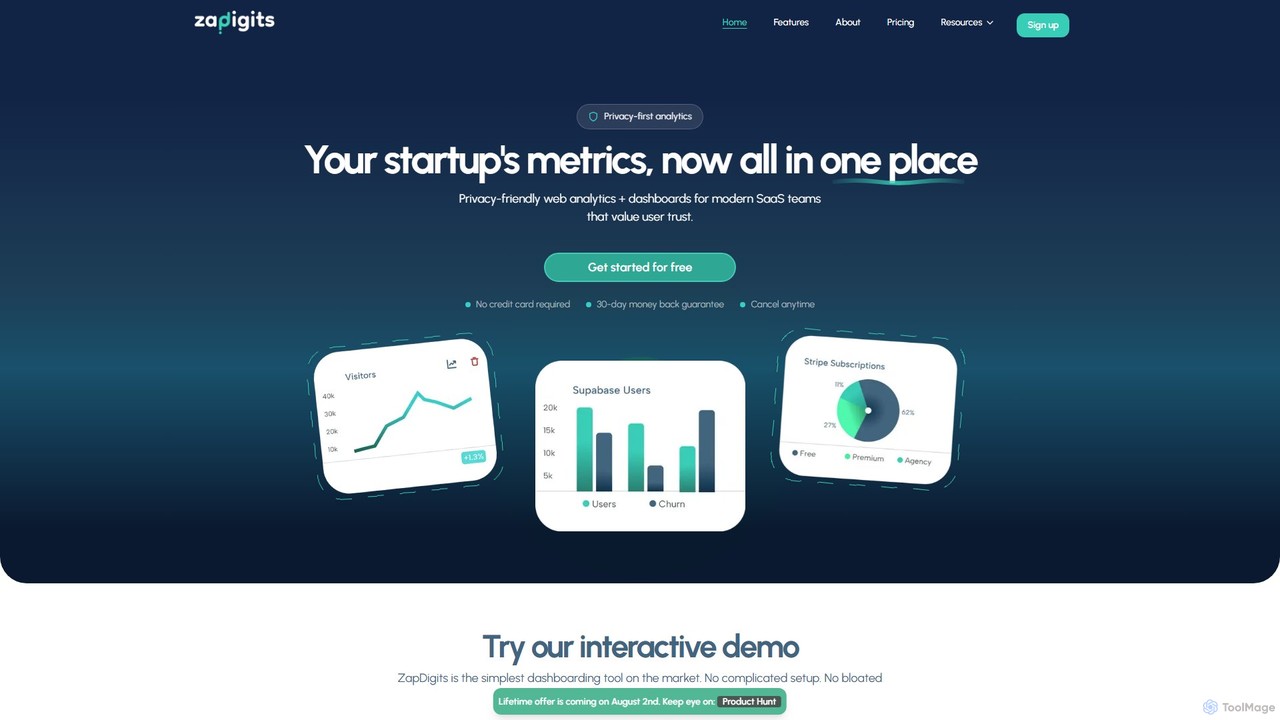
ZapDigits
ZapDigits is a privacy-first analytics and dashboarding tool designed for startups and SaaS teams. It consolidates key metrics …
ZapDigits is a privacy-first analytics and dashboarding tool designed for startups and SaaS teams. It consolidates key metrics from various services like Stripe, Supabase, and GitHub into a single, easy-to-understand dashboard. With a no-code setup, it provides clear, actionable insights without the complexity of traditional BI tools, helping founders save time and make data-driven decisions.
Aporia
Aporia is an enterprise-grade platform providing AI Guardrails and Observability for any AI workload. It ensures AI applications …
Aporia is an enterprise-grade platform providing AI Guardrails and Observability for any AI workload. It ensures AI applications are secure, reliable, and compliant by preventing issues like prompt injections, data leakage, and hallucinations, while also offering detailed cost management for LLMs.
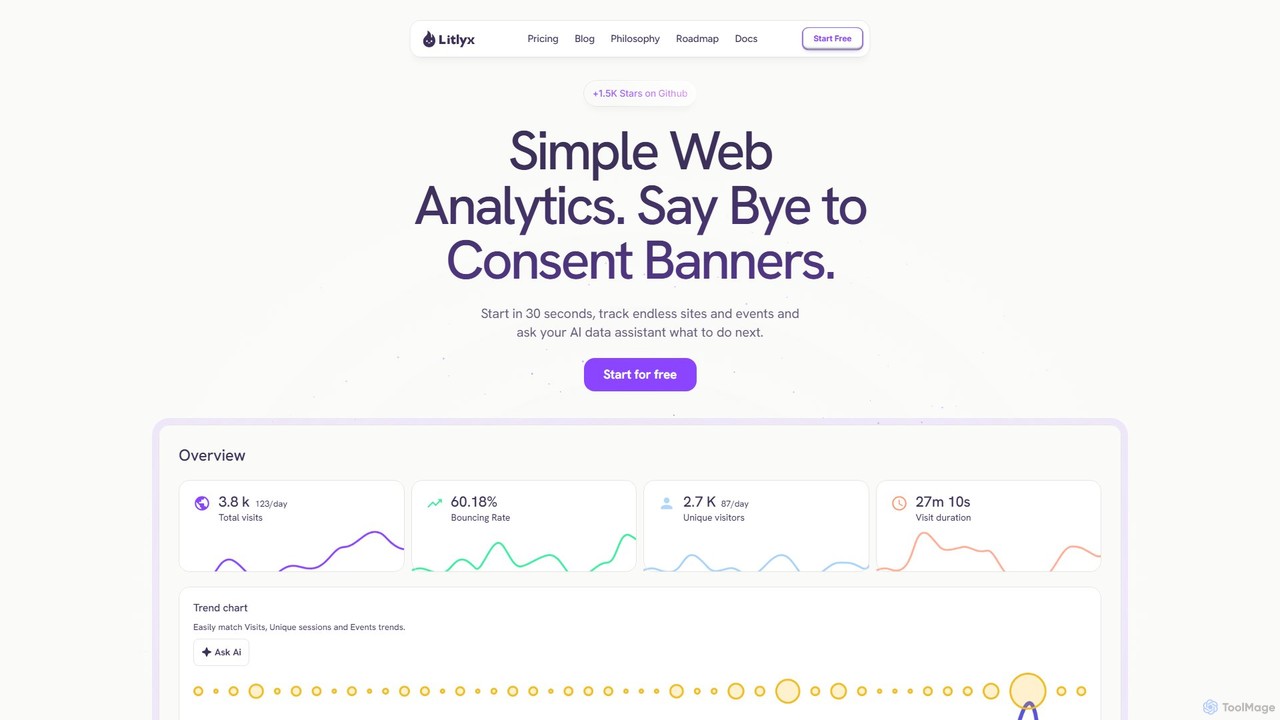
Litlyx
Litlyx is a privacy-first, GDPR-compliant web analytics tool designed as a simple, fast, and powerful alternative to Google …
Litlyx is a privacy-first, GDPR-compliant web analytics tool designed as a simple, fast, and powerful alternative to Google Analytics. It operates without cookies, eliminating the need for consent banners. Featuring an AI data assistant, it allows users to get insights by asking questions in natural language.
Hexometer
Hexometer is a 24/7 AI-powered website monitoring platform that acts like a dedicated QA team. It continuously checks …
Hexometer is a 24/7 AI-powered website monitoring platform that acts like a dedicated QA team. It continuously checks your website across six key areas: availability, performance, user experience, health, SEO, and security, providing real-time alerts to help you protect and grow your online business.
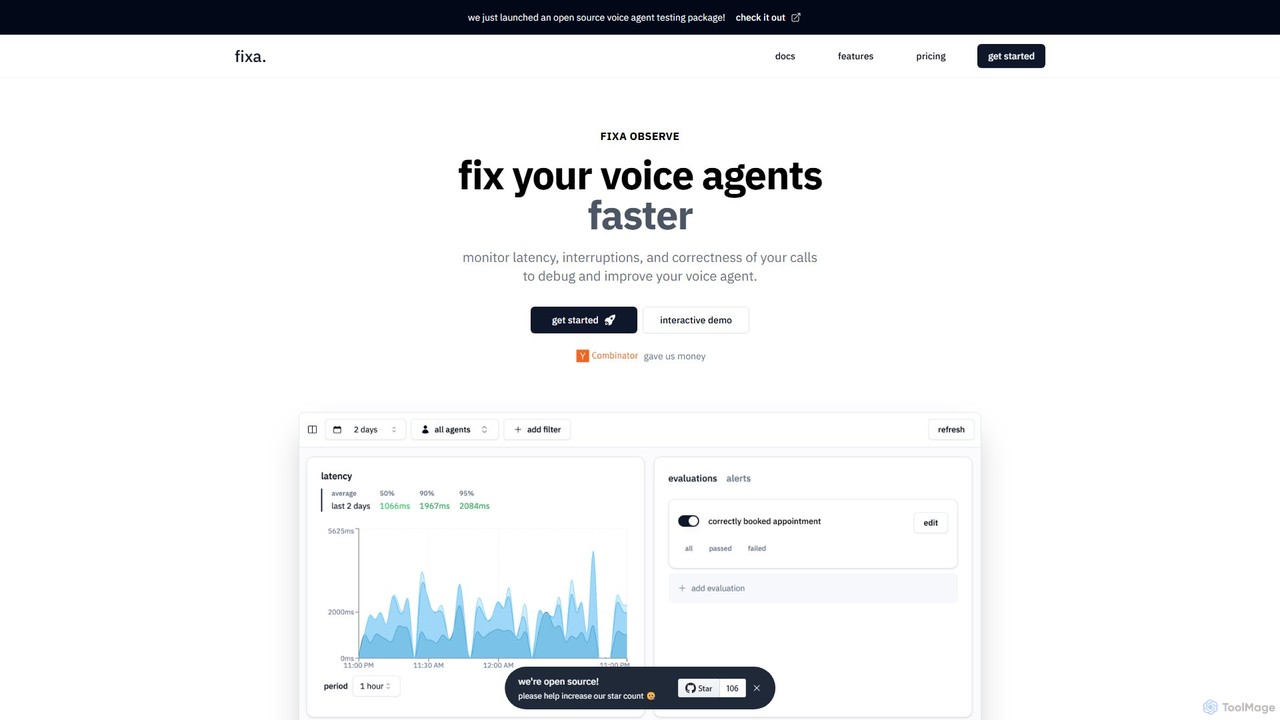
fixa
fixa is an open-source observability platform designed specifically for AI voice agents. It helps developers monitor, debug, and …
fixa is an open-source observability platform designed specifically for AI voice agents. It helps developers monitor, debug, and improve their voice AI by tracking key metrics like latency, interruptions, and conversational correctness, ensuring a high-quality user experience.
gptping
An AI-powered platform for monitoring and benchmarking the performance, latency, and cost of various Large Language Models (LLMs). …
An AI-powered platform for monitoring and benchmarking the performance, latency, and cost of various Large Language Models (LLMs). It helps developers and businesses choose the best model for their applications and ensure optimal performance and cost-efficiency.
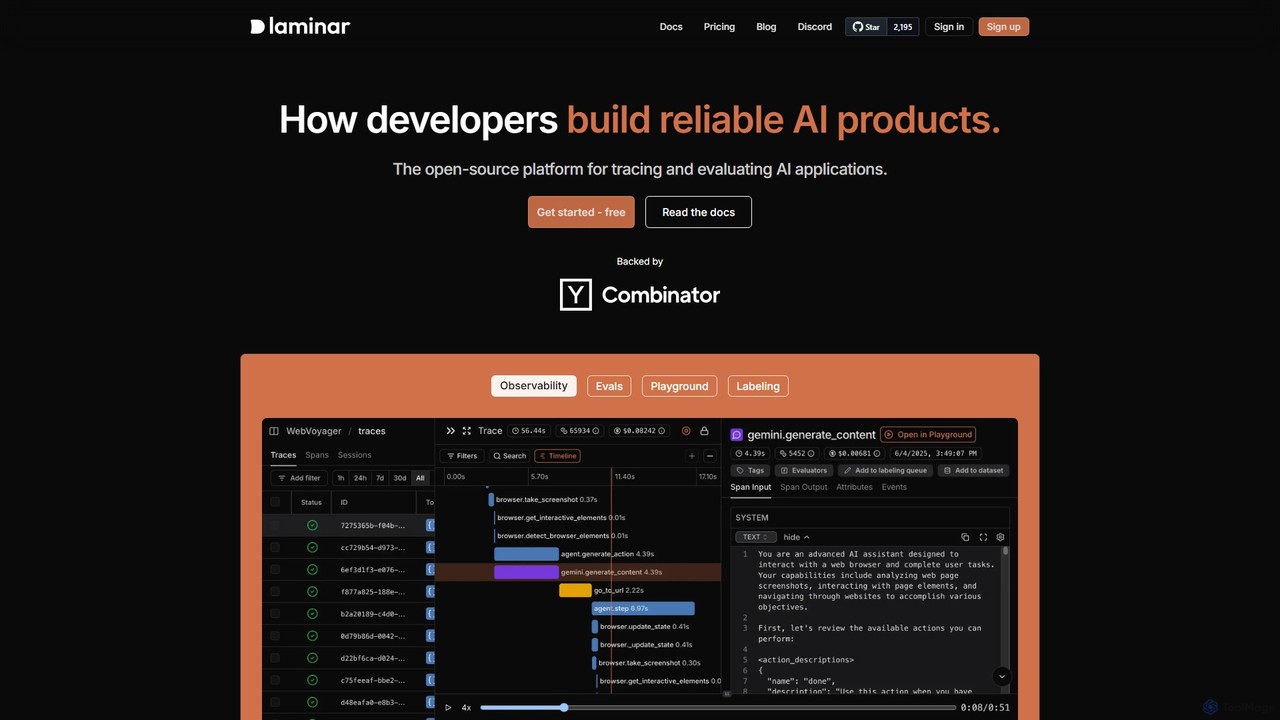
Laminar
Laminar is an open-source observability and evaluation platform designed for developers building reliable AI applications. It provides comprehensive …
Laminar is an open-source observability and evaluation platform designed for developers building reliable AI applications. It provides comprehensive tools for tracing, evaluating, and debugging LLM-powered systems. Key features include real-time tracing, browser agent observability, an interactive playground, and integrated dataset management, simplifying the entire MLOps lifecycle from development to production.
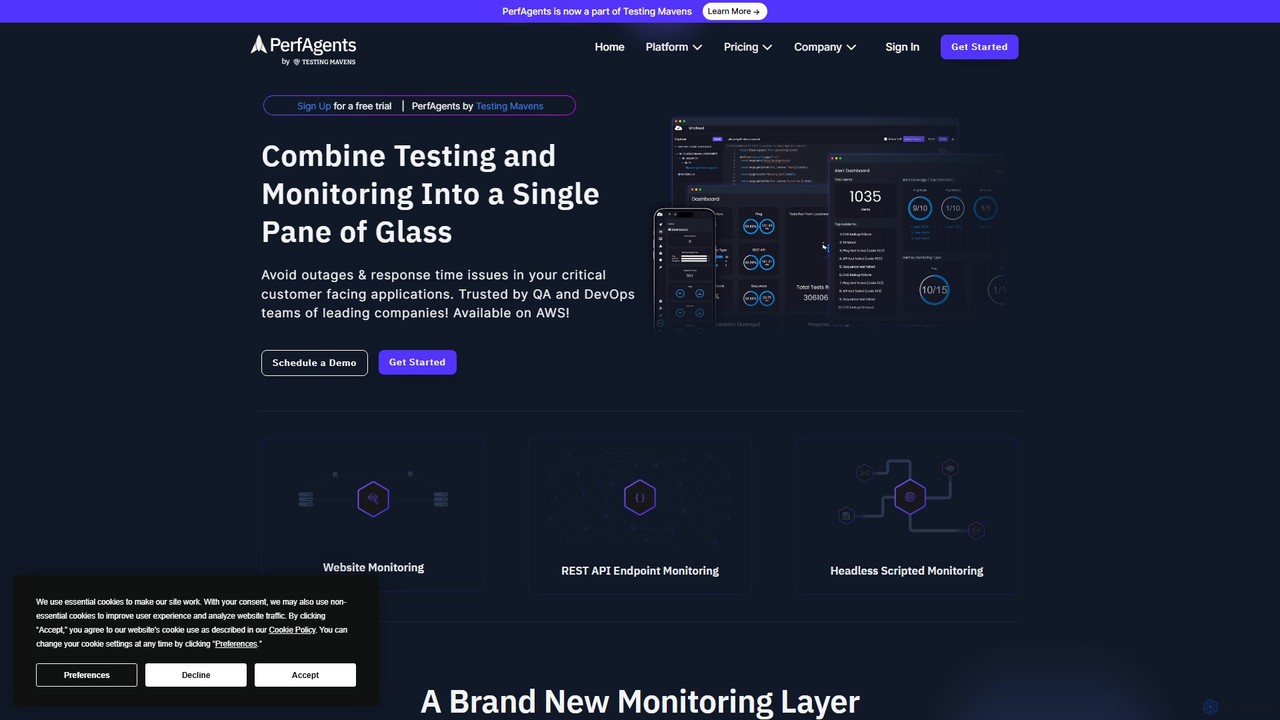
PerfAgents
PerfAgents is an AI-powered synthetic monitoring platform designed for QA and DevOps teams. It leverages existing test scripts …
PerfAgents is an AI-powered synthetic monitoring platform designed for QA and DevOps teams. It leverages existing test scripts from frameworks like Playwright, Selenium, and Cypress, or generates new ones using natural language to continuously monitor website and API performance, availability, and critical user flows from global locations.
About Monitoring
AI Monitoring tools are a specialized category of developer utilities that use machine learning to analyze and interpret system health, performance, and operational data. Unlike traditional systems that rely on predefined thresholds, these tools automatically detect anomalies, identify complex patterns in logs and metrics, and predict potential issues before they impact users. They provide deep, actionable insights into application behavior, significantly reducing mean time to resolution (MTTR) and simplifying the management of complex, distributed architectures. This proactive approach is crucial for maintaining reliability in modern software environments.
Core Features
- Anomaly Detection: Automatically identifies unusual deviations from baseline performance in metrics, logs, and traces without manual rule-setting.
- AI-Powered Root Cause Analysis (RCA): Correlates disparate events and data points across the tech stack to pinpoint the likely source of a problem.
- Predictive Analytics: Forecasts future trends, such as resource consumption or error rates, to prevent outages before they occur.
- Log Pattern Recognition: Clusters massive volumes of unstructured log data to surface emerging errors and unknown issues automatically.
- Smart Alerting & Noise Reduction: Groups related alerts into single incidents and suppresses low-priority notifications to combat alert fatigue.
Applicable Scenarios
These tools are essential for Site Reliability Engineers (SREs), DevOps teams, and developers managing cloud-native applications, microservices, and Kubernetes environments. They are particularly valuable in high-velocity CI/CD pipelines for detecting performance regressions and for monitoring large-scale systems where manual analysis is impractical. Any organization aiming for high availability and rapid incident response can benefit from AI-driven monitoring.
Selection Criteria
When choosing an AI Monitoring tool, evaluate its integration capabilities with your existing stack (e.g., AWS, Azure, Kubernetes). Assess the types of data it supports (logs, metrics, traces, events) and the sophistication of its machine learning models. Also consider the ease of implementation, the clarity of its visualizations and root cause analysis reports, and a pricing model that aligns with your data volume and growth.
MonitoringUse Cases
Proactive Outage Prevention for E-commerce
An SRE team for a major e-commerce platform uses an AI Monitoring tool to prepare for a Black Friday sales event. The tool analyzes historical performance data and predicts a 300% traffic spike will likely cause database connection pool exhaustion. Based on this predictive alert, the team proactively scales the database replicas and adjusts connection limits two hours before the sale begins. As a result, the platform handles the peak load without any performance degradation or downtime, protecting millions in revenue and maintaining customer trust.
Automated Root Cause Analysis in Microservices
A developer is alerted to a slow checkout process in a microservices-based application. Instead of manually checking logs from dozens of services, they consult their AI Monitoring tool. The tool's service map visualizes the entire transaction flow and automatically highlights a specific 'payment-gateway' service with abnormally high latency. It correlates this latency spike with a recent code deployment and a surge in error logs from that service, identifying the root cause in under five minutes. This allows the developer to immediately roll back the faulty deployment, restoring service quickly.
Intelligent Log Analysis for Security Anomaly Detection
A security operations team uses an AI Monitoring tool to analyze authentication logs from across their entire infrastructure. The tool's machine learning model, trained on baseline activity, detects a novel pattern: a series of successful logins from a geographically unusual IP range targeting non-critical services, followed by failed privilege escalation attempts. This subtle pattern did not trigger any single threshold-based alert. The AI tool flagged it as a high-risk anomaly, allowing the security team to investigate and block the malicious actor before they could compromise sensitive systems.
Optimizing Cloud Resource Costs with AI Insights
A DevOps team is tasked with reducing a company's monthly cloud bill. They deploy an AI Monitoring tool that analyzes resource utilization (CPU, memory, network) across hundreds of virtual machines. The tool identifies a cluster of servers consistently operating at less than 10% CPU utilization, even during peak hours. It recommends downsizing these instances to a more cost-effective machine type. By following this AI-driven recommendation, the team reduces their cloud spend by 18% without impacting application performance, directly contributing to the company's bottom line.
Detecting Performance Regressions in CI/CD Pipelines
A software development team integrates their AI Monitoring tool with their CI/CD pipeline. After a new feature is merged, the automated test suite runs. The monitoring tool analyzes the performance metrics of this build and compares them against a dynamic baseline of previous successful builds. It automatically flags a 20% increase in API response time for a critical endpoint, even though all functional tests passed. This allows the team to catch the performance regression before the code is deployed to production, preventing a negative impact on user experience.
Reducing Alert Fatigue for a Mobile App Backend Team
A small backend team for a popular mobile app was receiving over 500 alerts per day, most of which were noise from temporary network fluctuations. They implemented an AI Monitoring tool with smart alerting capabilities. The tool learned the normal patterns and began to automatically group related, flapping alerts into a single incident. For example, 20 individual 'high latency' alerts from different servers during a brief network hiccup were consolidated into one incident titled 'Transient Network Latency Detected Across EU-West-1'. This reduced their daily alert volume by over 90%, allowing them to focus only on real, actionable issues.