hawkflow.ai
Visit Website
hawkflow.ai Overview
HawkFlow.ai is a comprehensive and flexible monitoring platform designed to be an essential part of every engineer's toolkit. It provides a single, unified dashboard for technology leaders, developers, and data scientists to track a wide array of metrics and events across their systems. From application performance and infrastructure health to product KPIs and machine learning model accuracy, HawkFlow.ai centralizes monitoring to save time, reduce stress, and enable proactive issue resolution.
The platform is built with simplicity and developer experience in mind. Instead of complex configurations and infrastructure setup, HawkFlow.ai offers straightforward integration through a simple REST API and a dedicated Python library. This allows engineers to embed monitoring directly into their code, giving them full control over what data is sent and when. The core philosophy is that if you can code it, you can monitor it, making the possibilities for tracking virtually limitless.
How to use hawkflow.ai
Getting started with HawkFlow.ai is designed to be quick and easy. The primary method of integration is through its Python library, but a REST API is also available for other languages.
- Installation: Begin by installing the HawkFlow client library in your Python environment using a simple pip command:
pip install hawkflow. - Authentication: Authenticate the client in your application by instantiating the HawkflowAPI class with your unique API key. This only needs to be done once in your app.
- Timing Code: To monitor the performance of specific code blocks, you can use the
hf.start()andhf.end()methods around the code you wish to time. Alternatively, you can use the@HawkflowTimeddecorator on any function for a cleaner implementation. - Sending Metrics: You can send any numerical data as custom metrics. Simply create a dictionary of your metrics and use the
hf.metrics()method to send them to your dashboard. This is perfect for tracking business KPIs, system loads, or user counts. - Tracking Exceptions: Capture and send exceptions directly to HawkFlow using the
hf.exception()method within a try-except block. This helps you monitor and analyze errors as they occur in real-time.
All the data you send—timings, metrics, and exceptions—is immediately available for visualization and analysis on your HawkFlow.ai dashboard.
Core Features of hawkflow.ai
- Unified Monitoring: Consolidate monitoring for data, infrastructure, applications, KPIs, ML models, cron jobs, and more into a single platform.
- Performance Timing: Easily time any part of your code using simple functions or decorators to identify performance bottlenecks.
- Custom Metrics Tracking: Send any numerical data to track business-specific KPIs, system health, or user activity.
- Exception and Error Logging: Automatically capture and log exceptions from your applications for quick analysis and debugging.
- Simple Integration: Get started in minutes with a lightweight Python library and a flexible REST API, requiring no complex setup.
- MLOps Monitoring: Specifically designed to integrate with machine learning workflows, allowing you to monitor model training processes and prediction accuracy.
- Apache Airflow Integration: A dedicated integration for monitoring your Airflow DAGs and tasks.
- Automatic Alerts: Set up alerts to be notified of issues, performance degradation, or anomalies before they impact users.
Use Cases for hawkflow.ai
For Engineering Managers & Tech Leaders: Gain a high-level, real-time overview of the entire technology stack. Track team productivity, system uptime, and cloud costs without needing constant status updates from the team.
For Software Developers: Integrate monitoring as part of the development process. Pinpoint performance issues, debug errors faster, and understand the impact of new releases on the existing architecture.
For Data Scientists & ML Engineers: Monitor the entire lifecycle of machine learning models. Track data pipeline performance, model accuracy, and detect data drift. HawkFlow.ai serves as a lightweight MLOps solution.
For Product Managers: Track key product KPIs and customer activity directly from the application's backend, providing valuable insights into feature usage and user behavior without relying on separate analytics tools.
Advantages of hawkflow.ai
The primary advantage of HawkFlow.ai is its simplicity and flexibility. It empowers engineers to monitor anything they can imagine with minimal effort. By centralizing all monitoring data, it breaks down silos between teams and provides a single source of truth. This leads to earlier warnings of potential issues, better-informed decision-making, and a more stable and reliable system. The developer-first approach ensures that monitoring becomes a natural part of the workflow rather than a burdensome task.
Pricing and Plans
HawkFlow.ai operates on a freemium model, making it accessible for individuals and small teams to get started.
- Free Plan: Includes 15,000 API calls per month (with a limit of 500 per 24 hours), support for up to 5 users, community access, and unlimited email support. No credit card is required to sign up.
- Developer Plan (Coming Soon): 50,000 API calls per month, 2,500 API calls per 24 hours, up to 5 users.
- Teams Plan (Coming Soon): 100,000 API calls per month, 5,000 API calls per 24 hours, up to 5 users.
- Enterprise Plan (Coming Soon): Unlimited API calls, unlimited users, and dedicated support.
hawkflow.ai Comments (0)
Log in to post comments
Log in nowhawkflow.ai Alternatives
View All
New Relic
New Relic is an AI-powered, full-stack observability platform that helps engineering teams monitor, debug, and improve their entire …
New Relic is an AI-powered, full-stack observability platform that helps engineering teams monitor, debug, and improve their entire software stack. It provides a unified view of all telemetry data—metrics, events, logs, and traces—to enable faster problem resolution and optimized performance in the AI era.
fixa
fixa is an open-source observability platform designed specifically for AI voice agents. It helps developers monitor, debug, and …
fixa is an open-source observability platform designed specifically for AI voice agents. It helps developers monitor, debug, and improve their voice AI by tracking key metrics like latency, interruptions, and conversational correctness, ensuring a high-quality user experience.
Helicone
Helicone is an open-source platform offering an AI Gateway and LLM Observability for developers. It helps build reliable …
Helicone is an open-source platform offering an AI Gateway and LLM Observability for developers. It helps build reliable AI applications by providing tools to route, monitor, debug, and analyze LLM usage. Key features include a unified API for 100+ models, intelligent caching, rate limiting, prompt management, and detailed performance analytics.
Mux
Mux is a developer-first video API platform that simplifies the integration of live and on-demand video. It provides …
Mux is a developer-first video API platform that simplifies the integration of live and on-demand video. It provides robust infrastructure for encoding, streaming, and real-time analytics, enabling businesses to deliver high-quality video experiences at scale. Mux offers two core products: Mux Video for streaming and Mux Data for Quality of Experience (QoE) monitoring.
OpenReplay
OpenReplay is a self-hostable, open-source session replay and product analytics suite. It empowers teams to understand user behavior, …
OpenReplay is a self-hostable, open-source session replay and product analytics suite. It empowers teams to understand user behavior, reproduce bugs faster, and optimize digital experiences. By providing visual context alongside technical data like console logs and network activity, OpenReplay helps engineers, product managers, and support teams identify frictions, improve conversion funnels, and enhance overall product usability while maintaining full control over customer data.
Laminar
Laminar is an open-source observability and evaluation platform designed for developers building reliable AI applications. It provides comprehensive …
Laminar is an open-source observability and evaluation platform designed for developers building reliable AI applications. It provides comprehensive tools for tracing, evaluating, and debugging LLM-powered systems. Key features include real-time tracing, browser agent observability, an interactive playground, and integrated dataset management, simplifying the entire MLOps lifecycle from development to production.
Site24x7
Site24x7 is an AI-powered, all-in-one observability platform for DevOps and IT operations. It provides comprehensive monitoring for websites, …
Site24x7 is an AI-powered, all-in-one observability platform for DevOps and IT operations. It provides comprehensive monitoring for websites, servers, cloud infrastructure (AWS, Azure, GCP), networks, and applications from a single console. It helps ensure uptime, troubleshoot performance issues, and optimize user experience.
Dataiku
Dataiku is the Universal AI Platform™, enabling organizations to build, deploy, and manage AI and analytics applications. It …
Dataiku is the Universal AI Platform™, enabling organizations to build, deploy, and manage AI and analytics applications. It provides a collaborative, end-to-end environment for everyone, from data analysts to data scientists, to work with data, create machine learning models, and build enterprise-grade Generative AI solutions with robust governance and scalability.
gptping
An AI-powered platform for monitoring and benchmarking the performance, latency, and cost of various Large Language Models (LLMs). …
An AI-powered platform for monitoring and benchmarking the performance, latency, and cost of various Large Language Models (LLMs). It helps developers and businesses choose the best model for their applications and ensure optimal performance and cost-efficiency.
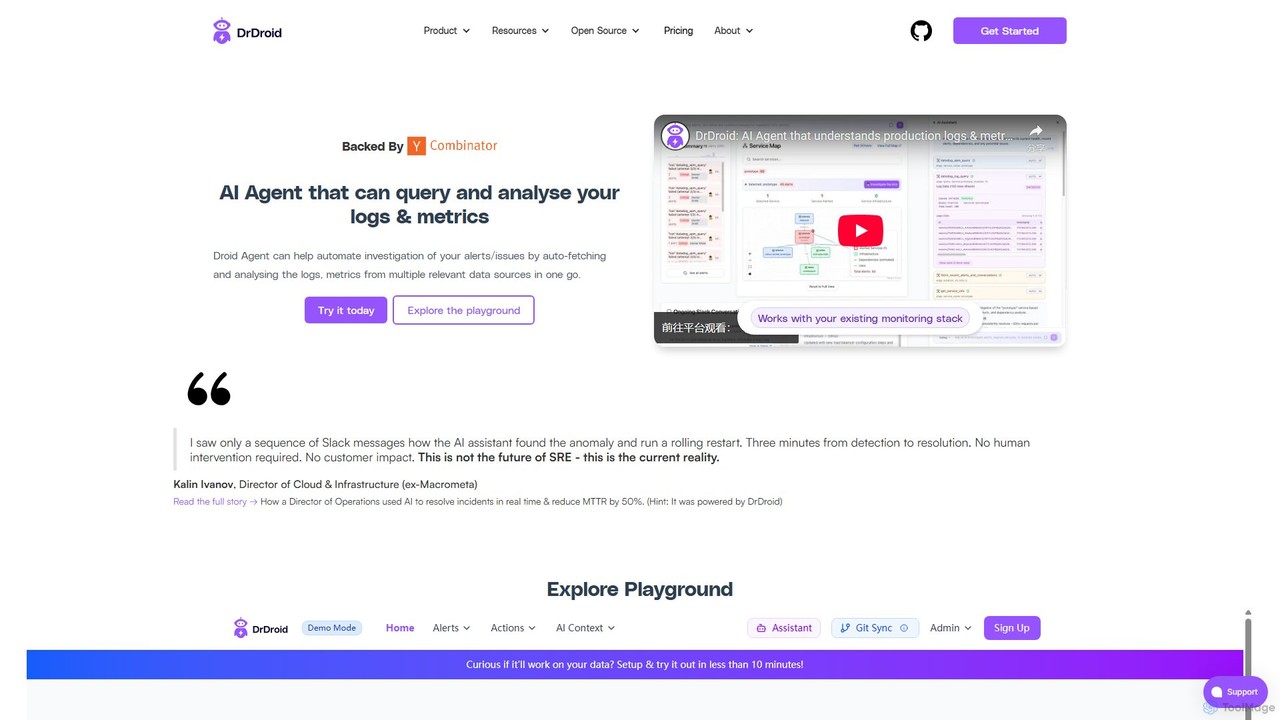
drdroid
drdroid is an AI-powered agent for observability and production monitoring, designed for SRE and DevOps teams. It automates …
drdroid is an AI-powered agent for observability and production monitoring, designed for SRE and DevOps teams. It automates incident investigation by querying and analyzing logs and metrics from multiple sources. By integrating with your existing stack via Slack, it helps reduce alert fatigue, slash MTTR (Mean Time to Resolution), and transform runbooks into self-healing systems, acting as a 24/7 AI SRE.
hawkflow.ai Category
hawkflow.ai Tag
hawkflow.ai AI Tool Comparison
hawkflow.ai Embed Feature
Just copy the embed code below and paste this beautiful badge on your blog, article, or official app website to drive traffic directly to this tool's detail page and quickly boost your exposure and user count!

No comments yet, be the first to comment!