Miro
Miro is an AI-powered online collaborative whiteboard platform designed for modern teams. It provides an infinite canvas for …
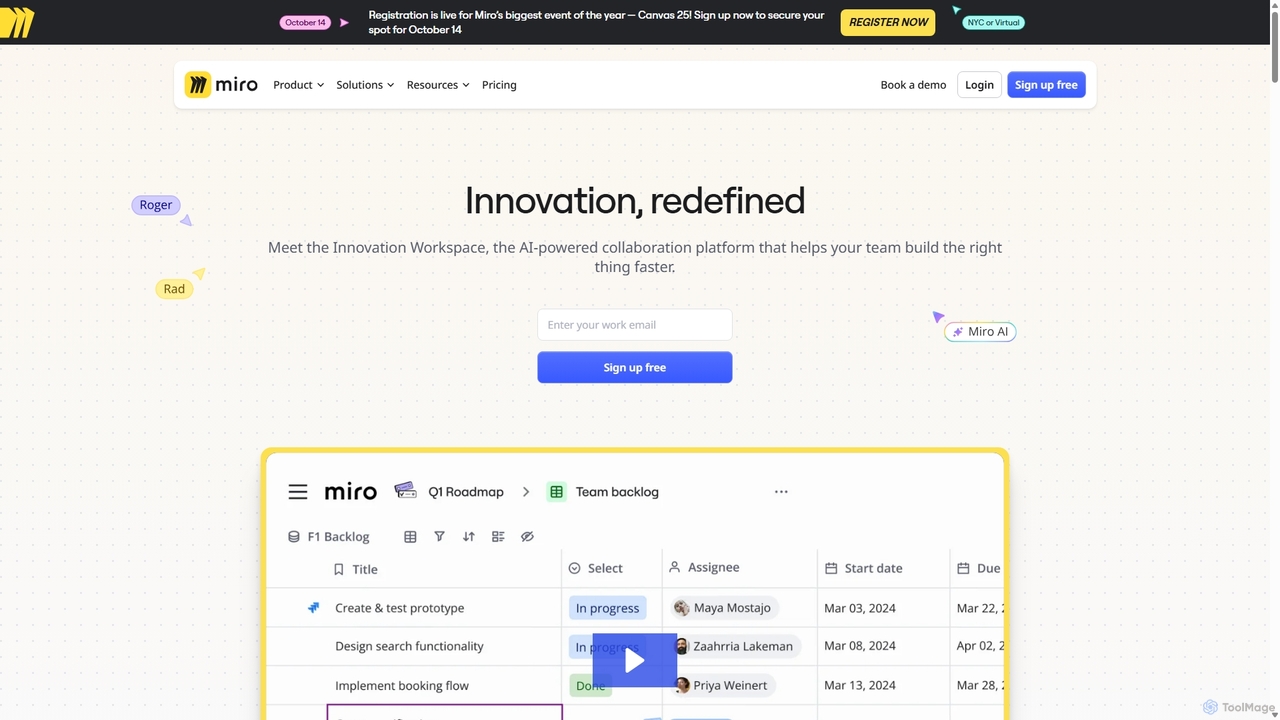
Miro is an AI-powered online collaborative whiteboard platform designed for modern teams. It provides an infinite canvas for brainstorming, planning, designing, and managing projects in real-time. With a vast template library, powerful integrations, and AI-driven features, Miro helps teams centralize communication and accelerate innovation from idea to execution.
About Visual Management
Visual Management tools are a specialized category of project management software that uses visual interfaces like boards, charts, and timelines to track workflows. These AI-powered platforms translate complex project data into intuitive, at-a-glance formats, automatically updating statuses and identifying potential bottlenecks. This approach enhances team collaboration, provides immediate clarity on project progress, and accelerates decision-making. Unlike traditional list-based systems, visual management excels at communicating status and dependencies instantly across teams.
Core Features
- Interactive Boards (Kanban/Scrum): Use drag-and-drop cards on customizable boards to represent tasks moving through different stages of a workflow.
- Dynamic Timelines (Gantt Charts): Visualize project schedules, map out task dependencies, and track milestones over time.
- AI-Powered Dashboards: Automatically generate real-time reports and charts that summarize project health, team performance, and resource allocation.
- Workflow Automation: Set rules to automate repetitive actions, such as assigning tasks or notifying stakeholders when a card moves to a new column.
- Resource & Workload Visualization: Gain a clear visual overview of team capacity and individual workloads to ensure balanced task distribution.
Use Cases
These tools are widely adopted by agile software development teams for sprint planning, marketing teams for managing campaigns, and creative agencies for tracking content production pipelines. They are also effective in manufacturing for process monitoring and in consulting for transparent client project tracking.
How to Choose
When selecting a tool, first consider your team's preferred methodology (e.g., Kanban for flexibility, Gantt for structured planning). Evaluate the sophistication of its AI features, such as predictive analytics for deadlines or automatic risk detection. Also, assess its integration capabilities with your existing software stack and its level of customization for workflows and reporting.
Visual ManagementUse Cases
Agile Sprint Planning and Execution
A software development team uses a visual Scrum board to manage their two-week sprint. The Product Owner adds user stories to the 'Backlog' column. During sprint planning, the team moves selected stories to 'To Do' and assigns them. As developers work, they drag cards through 'In Progress', 'In Review', and finally to 'Done'. The visual board provides complete transparency for the Scrum Master and stakeholders, allowing them to see progress in real-time and identify any tasks that are blocked or delayed without needing daily status meetings.
Managing a Marketing Campaign Timeline
A marketing manager uses a visual Gantt chart to plan a product launch campaign. They create tasks for each activity: 'Market Research', 'Content Creation', 'Ad Design', and 'Social Media Launch'. Dependencies are set so that 'Ad Design' cannot start until 'Content Creation' is complete. The timeline clearly shows the project's critical path. An AI feature analyzes the timeline and flags a high risk of delay for the 'Social Media Launch' due to an overloaded designer, prompting the manager to reallocate resources proactively.
Visualizing a Content Production Pipeline
A content team at a media company uses a Kanban board to manage their editorial calendar. Each article is a card that moves through stages: 'Idea', 'Drafting', 'Editing', 'SEO Review', and 'Published'. Editors, writers, and SEO specialists are assigned to cards and can communicate via comments. The board provides a bird's-eye view of the entire content pipeline, helping the head of content to easily spot bottlenecks (e.g., too many articles stuck in 'Editing') and manage team workload effectively.
Tracking Client Projects for an Agency
A design agency creates a separate visual board for each client project. The columns represent the agency's workflow: 'Briefing', 'Concept Design', 'Client Feedback', 'Revisions', and 'Final Delivery'. This board can be shared with the client, providing them with a transparent, real-time view of their project's status. This reduces the need for constant email updates and status calls, improving client satisfaction and freeing up the project manager's time to focus on execution rather than communication.
Monitoring Manufacturing Production Flow
A factory supervisor uses a large digital dashboard connected to the production line. Each stage of manufacturing, from 'Raw Materials' to 'Assembly' to 'Quality Check' to 'Packaging', is represented as a column. As items move through the line, their status is automatically updated on the board via sensor data. The AI system analyzes the flow and highlights a bottleneck in the 'Quality Check' stage, alerting the supervisor to allocate more staff to that station before a major backlog occurs, thus maintaining production efficiency.
Personal Productivity and Goal Tracking
A freelancer uses a simple personal Kanban board to organize their weekly tasks. They create columns for 'To Do', 'In Progress', and 'Done'. Larger goals, like 'Launch New Website', are broken down into smaller, manageable task cards. This visual approach helps them stay focused, prioritize daily work, and provides a satisfying sense of accomplishment as they move cards to the 'Done' column. It transforms a daunting to-do list into an organized and motivating workflow.