Causal
vs
Coefficient
A comprehensive comparison of the core features, performance, user experience, and pricing strategies of two excellent AI tools
Providing objective and detailed selection advice based on real data and user feedback
Overview
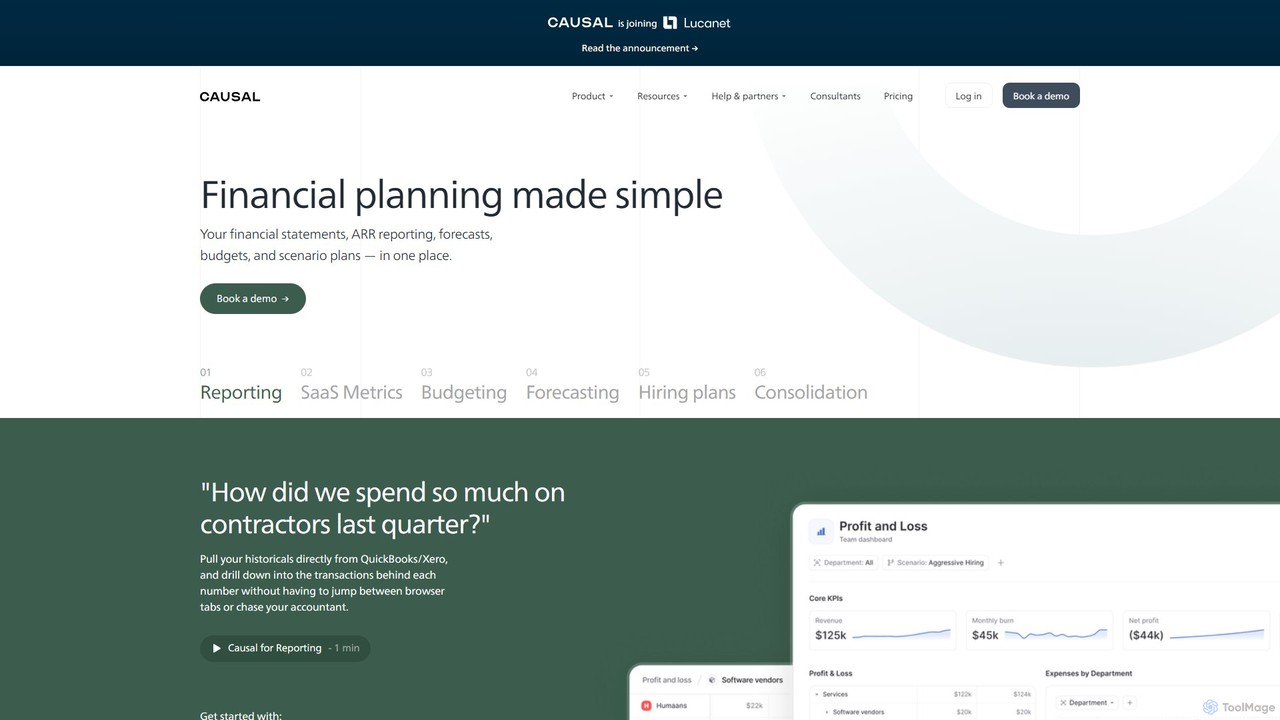
Causal Overview
Discover Causal, the AI-driven platform that replaces spreadsheets for financial modeling, forecasting, and reporting. Integrate live data, build models with simple formulas, and plan scenarios effortlessly.
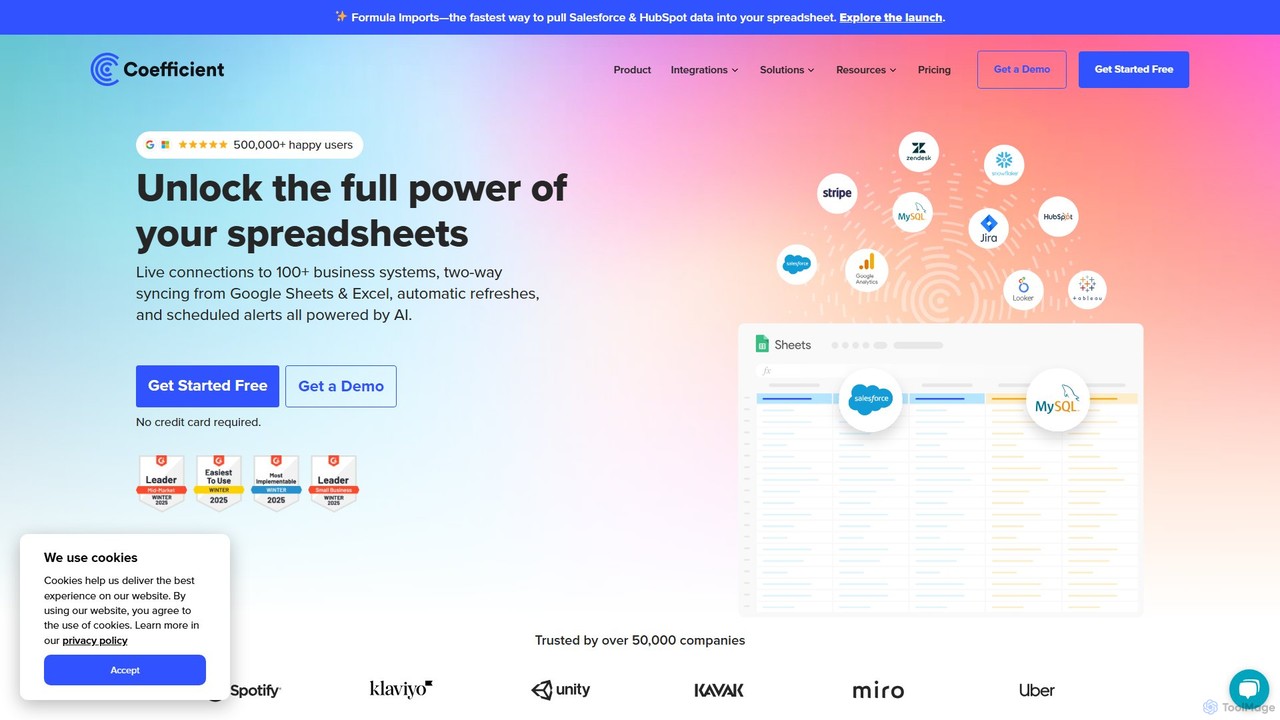
Coefficient Overview
Connect Google Sheets & Excel to Salesforce, HubSpot, and 100+ systems with Coefficient. Automate data imports, create live dashboards, and use AI to build formulas and reports instantly.
Detailed Feature Comparison
Comprehensive comparison of the core features and characteristics of two AI tools
| Features | Causal | Coefficient |
|---|---|---|
| Main Categories | Financial Planning | Spreadsheets |
| Inclusion Date | 2025-08-13 | 2025-08-01 |
| Pricing Type | Is Paid | Freemium |
| Official Website | https://causal.app/ | https://coefficient.io/ |
| Tool Type | Website | Browser Extension |
| Performance Data | ||
| User Rating | No Rating Yet | No Rating Yet |
| User Reviews | 0 reviews | 0 reviews |
| Monthly Visits | 26.6K | 175.1K |
| Details | View Details | View Details |
Compare Traffic / Monthly Visits
Causal's traffic
Causal Current monthly visible visits are 26.6K.
Latest Traffic
Monthly Traffic Trend
Geography
Top 5 Countries/Regions
| Country/Region | Percentage | Traffic |
|---|---|---|
|
🇺🇸
United States
|
27.62% | 7.3K |
|
🇻🇳
Vietnam
|
24.48% | 6.5K |
|
🇬🇧
United Kingdom
|
19.76% | 5.3K |
|
🇩🇪
Germany
|
15.72% | 4.2K |
|
🇦🇺
Australia
|
12.42% | 3.3K |
Popular Keywords
Coefficient's traffic
Coefficient Current monthly visible visits are 175.1K.
Latest Traffic
Monthly Traffic Trend
Geography
Top 5 Countries/Regions
| Country/Region | Percentage | Traffic |
|---|---|---|
|
🇺🇸
United States
|
61.27% | 107.3K |
|
🇮🇳
India
|
15.99% | 28.0K |
|
🇬🇧
United Kingdom
|
7.99% | 14.0K |
|
🇮🇩
Indonesia
|
7.86% | 13.8K |
|
🇵🇭
Philippines
|
6.89% | 12.1K |
Traffic source
| Source Type | Percentage | Traffic |
|---|---|---|
|
Direct Access
|
60.65% | 106.2K |
|
Referral
|
37.55% | 65.7K |
|
Email
|
1.80% | 3.2K |
Popular Keywords
Usage Comparison
Compare Causal and Coefficient 's Advantages
Causal's Core Features
Coefficient's Core Features
Use Cases
Understand the specific application scenarios and functional characteristics of the two AI tools
Causal Use Cases
Coefficient Use Cases
Causal vs Coefficient:In-depth Comparison Analysis and Selection Recommendations
Comprehensive comparison and evaluation based on real data and user feedback
Market Performance and User Preference Analysis
- Core positioning: Causal leans more toward Financial Planning, while Coefficient leans more toward Spreadsheets.
- Traffic Signal: Coefficient currently has higher monthly traffic, serving as a reference for market attention.
- Neither tool has reviewed ratings yet; it is recommended to prioritize comparing functional positioning, price, and actual trial experience.
Coefficient has about 175.1K monthly visits, higher than Causal at 26.6K. Use this as a signal of market attention, not as product quality by itself.
In-depth Analysis of User Engagement
Both tools have third-party traffic analysis records, allowing comparison of visits, dwell time, pages per visit, and bounce rate; these metrics should be considered alongside the tool's purpose.
User Reviews vs. Community Feedback
Causal has no reviewed ratings yet. Coefficient has no reviewed ratings yet.
Product Positioning and Application Scenario Analysis
Causal is in Financial Planning with a Is Paid pricing model; Coefficient is in Spreadsheets with a Freemium pricing model. Prioritize fit for your specific tasks rather than traffic or default ratings alone.
Frequently Asked Questions
FAQs about these two tools to help you better understand their features and differences
What are the biggest differences between the two?
Causal is primarily positioned in Financial Planning, while Coefficient is primarily positioned in Spreadsheets. Which one suits you depends on which type of use case and workflow you need more.
Which tool is better to try first?
Coefficient currently has higher market attention, making it suitable for initial understanding; the final decision should still be based on specific functional needs after trial.
How should ratings and traffic data be interpreted?
Ratings only count reviewed user comments; no default 5-star rating is given when there are no comments. Traffic is used to gauge market attention but cannot solely represent product quality.
Related Tool Recommendations
Discover more excellent AI tools of the same kind

Raccoon AI
Raccoon AI is a collaborative AI workspace that transforms conversations into web applications, presentations, reports, and designs. It …
Raccoon AI is a collaborative AI workspace that transforms conversations into web applications, presentations, reports, and designs. It integrates with your favorite tools to automate and execute complex creative and technical tasks.

Powabase
An energy market intelligence platform that transforms AI assistants into experts by providing real-time, integrated German energy data. …
An energy market intelligence platform that transforms AI assistants into experts by providing real-time, integrated German energy data. Currently in closed beta.
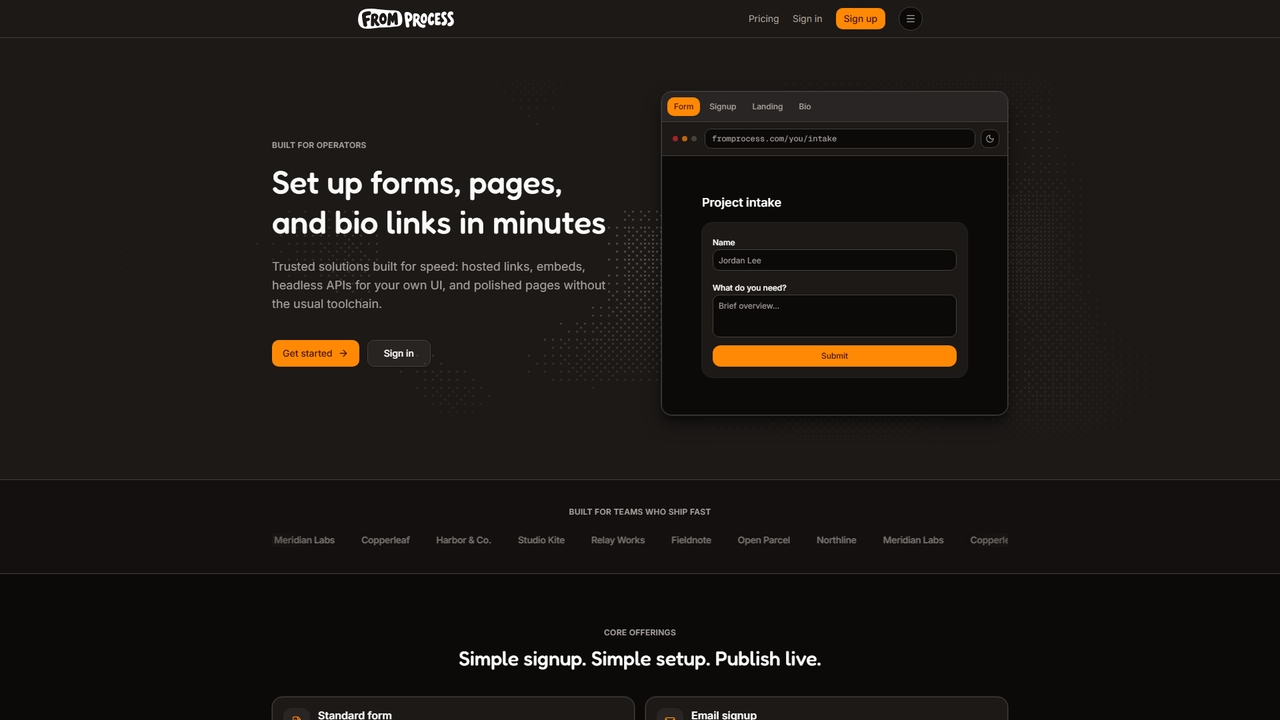
From Process
A platform for operators to quickly create forms, pages, and bio links with embedded options and agent support.
A platform for operators to quickly create forms, pages, and bio links with embedded options and agent support.
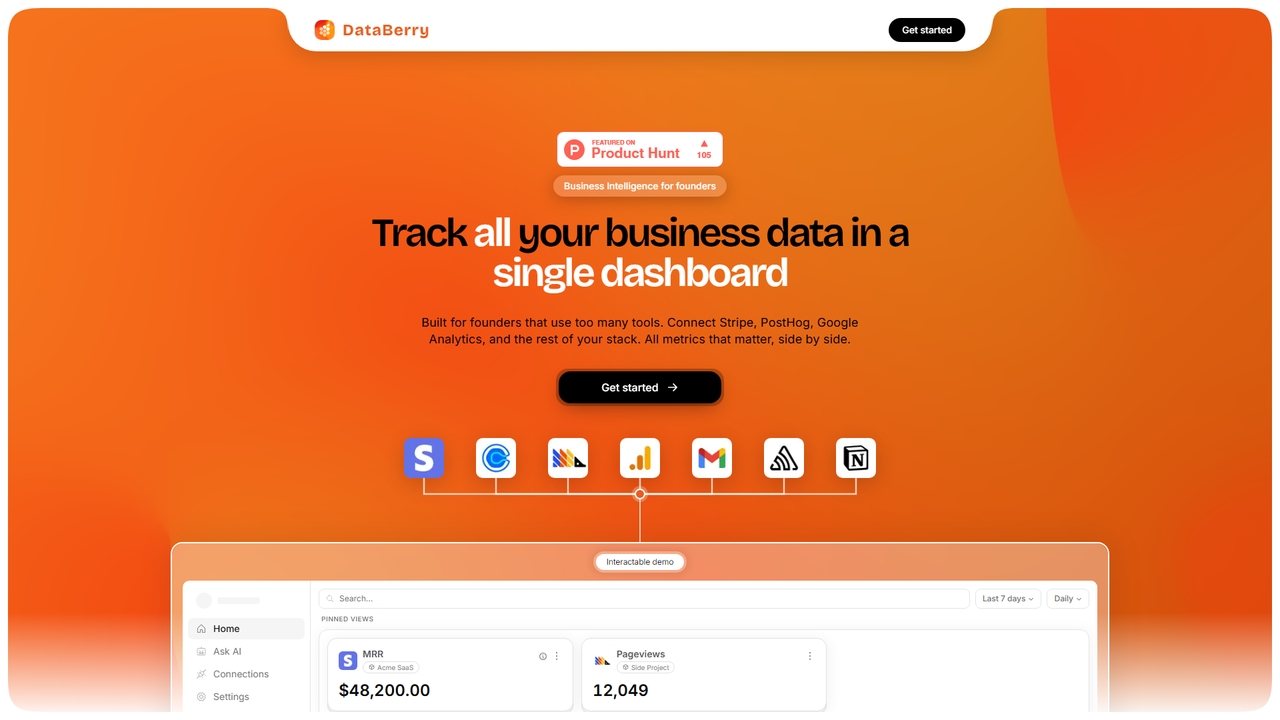
Databerry
A business intelligence dashboard for founders that unifies data from tools like Stripe, PostHog, and Google Analytics. Track …
A business intelligence dashboard for founders that unifies data from tools like Stripe, PostHog, and Google Analytics. Track all key metrics like MRR, user sign-ups, and errors on a single page with no code required.
Slideshot
Slideshot is an AI agent that generates polished product demo videos. Describe a feature flow, and it automatically …
Slideshot is an AI agent that generates polished product demo videos. Describe a feature flow, and it automatically drives your web app, records the walkthrough, and returns a ready-to-use MP4 for launches, changelogs, and docs.
Runtime
Runtime is a unified platform that provides secure, sandboxed runtime environments for your team's coding agents. It enables …
Runtime is a unified platform that provides secure, sandboxed runtime environments for your team's coding agents. It enables any team to safely leverage AI tools like Claude Code or Codex with integrated guardrails, context, and observability.
ProductLasso
ProductLasso is an AI-powered PIM (Product Information Management) platform for ecommerce. It automates data enrichment, supplier onboarding, and …
ProductLasso is an AI-powered PIM (Product Information Management) platform for ecommerce. It automates data enrichment, supplier onboarding, and competitive monitoring using thousands of specialized AI agents, helping teams save hundreds of hours weekly.
Dreambase
An AI-native analytics platform that connects directly to your Supabase database, providing instant dashboards, reports, and actionable insights …
An AI-native analytics platform that connects directly to your Supabase database, providing instant dashboards, reports, and actionable insights with minimal setup.

Autonoma
Autonoma is an AI-powered supplier discovery and procurement platform that automates the entire sourcing workflow. Describe your needs …
Autonoma is an AI-powered supplier discovery and procurement platform that automates the entire sourcing workflow. Describe your needs in plain language, and its AI agents find verified global suppliers, draft personalized RFIs, manage outreach campaigns, and analyze proposals—reducing manual research from weeks to minutes.

Everest
Everest is a high-performance, edge-optimized AI compute unit designed for automating enterprise workloads and enabling efficient on-premises AI …
Everest is a high-performance, edge-optimized AI compute unit designed for automating enterprise workloads and enabling efficient on-premises AI model deployment. Based on provided information, it appears to be a physical hardware solution (C1 Unit) focused on significant cost savings compared to cloud services, low standby power consumption, and scalable automation for large-scale operations. It is currently available for pre-order.

Lokuma Designer Agent
Lokuma Designer Agent is an AI-powered design intelligence layer that transforms raw, unstructured output from coding AI agents …
Lokuma Designer Agent is an AI-powered design intelligence layer that transforms raw, unstructured output from coding AI agents (like Cursor, Claude Code) into professionally structured and visually balanced designs. It acts as a built-in designer for your AI, automating layout composition, typography refinement, and visual consistency for web pages and digital interfaces.
Pinza
Pinza is a managed service that sets up and hosts a personal OpenClaw AI assistant for you within …
Pinza is a managed service that sets up and hosts a personal OpenClaw AI assistant for you within 24 hours, without requiring any technical knowledge or server management. It connects to your tools (like email and calendar) to automate tasks such as meeting scheduling, email summarization, and lead management, allowing freelancers and small businesses to leverage advanced AI effortlessly.
Buildify
Buildify is an AI-powered app builder that translates natural language prompts into production-ready, full-stack code. It enables developers …
Buildify is an AI-powered app builder that translates natural language prompts into production-ready, full-stack code. It enables developers and creators to quickly generate complete applications with UI, logic, and database components, then iterate through conversation.
SeekerClaw
SeekerClaw is a full-stack, self-aware AI agent designed to run natively on the Solana Seeker phone. It integrates …
SeekerClaw is a full-stack, self-aware AI agent designed to run natively on the Solana Seeker phone. It integrates Solana wallet management, device control, messaging via Telegram, and web intelligence into a persistent, autonomous agent that operates 24/7. Powered by Claude or OpenAI, it features a modular skill system and deep self-diagnostic capabilities.
MCP360
MCP360 is a unified gateway for connecting AI agents like Claude and Cursor to over 100+ production-ready tools …
MCP360 is a unified gateway for connecting AI agents like Claude and Cursor to over 100+ production-ready tools via the Model Context Protocol (MCP). It simplifies integration with a single subscription, offers a no-code custom MCP builder, and provides an interactive chat playground for real-time testing, accelerating AI workflow development.