Coefficient
Visit Website
Coefficient Overview
Coefficient is a powerful spreadsheet automation tool designed to modernize Google Sheets and Excel by connecting them to live data from your business systems. It bridges the gap between the familiar interface of spreadsheets and the complex data stored in CRMs, databases, and other SaaS platforms. Trusted by over 500,000 users, Coefficient eliminates the tedious and error-prone process of manual data exporting and copy-pasting, allowing teams to work with accurate, up-to-date information directly within their spreadsheets.
The core mission of Coefficient is to empower business users, from sales and marketing to finance and operations, to become self-sufficient in their data analysis. By providing a seamless connection to systems like Salesforce, HubSpot, Google Analytics, and various SQL databases, it turns static reports into dynamic, automated dashboards. This ensures that decisions are always based on the latest data, without the need for constant manual refreshes or reliance on technical teams.
How to use Coefficient
Using Coefficient is straightforward and integrates directly into your existing workflow:
- Installation: Install the Coefficient add-on for Google Sheets from the Google Workspace Marketplace or the extension for Excel from Microsoft AppSource.
- Launch: Open a new or existing spreadsheet and launch Coefficient from the 'Extensions' menu in Google Sheets or the 'Coefficient' tab in the Excel ribbon.
- Connect to a Source: In the Coefficient sidebar, select 'Import Data' and choose from a list of over 100 business systems. Connect your account in a single click.
- Import Data: Build your import by selecting objects and fields. You can apply filters to pull only the specific data you need. You can also use pre-built templates for common reports.
- Schedule Refreshes: Set your data to refresh automatically on an hourly, daily, or weekly schedule. This ensures your reports and dashboards are always live.
- Leverage AI: Use AI-powered features like the Formula Builder to generate complex spreadsheet formulas from text descriptions, the SQL Builder to write queries without knowing SQL, and the Chart & Pivot Builder to create visualizations instantly.
- Sync Data Back: Update or clean data in your spreadsheet and use the 'Export' feature to push the changes back to your source system (e.g., update records in Salesforce).
- Set Up Alerts: Create alerts to notify you or your team via Slack or email when specific data points change or meet certain conditions.
Core Features of Coefficient
- Live Data Connectivity: Connects Google Sheets and Excel to over 100 business systems, including CRMs (Salesforce, HubSpot), databases (MySQL, PostgreSQL, Snowflake), ad platforms, and more.
- Automated Data Refreshes: Schedule automatic data syncs to keep your spreadsheets updated hourly, daily, or weekly, eliminating manual work.
- Two-Way Syncing: Not only can you pull data into your sheets, but you can also push updated or cleaned data back to the source system, maintaining a single source of truth.
- AI-Powered Tools: Includes an AI Formula Builder, SQL Query Builder, and Chart/Pivot Table creator to accelerate data analysis and report building for all user levels.
- Pre-built Dashboard Templates: A library of ready-to-use templates for common use cases like sales forecasting, website performance, and financial analysis.
- Data Alerts & Monitoring: Trigger real-time notifications in Slack and email based on cell value changes or specific conditions, keeping teams informed of critical updates.
- Bulk Data Updates: Efficiently clean up data or update thousands of records in bulk directly from the comfort of your spreadsheet.
Use Cases for Coefficient
Coefficient is versatile and valuable across various departments:
- Sales Operations: Build real-time sales leaderboards, track pipeline health, and automate commission reports by connecting directly to Salesforce or HubSpot.
- Marketing Analytics: Consolidate performance data from Google Analytics, Facebook Ads, and other platforms into a single, always-on marketing dashboard.
- Financial Planning & Analysis (FP&A): Automate financial models, what-if scenario analysis, and P&L reporting by connecting to systems like QuickBooks.
- Revenue Operations (RevOps): Create a unified view of the customer journey by blending data from sales, marketing, and support systems to track key metrics and identify growth opportunities.
- Business Intelligence for All: Empower non-technical team members to perform their own data analysis and build reports without needing to learn complex BI tools or wait for the data team.
Advantages of Coefficient
The primary advantage of Coefficient is transforming spreadsheets from static documents into powerful, connected, and automated work hubs. It saves countless hours of manual work, drastically improves data accuracy by eliminating copy-paste errors, and democratizes data access across an organization. By allowing teams to work with live data in a familiar environment, it accelerates decision-making and boosts overall productivity.
Pricing and Plans
Coefficient offers a freemium model with plans for individuals and teams:
- Free Plan: $0/month. Designed for individuals to explore. Includes 1 user, connections to 3 data sources, a 5,000-row import limit, and up to 50 refreshes per month (daily schedule).
- Starter Plan: $49/month. For solo builders. Includes 1 user, 3 data sources, unlimited import size, 500 refreshes per month (hourly schedule), and 500 export runs.
- Pro Plan: $99/user/month. The most popular plan for small teams. Includes up to 5 users, 6 data sources, unlimited imports, 5,000 refreshes per month (hourly), more AI calls, and data alerts.
- Enterprise Plan: Custom pricing. For large teams needing advanced control and security. Offers custom user counts, access to all data sources, unlimited usage, custom SSO, and dedicated support.
A 30-day free trial of the Pro plan is available, and special discounts are offered for early-stage startups.
Coefficient Comments (0)
Log in to post comments
Log in nowCoefficientWebsite Traffic Analysis
Latest Traffic
Status
Monthly Traffic Trend
Geography
Top 5 Countries/Regions
-
🇺🇸 United States61.27%
-
🇮🇳 India15.99%
-
🇬🇧 United Kingdom7.99%
-
🇮🇩 Indonesia7.86%
-
🇵🇭 Philippines6.89%
Traffic source
| Source Type | Percentage |
|---|---|
|
Direct Access
|
60.65% |
|
Referral
|
37.55% |
|
Email
|
1.80% |
Popular Keywords
| Keyword | Cost Per Click |
|---|---|
|
$3.12
|
|
|
$0.00
|
|
|
$0.00
|
|
|
$0.00
|
|
|
$0.00
|
Coefficient Alternatives
View All
Rows
Rows is a next-generation spreadsheet that combines a familiar interface with powerful AI capabilities and seamless data integration. …
Rows is a next-generation spreadsheet that combines a familiar interface with powerful AI capabilities and seamless data integration. Connect to over 50 sources like Google Analytics, social media, and databases to automate data analysis, create live dashboards, and generate insights with an AI Analyst copilot.

Ajelix
Ajelix is an AI-powered suite of tools designed to enhance productivity for Excel and Google Sheets users. It …
Ajelix is an AI-powered suite of tools designed to enhance productivity for Excel and Google Sheets users. It acts as an AI data analyst, automating tasks, generating formulas and VBA scripts, creating insightful reports, and providing advanced data analysis through a simple chat interface.
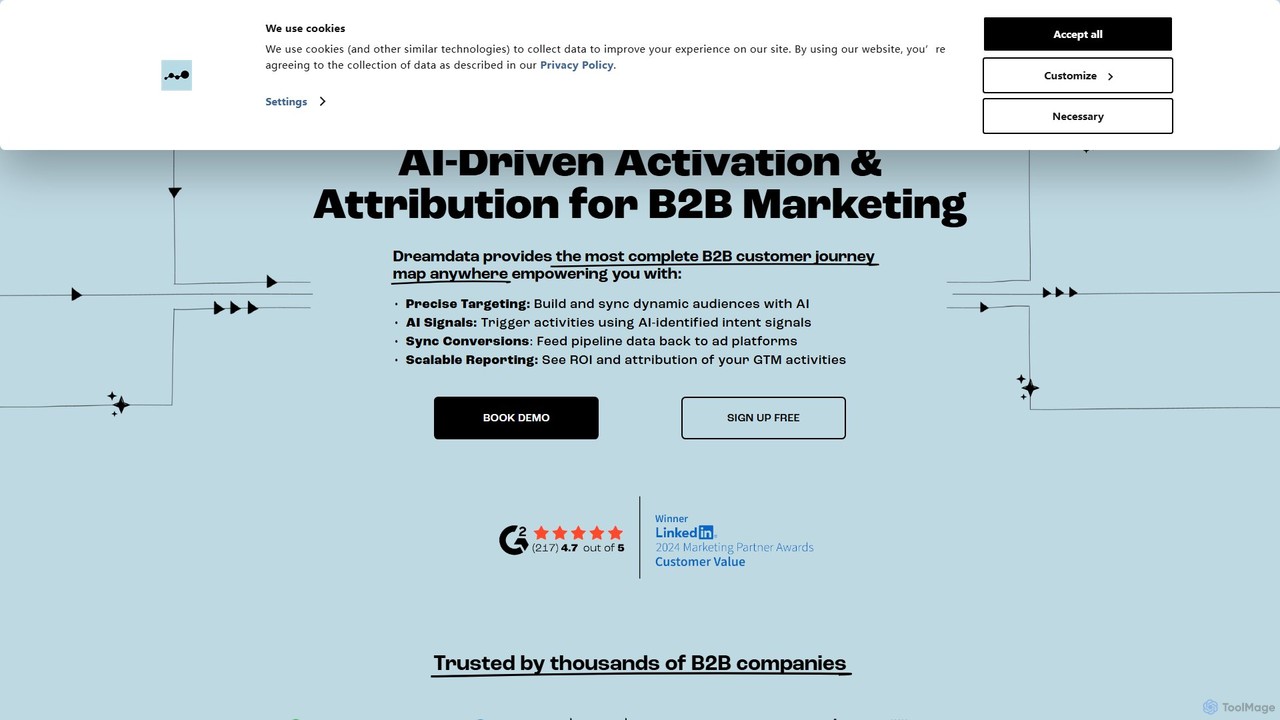
dreamdata
Dreamdata is a B2B revenue attribution and analytics platform that connects marketing and sales data to provide a …
Dreamdata is a B2B revenue attribution and analytics platform that connects marketing and sales data to provide a unified view of the customer journey. It helps businesses understand which activities drive revenue, enabling them to optimize marketing spend, improve ROI, and align their go-to-market teams. By tracking every touchpoint, Dreamdata moves beyond last-click attribution to reveal the true impact of every campaign and channel.
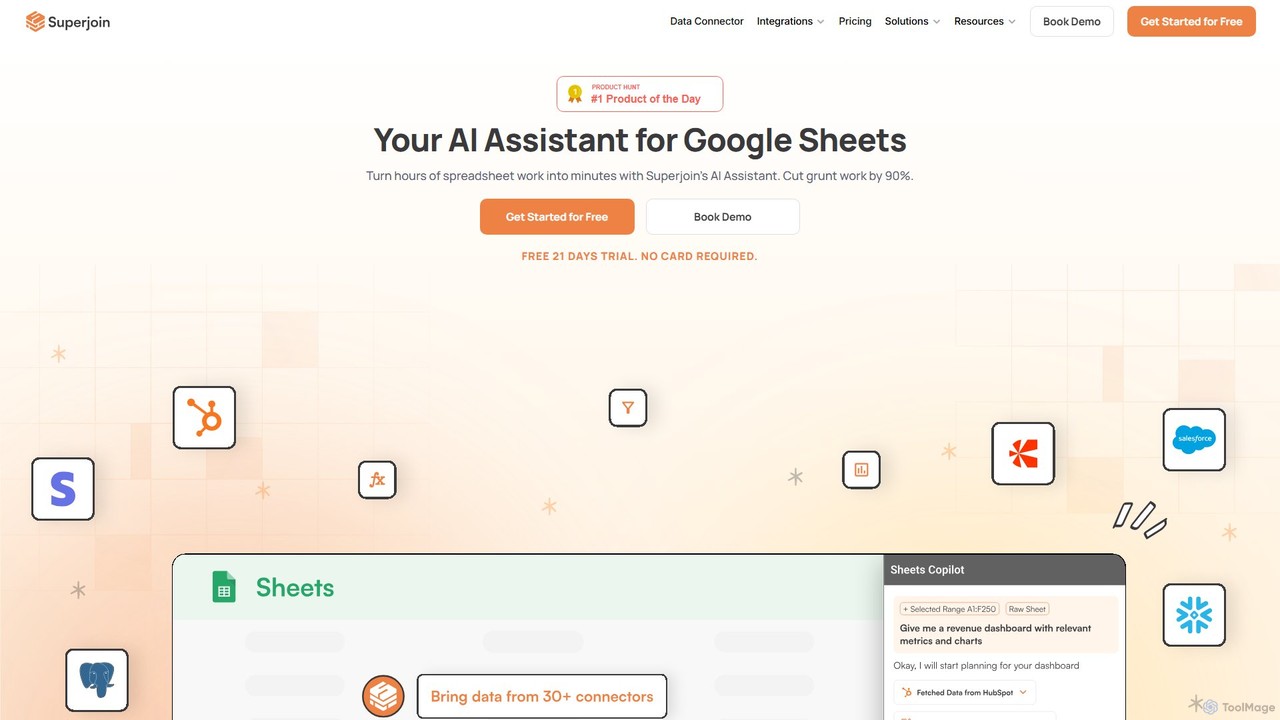
Superjoin
Superjoin is an AI assistant for Google Sheets designed to automate data tasks. It connects to over 30 …
Superjoin is an AI assistant for Google Sheets designed to automate data tasks. It connects to over 30 data sources, allowing for automatic data pulls and refreshes. Users can leverage natural language to clean data, generate charts, create formulas, and build automated workflows, saving up to 90% of manual spreadsheet time.
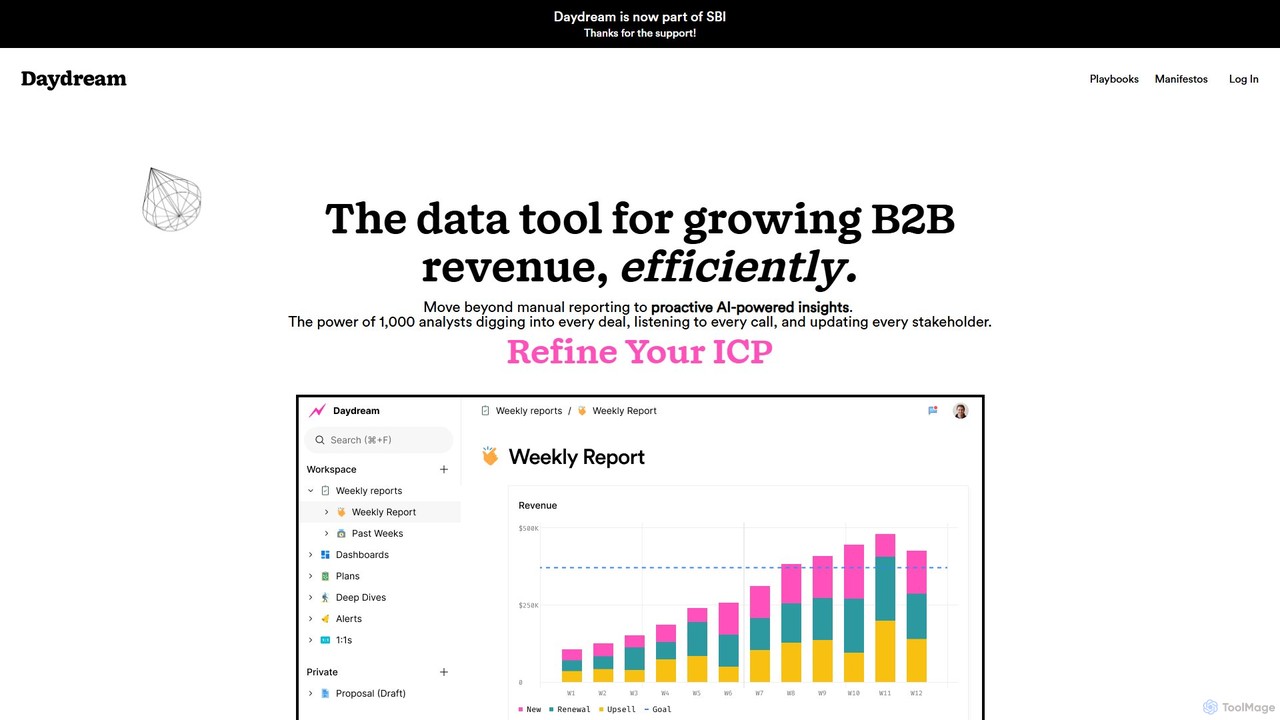
Daydream
Daydream is an AI-powered revenue intelligence platform designed for B2B companies. It unifies data from sales, marketing, and …
Daydream is an AI-powered revenue intelligence platform designed for B2B companies. It unifies data from sales, marketing, and finance to provide proactive insights, automate reporting, and foster cross-functional collaboration. Move beyond manual dashboards to a collaborative workspace that helps teams hit ambitious revenue goals efficiently.

alta
alta is an AI-powered business intelligence platform that transforms complex data into clear, actionable insights. Ask questions in …
alta is an AI-powered business intelligence platform that transforms complex data into clear, actionable insights. Ask questions in natural language, get instant visualizations, and uncover future trends without writing a single line of code. It's data analysis, democratized for your entire team.
Coupler.io
Coupler.io is a no-code data analytics and automation platform that helps businesses connect disparate data sources from marketing, …
Coupler.io is a no-code data analytics and automation platform that helps businesses connect disparate data sources from marketing, sales, and finance apps to spreadsheets, data warehouses, or BI tools. It automates data collection, transforms raw data into analysis-ready formats, and provides AI-powered insights and pre-built dashboard templates for faster, smarter decision-making.

Sheetplus
Sheetplus is an AI-powered toolkit designed to supercharge your spreadsheet experience in Google Sheets and Excel. By leveraging …
Sheetplus is an AI-powered toolkit designed to supercharge your spreadsheet experience in Google Sheets and Excel. By leveraging natural language, it allows users to generate complex formulas, clean and analyze data, automate tasks, and extract insights without writing code. It acts as an intelligent assistant, making data management faster, more intuitive, and accessible to everyone, regardless of their technical expertise.

Formula Bot
Formula Bot is an AI-powered data analysis platform that simplifies working with spreadsheets and data. It allows users …
Formula Bot is an AI-powered data analysis platform that simplifies working with spreadsheets and data. It allows users to generate Excel formulas, SQL queries, and VBA code from simple text instructions, analyze data through a conversational chat interface, and automate tasks like data cleaning and enrichment.
Equals
Equals is a next-generation, all-in-one GTM analytics spreadsheet that connects directly to your live data sources. It empowers …
Equals is a next-generation, all-in-one GTM analytics spreadsheet that connects directly to your live data sources. It empowers RevOps, Finance, and Founders to build dynamic dashboards, analyze sales funnels, and track ARR in a familiar spreadsheet interface, driving revenue growth with real-time insights.
Coefficient Category
Coefficient Tag
Coefficient AI Tool Comparison
Coefficient Embed Feature
Just copy the embed code below and paste this beautiful badge on your blog, article, or official app website to drive traffic directly to this tool's detail page and quickly boost your exposure and user count!

No comments yet, be the first to comment!