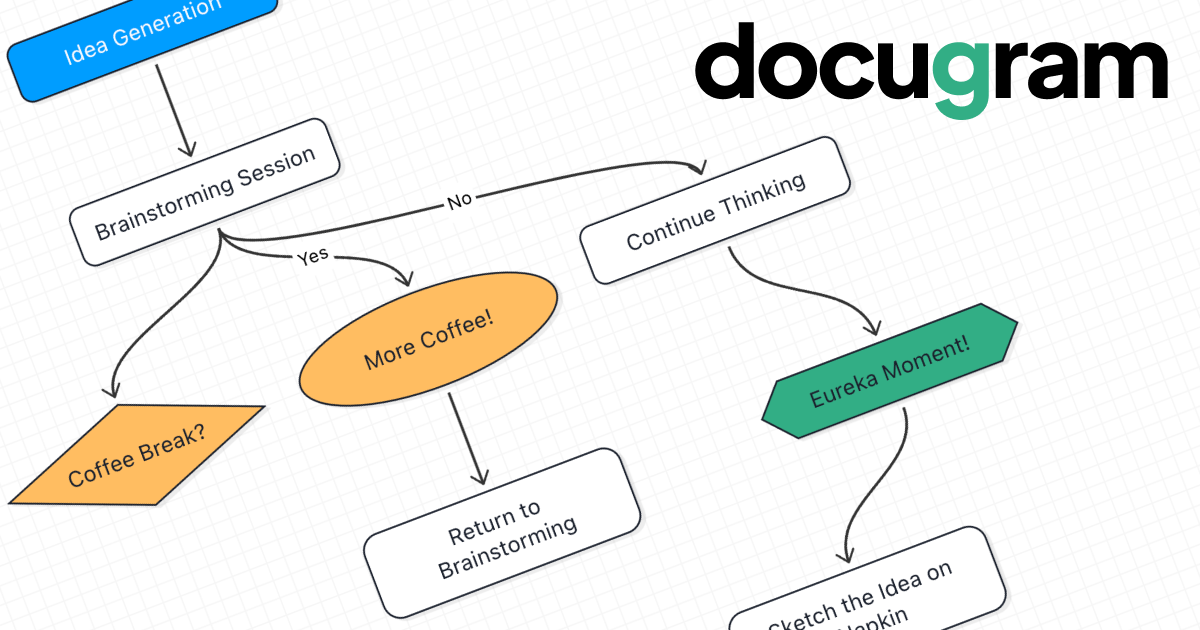
Docugram is an AI-powered tool that instantly transforms text documents, notes, and prompts into clear, editable diagrams and flowcharts. It streamlines workflows by converting complex information from formats like Word, Excel, and PDF into visual maps, enhancing productivity for professionals in project management, development, and business analysis.
workviz.io is an AI-powered workforce analytics and project visualization platform. It transforms complex work data into clear, interactive dashboards, helping teams optimize workflows, monitor project progress, and enhance productivity through intelligent insights and predictive analytics.
Product overview
Docugram Product overview
Docugram is an AI-powered tool that instantly transforms text documents, notes, and prompts into clear, editable diagrams and flowcharts. It streamlines workflows by converting complex information from formats like Word, Excel, and PDF into visual maps, enhancing productivity for professionals in project management, development, and business analysis.
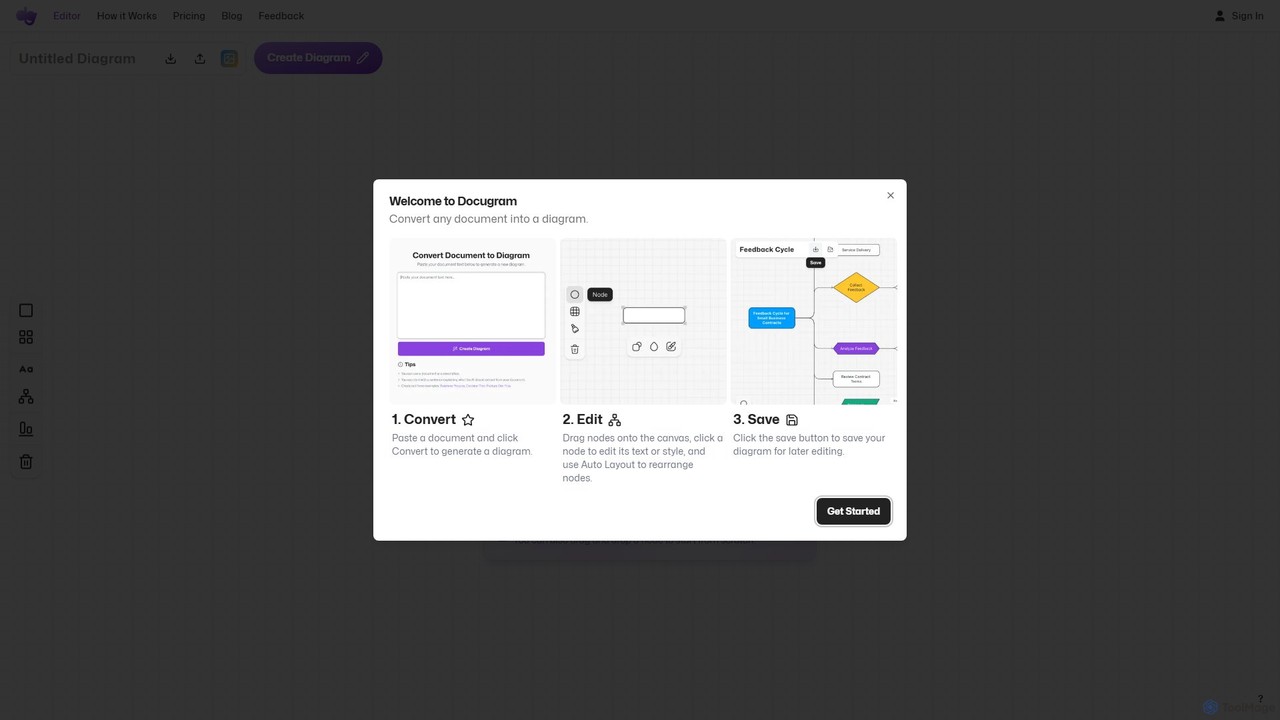
workviz.io Product overview
workviz.io is an AI-powered workforce analytics and project visualization platform. It transforms complex work data into clear, interactive dashboards, helping teams optimize workflows, monitor project progress, and enhance productivity through intelligent insights and predictive analytics.
Detailed feature comparison
| Feature | Docugram | workviz.io |
|---|---|---|
| Primary category | Project Management | Project Management |
| Added | 2025-08-01 | 2025-08-13 |
| Pricing | Freemium | Freemium |
| Official website | docugram.app | ww25.workviz.io |
| Product type | Website | Website |
| Performance data | ||
| User rating | Not verified | Not verified |
| Comments | 0 | 0 |
| Monthly visits | 3K | 4.2K |
| Monthly growth | 50.6% | Not verified |
| Favorites | 113 | 128 |
| Details | View details | View details |
Docugram vs workviz.io monthly traffic
Compare Docugram and workviz.io by monthly reach, traffic trend, visit depth, top regions, and acquisition sources.
How to interpret the traffic data
In the Docugram vs workviz.io monthly traffic comparison, Docugram currently shows 3K visits and workviz.io shows 4.2K; workviz.io has about 1.4 times the visible traffic of Docugram, an absolute difference of about 1.2K visits. This reflects visible reach, not feature quality or paid users.
Only Docugram has complete third-party traffic details; workviz.io uses visits recorded inside ToolMage. These scopes cannot estimate market share directly, and on-site views should not be treated as the product’s total website traffic.
Docugram monthly traffic:
Latest traffic
Monthly traffic trend
- 2025/9: 3.7K Monthly visits
- 2026/1: 2.3K Monthly visits
- 2026/2: 2.9K Monthly visits
- 2026/3: 3K Monthly visits
- 2026/4: 2K Monthly visits
- 2026/5: 3K Monthly visits
Top regions
Top 5 countries/regions
| Country/region | Percentage | Traffic |
|---|---|---|
| 🇺🇸United States | 59.42% | 1.8K |
| 🇷🇺Russia | 40.58% | 1.2K |
Search keywords
workviz.io monthly traffic:
Latest traffic
Usage comparison
Compare the core capabilities of Docugram and workviz.io
Docugram Core features
workviz.io Core features
Use cases
Docugram Use cases
workviz.io Use cases
Docugram vs workviz.io:In-depth comparison and selection guidance
First decide whether the products solve the same kind of need
This in-depth Docugram vs workviz.io comparison uses only the product records, taxonomy, audience, traffic, and community signals available on this page. Docugram is primarily listed under “Project Management”, while workviz.io is primarily listed under “Project Management”, so the first decision is whether your actual task matches their recorded scope.
The structured fields currently show these decision-relevant differences: Monthly visits (Docugram: 3K; workviz.io: 4.2K); Favorites (Docugram: 113; workviz.io: 128); Website (Docugram: docugram.app; workviz.io: ww25.workviz.io); Added (Docugram: 2025-08-01; workviz.io: 2025-08-13). These facts are more useful for selection than brand visibility alone.
What market visibility and monthly traffic mean
In the Docugram vs workviz.io monthly traffic comparison, Docugram currently shows 3K visits and workviz.io shows 4.2K; workviz.io has about 1.4 times the visible traffic of Docugram, an absolute difference of about 1.2K visits. This reflects visible reach, not feature quality or paid users.
Only Docugram has complete third-party traffic details; workviz.io uses visits recorded inside ToolMage. These scopes cannot estimate market share directly, and on-site views should not be treated as the product’s total website traffic.
The current traffic scope is not sufficient for a reliable product ranking. Treat monthly visits as a market-interest signal, then decide using taxonomy, use cases, pricing, and a like-for-like trial rather than reading exposure as product capability.
Product positioning, use cases, and roles
Docugram and workviz.io currently overlap in shared categories: Project Management and Visualization; shared tags: data visualization and project management. This can place both on the same shortlist, but it does not prove equal implementation, depth, or cost.
Docugram's unique categories/tags are Diagramming, Workflow Automation, AI diagram, business process, diagram generator, flowchart maker, mind map, and process mapping; workviz.io's are Analytics, business intelligence, dashboard, predictive analytics, productivity, reporting, workflow optimization, and workforce analytics. These unique fields are the strongest differentiators: validate the product whose recorded scope matches the task instead of following traffic alone.
What ratings, comments, and favorites can tell you
Docugram has no verified rating, 0 comments, 113 favorites, and 112 likes;workviz.io has no verified rating, 0 comments, 128 favorites, and 111 likes。
Neither product has enough rating or comment samples for a credible reputation ranking.
Selection guidance by actual need
When to evaluate Docugram first
Put Docugram on the priority trial list when the task aligns with “Project Management” and especially Diagramming, Workflow Automation, AI diagram, business process, diagram generator, and flowchart maker. This follows recorded positioning and does not imply unlisted capabilities are absent.
Docugram also currently records: pricing is freemium, product type is website, 3K verified monthly visits, no verified user rating. Verify any hard requirement around price, platform, or reach before trial, and do not let sparse review data substitute for testing.
When to evaluate workviz.io first
Put workviz.io on the priority trial list when the task aligns with “Project Management” and especially Analytics, business intelligence, dashboard, predictive analytics, productivity, and reporting. This follows recorded positioning and does not imply unlisted capabilities are absent.
workviz.io also currently records: pricing is freemium, product type is website, 4.2K on-site monthly views, no verified user rating. Verify any hard requirement around price, platform, or reach before trial, and do not let sparse review data substitute for testing.
How to validate the recommendation before deciding
The available data describes positioning, public visibility, and community signals, but it cannot prove output quality, speed, integration effort, privacy, or long-term cost in your workflow. Before deciding, run the same representative tasks in Docugram and workviz.io, then record completion time, accuracy, manual corrections, and the real paid threshold. A like-for-like trial turns this comparison into a defensible adoption decision.
Comparison FAQ
How should I choose between Docugram and workviz.io?
Where does this comparison data come from?
What do unknown fields mean?
Related AI tools

Diagramming AI
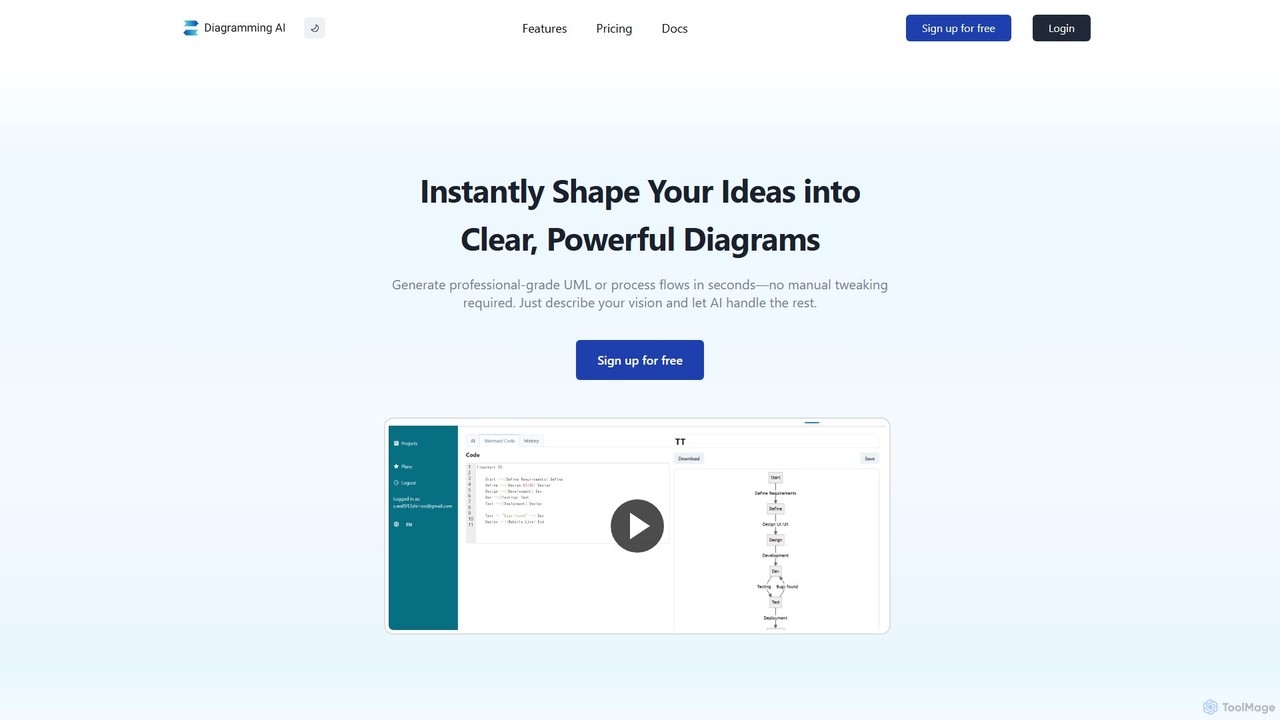
Diagramming AI is an advanced AI-powered platform that instantly generates and edits a wide range of diagrams from text, URLs, or images. It supports popular formats like Mermaid, PlantUML, and Graphviz, and features an intuitive AI chat for real-time modifications and a visual editor integration with Excalidraw for precise adjustments.
Visualization
Lucidchart
Lucidchart is an intelligent diagramming and visual collaboration platform that uses AI, data automation, and real-time teamwork to help users visualize complex systems, processes, and ideas. It enables teams to create professional flowcharts, org charts, network diagrams, and more, fostering clarity and driving innovation.
Project Management
EdrawMax
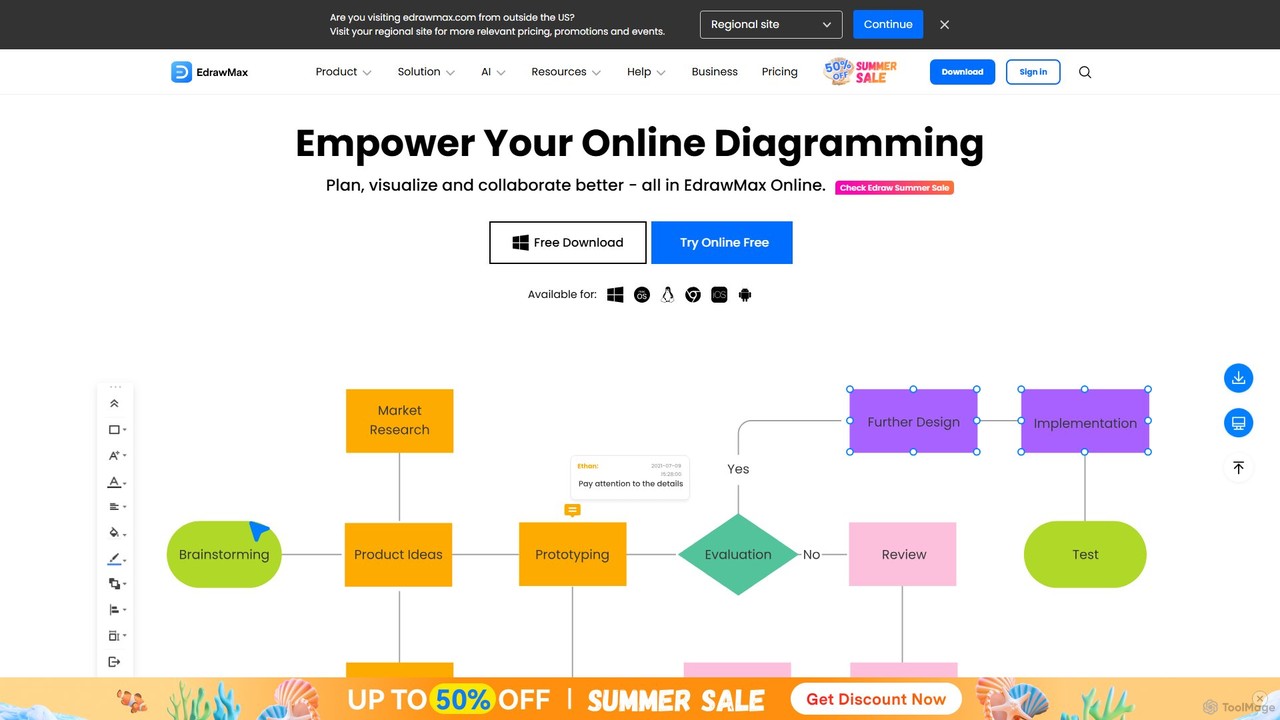
EdrawMax is an all-in-one, AI-powered diagramming tool for creating over 210 types of diagrams, from flowcharts to floor plans. It combines intuitive drag-and-drop functionality with advanced AI features like one-click diagram generation, content analysis, and OCR. Ideal for teams and individuals, it facilitates real-time collaboration, offers extensive templates, and serves as a powerful Visio alternative for visualizing ideas and workflows.
Project Management
aiflowchart
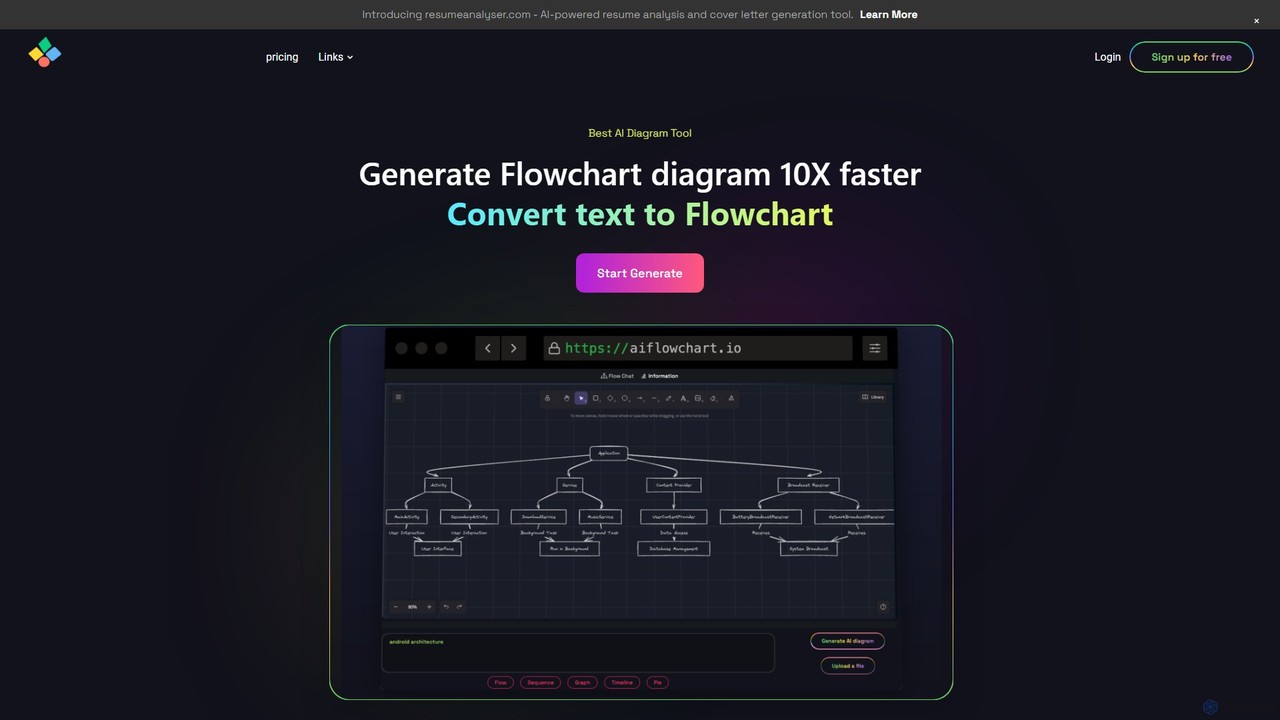
An AI-powered diagramming tool that automatically generates flowcharts, sequence diagrams, pie charts, and more from text, PDFs, or blog content. It leverages models like GPT-4o to create unique, customizable diagrams with explanations, saving users significant time and effort.
Visualization
Othor AI
Othor AI is a no-code business intelligence platform that transforms your data into actionable insights in seconds. It automatically generates narrative-driven reports, smart charts, and predictive analytics, enabling anyone in your organization to make faster, data-driven decisions without technical expertise. Connect your data sources and get instant dashboards and executive summaries.
Business Intelligence
MindmapAI
MindmapAI is an advanced AI-powered platform that transforms ideas, PDFs, YouTube videos, and web URLs into structured, visual mind maps. It automates information analysis and organization, enabling users to quickly grasp complex topics, brainstorm effectively, and collaborate with teams in real-time. Ideal for students, professionals, and creators looking to enhance productivity and clarity.
Project Management
EzInsights
EzInsights is an AI-powered business intelligence platform that enables users to interact with their data using natural language. It combines generative AI with advanced analytics and visualization tools to provide instant, data-driven insights, automated reports, and predictive analytics, empowering teams to make smarter decisions without technical expertise.
Data
alltum.io
alltum.io is an AI-powered business intelligence platform that unifies data from various sources, providing actionable insights through interactive dashboards, predictive analytics, and automated reporting. It empowers businesses of all sizes to make smarter, data-driven decisions effortlessly.
Business Intelligence
Airtable
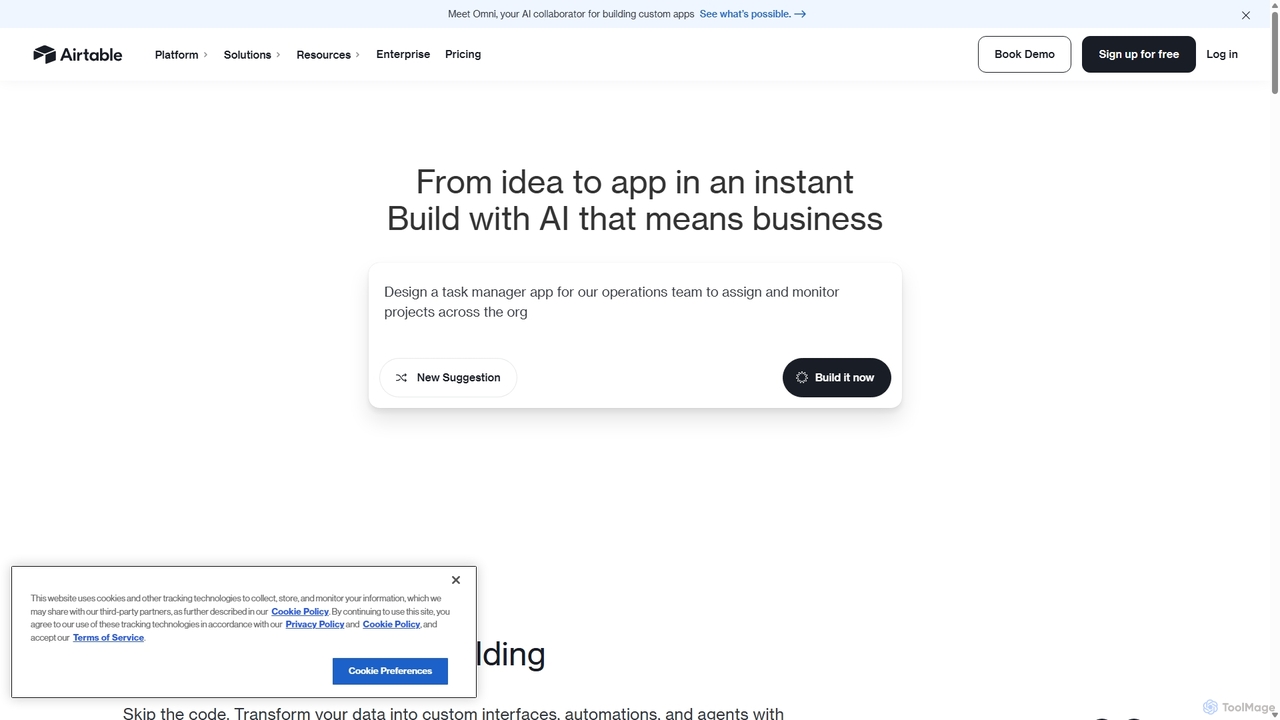
Airtable is an AI-native app building platform for enterprises, combining the flexibility of a spreadsheet with the power of a database. It enables teams to create custom applications, automate complex workflows, and deploy intelligent AI agents without writing code, transforming critical data into actionable insights and streamlined operations.
Project Management
Edrawsoft
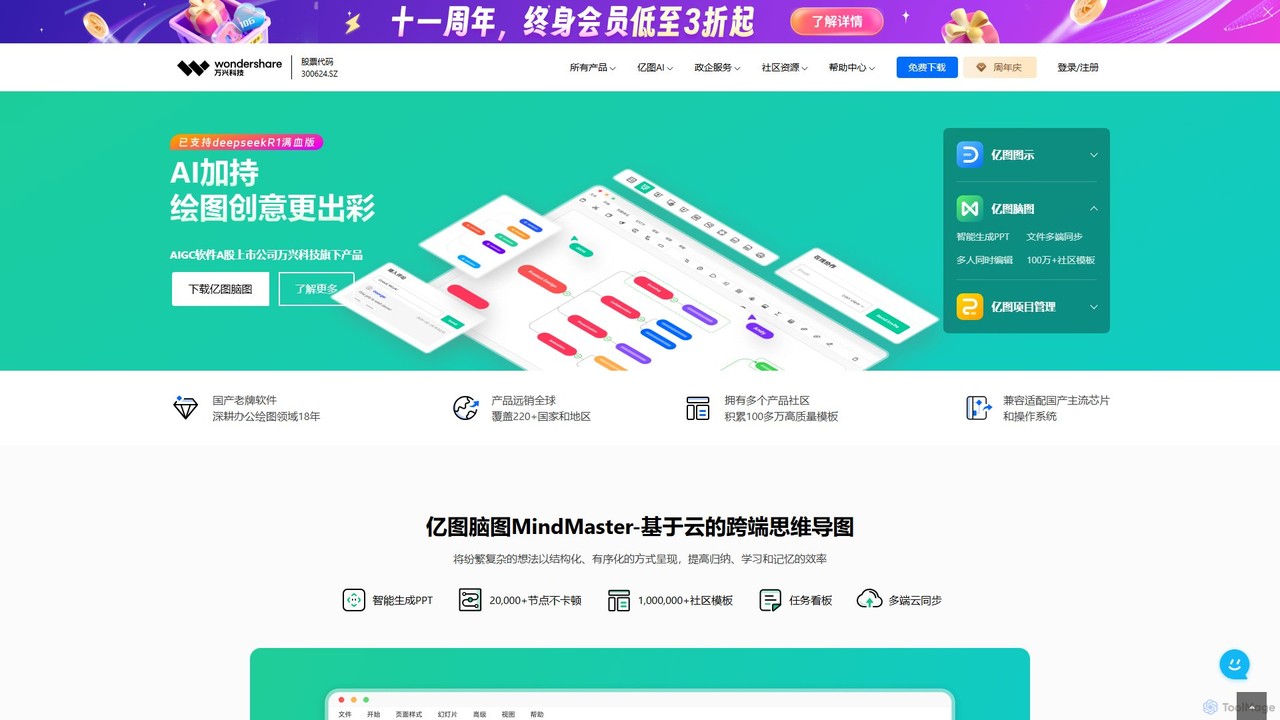
Edrawsoft is a comprehensive suite of AI-powered visual tools for diagramming, mind mapping, and project management. It includes EdrawMax for all-in-one diagram creation, EdrawMind for brainstorming, and EdrawProj for Gantt charts. With AI assistance, users can automatically generate flowcharts, org charts, and more from text, beautify designs with a single click, and collaborate seamlessly across platforms. It's a powerful Visio alternative for individuals, teams, and enterprises.
Project Management
thebricks
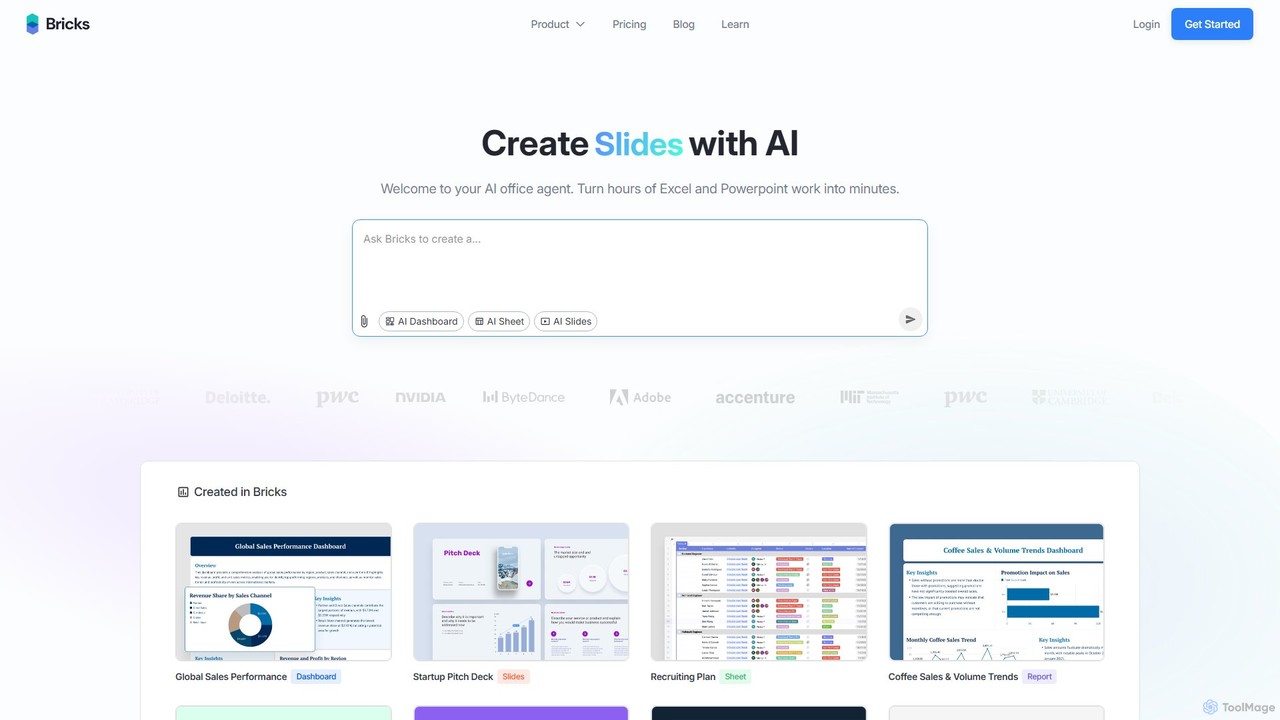
thebricks is an AI-powered workspace that transforms data analysis and reporting. It allows users to create interactive dashboards, dynamic spreadsheets, and professional slides using simple natural language prompts. Turn hours of manual work in Excel and PowerPoint into minutes, streamlining your workflow and boosting productivity.
Business Intelligence
Crackerjack
Crackerjack is an AI-powered business intelligence and data analytics platform. It automates the process of uncovering insights from complex data, generating expert-level reports, and providing predictive analytics to accelerate strategic decision-making for businesses of all sizes.
Business Intelligence
Tabidoo
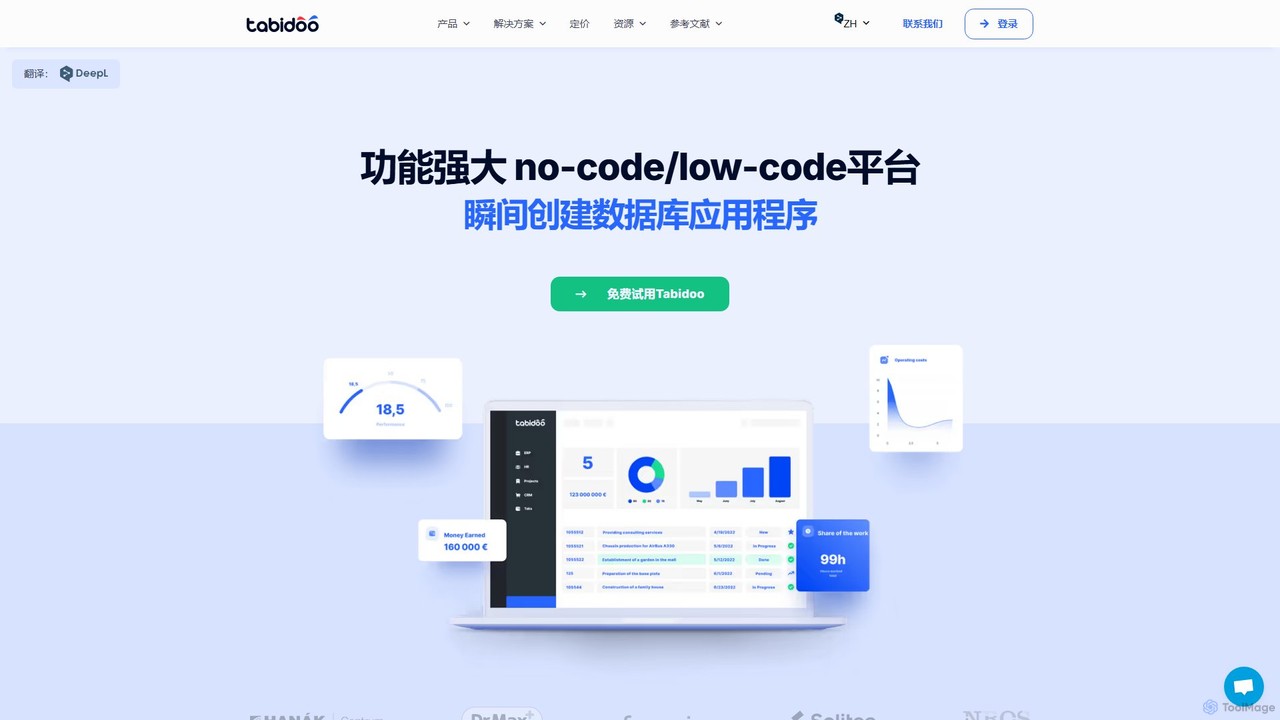
Tabidoo is a powerful low-code/no-code platform that allows you to build custom business applications and databases without programming. Easily manage data, automate workflows, and create solutions for CRM, project management, HR, and more. It's a flexible, scalable, and user-friendly alternative to complex software and scattered spreadsheets.
Crm
BoostKPI
BoostKPI is a privacy-first AI data analyst platform, powered by its AI assistant, ADA. It automates anomaly detection, root cause analysis, and data visualization, enabling businesses to quickly uncover actionable insights from their data. By connecting to various data warehouses or accepting file uploads, BoostKPI transforms complex datasets into clear reports, heatmaps, and drill-down analyses, making data-driven decision-making faster and more accessible for teams of all sizes.
Business Intelligence
prisms.ai
Prisms.ai is an AI-powered data analytics and visualization platform that transforms complex data into clear, interactive dashboards. It allows users to ask questions in natural language and receive instant, AI-generated insights, charts, and reports, making data-driven decision-making accessible to everyone in an organization.
Business Intelligence