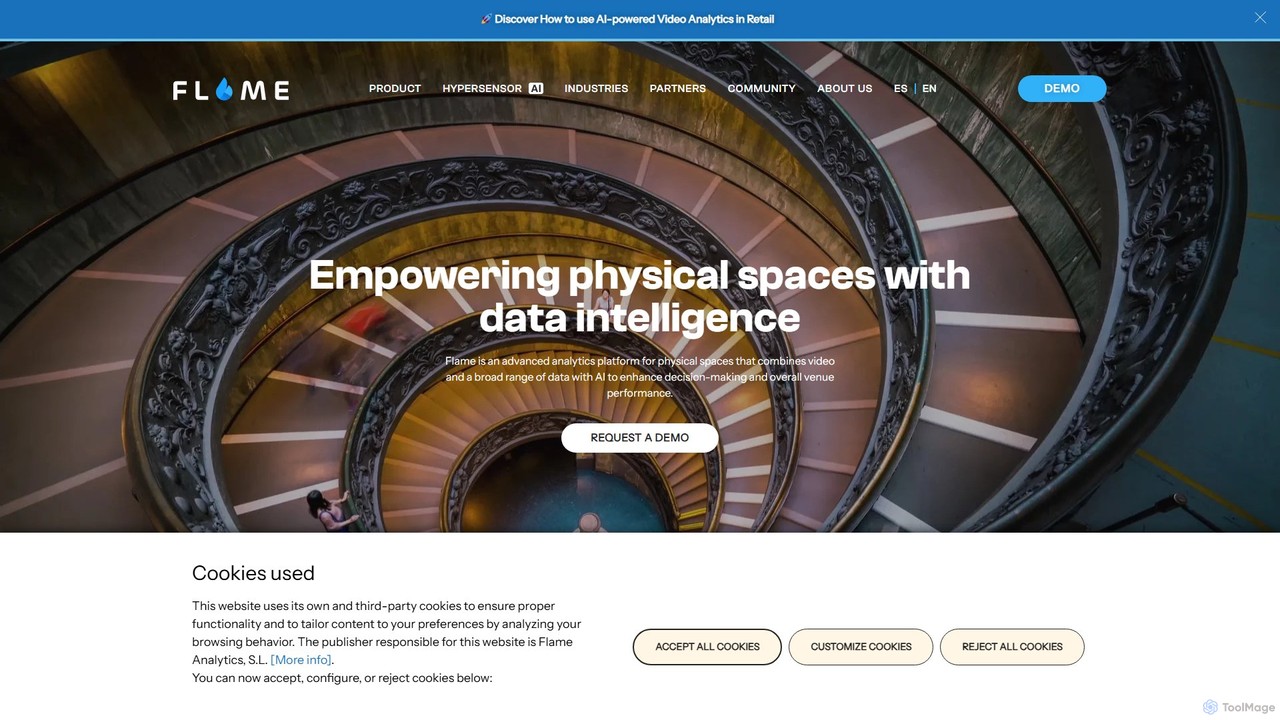
flameanalytics is an advanced AI-powered analytics platform for physical spaces. It integrates data from CCTV, WiFi, and other sensors to provide deep insights into customer behavior, traffic patterns, and venue performance. Businesses like retail stores, shopping malls, and hotels use it to optimize operations, enhance customer experience, and increase loyalty through data-driven decisions.

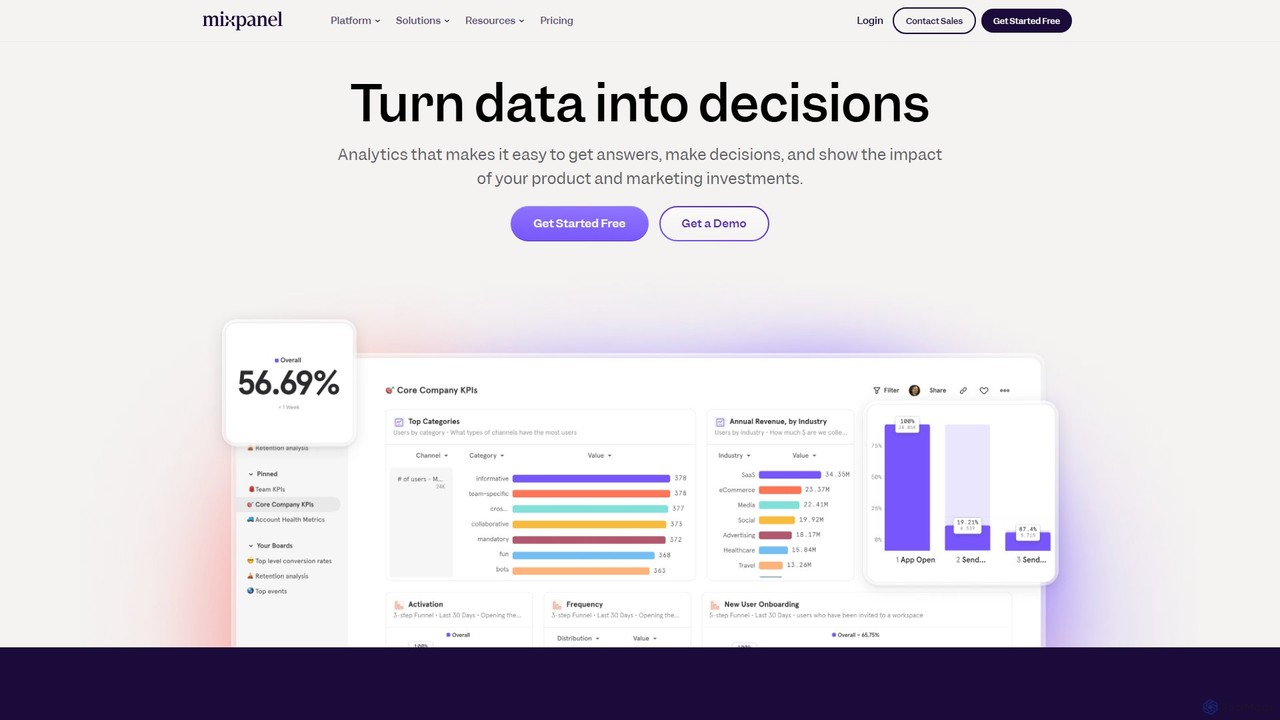
Mixpanel is a powerful product analytics platform that helps businesses understand user behavior, measure key metrics, and make data-driven decisions. It offers self-serve analytics, session replays, and data integrations to empower teams across product, marketing, and engineering to drive growth and retention.
Product overview
flameanalytics Product overview
flameanalytics is an advanced AI-powered analytics platform for physical spaces. It integrates data from CCTV, WiFi, and other sensors to provide deep insights into customer behavior, traffic patterns, and venue performance. Businesses like retail stores, shopping malls, and hotels use it to optimize operations, enhance customer experience, and increase loyalty through data-driven decisions.
Mixpanel Product overview
Mixpanel is a powerful product analytics platform that helps businesses understand user behavior, measure key metrics, and make data-driven decisions. It offers self-serve analytics, session replays, and data integrations to empower teams across product, marketing, and engineering to drive growth and retention.
Detailed feature comparison
| Feature | flameanalytics | Mixpanel |
|---|---|---|
| Primary category | Analytics | Analytics |
| Added | 2025-08-06 | 2025-08-12 |
| Pricing | Paid | Freemium |
| Official website | flameanalytics.com | mixpanel.com |
| Product type | Website | Website |
| Performance data | ||
| User rating | Not verified | Not verified |
| Comments | 0 | 0 |
| Monthly visits | 36.2K | 1.5M |
| Monthly growth | 15.1% | -2.8% |
| Favorites | 102 | 124 |
| Details | View details | View details |
flameanalytics vs Mixpanel monthly traffic
Compare flameanalytics and Mixpanel by monthly reach, traffic trend, visit depth, top regions, and acquisition sources.
How to interpret the traffic data
In the flameanalytics vs Mixpanel monthly traffic comparison, flameanalytics currently shows 36.2K visits and Mixpanel shows 1.5M; Mixpanel has about 41.8 times the visible traffic of flameanalytics, an absolute difference of about 1.5M visits. This reflects visible reach, not feature quality or paid users.
Both tools provide verified traffic details, so monthly trends, visit depth, regions, and acquisition sources can be compared on the same basis.
flameanalytics is registered at the flameanalytics.com/en subpage. Because the current data does not state whether other host pages are excluded, treat this as domain-level context rather than independent traffic for one product or project.
flameanalytics monthly traffic:
Latest traffic
Monthly traffic trend
- 2026/1: 35.7K Monthly visits
- 2026/2: 38K Monthly visits
- 2026/3: 44.7K Monthly visits
- 2026/4: 31.4K Monthly visits
- 2026/5: 36.2K Monthly visits
Top regions
Top 5 countries/regions
| Country/region | Percentage | Traffic |
|---|---|---|
| 🇪🇸Spain | 90.62% | 32.8K |
| 🇺🇸United States | 3.3% | 1.2K |
| 🇬🇧United Kingdom | 2.53% | 915 |
| 🇮🇳India | 2.45% | 886 |
| 🇦🇪United Arab Emirates | 1.1% | 398 |
Traffic sources
| Source type | Percentage | Traffic |
|---|---|---|
| Referral | 78.25% | 28.3K |
| 11.48% | 4.2K | |
| Direct | 10.27% | 3.7K |
Search keywords
Mixpanel monthly traffic:
Latest traffic
Monthly traffic trend
- 2025/9: 1.6M Monthly visits
- 2026/1: 1.5M Monthly visits
- 2026/2: 1.4M Monthly visits
- 2026/3: 1.5M Monthly visits
- 2026/4: 1.6M Monthly visits
- 2026/5: 1.5M Monthly visits
Top regions
Top 5 countries/regions
| Country/region | Percentage | Traffic |
|---|---|---|
| 🇺🇸United States | 40.23% | 607.7K |
| 🇮🇳India | 37.49% | 566.4K |
| 🇬🇧United Kingdom | 10.19% | 153.9K |
| 🇵🇱Poland | 6.42% | 97K |
| 🇮🇱Israel | 5.67% | 85.7K |
Traffic sources
| Source type | Percentage | Traffic |
|---|---|---|
| Direct | 94.56% | 1.4M |
| 2.76% | 41.7K | |
| Referral | 2.68% | 40.5K |
Search keywords
Usage comparison
Compare the core capabilities of flameanalytics and Mixpanel
flameanalytics Core features
Mixpanel Core features
Use cases
flameanalytics Use cases
Mixpanel Use cases
flameanalytics vs Mixpanel:In-depth comparison and selection guidance
First decide whether the products solve the same kind of need
This in-depth flameanalytics vs Mixpanel comparison uses only the product records, taxonomy, audience, traffic, and community signals available on this page. flameanalytics is primarily listed under “Analytics”, while Mixpanel is primarily listed under “Analytics”, so the first decision is whether your actual task matches their recorded scope.
The structured fields currently show these decision-relevant differences: Pricing (flameanalytics: Paid; Mixpanel: Freemium); Monthly visits (flameanalytics: 36.2K; Mixpanel: 1.5M); Monthly growth (flameanalytics: 15.1%; Mixpanel: -2.8%); Favorites (flameanalytics: 102; Mixpanel: 124); Website (flameanalytics: flameanalytics.com; Mixpanel: mixpanel.com). These facts are more useful for selection than brand visibility alone.
What market visibility and monthly traffic mean
In the flameanalytics vs Mixpanel monthly traffic comparison, flameanalytics currently shows 36.2K visits and Mixpanel shows 1.5M; Mixpanel has about 41.8 times the visible traffic of flameanalytics, an absolute difference of about 1.5M visits. This reflects visible reach, not feature quality or paid users.
Both tools provide verified traffic details, so monthly trends, visit depth, regions, and acquisition sources can be compared on the same basis.
flameanalytics is registered at the flameanalytics.com/en subpage. Because the current data does not state whether other host pages are excluded, treat this as domain-level context rather than independent traffic for one product or project.
If public market visibility is an important first-pass criterion, investigate Mixpanel first. The final choice should still follow taxonomy, use case, and a real trial because higher traffic does not prove broader capabilities or better workflow fit.
Product positioning, use cases, and roles
flameanalytics and Mixpanel currently overlap in shared categories: Analytics and Customer Behavior; shared tags: business intelligence. This can place both on the same shortlist, but it does not prove equal implementation, depth, or cost.
flameanalytics's unique categories/tags are In Store Analytics, customer behavior, footfall analysis, guest wifi, marketing automation, physical spaces, retail analytics, and shopping mall analytics; Mixpanel's are Data Management, A/B testing, data analysis, data warehouse, marketing analytics, product analytics, session replay, and user behavior. These unique fields are the strongest differentiators: validate the product whose recorded scope matches the task instead of following traffic alone.
What ratings, comments, and favorites can tell you
flameanalytics has no verified rating, 0 comments, 102 favorites, and 114 likes;Mixpanel has no verified rating, 0 comments, 124 favorites, and 115 likes。
Neither product has enough rating or comment samples for a credible reputation ranking.
Selection guidance by actual need
When to evaluate flameanalytics first
Put flameanalytics on the priority trial list when the task aligns with “Analytics” and especially In Store Analytics, customer behavior, footfall analysis, guest wifi, marketing automation, and physical spaces. This follows recorded positioning and does not imply unlisted capabilities are absent.
flameanalytics also currently records: pricing is paid, product type is website, 36.2K monthly visits shown for the registered host (subpage scope unknown), no verified user rating. Verify any hard requirement around price, platform, or reach before trial, and do not let sparse review data substitute for testing.
When to evaluate Mixpanel first
Put Mixpanel on the priority trial list when the task aligns with “Analytics” and especially Data Management, A/B testing, data analysis, data warehouse, marketing analytics, and product analytics. This follows recorded positioning and does not imply unlisted capabilities are absent.
Mixpanel also currently records: pricing is freemium, product type is website, 1.5M verified monthly visits, no verified user rating. Verify any hard requirement around price, platform, or reach before trial, and do not let sparse review data substitute for testing.
How to validate the recommendation before deciding
The available data describes positioning, public visibility, and community signals, but it cannot prove output quality, speed, integration effort, privacy, or long-term cost in your workflow. Before deciding, run the same representative tasks in flameanalytics and Mixpanel, then record completion time, accuracy, manual corrections, and the real paid threshold. A like-for-like trial turns this comparison into a defensible adoption decision.
Comparison FAQ
How should I choose between flameanalytics and Mixpanel?
Where does this comparison data come from?
What do unknown fields mean?
Related AI tools

Amplitude
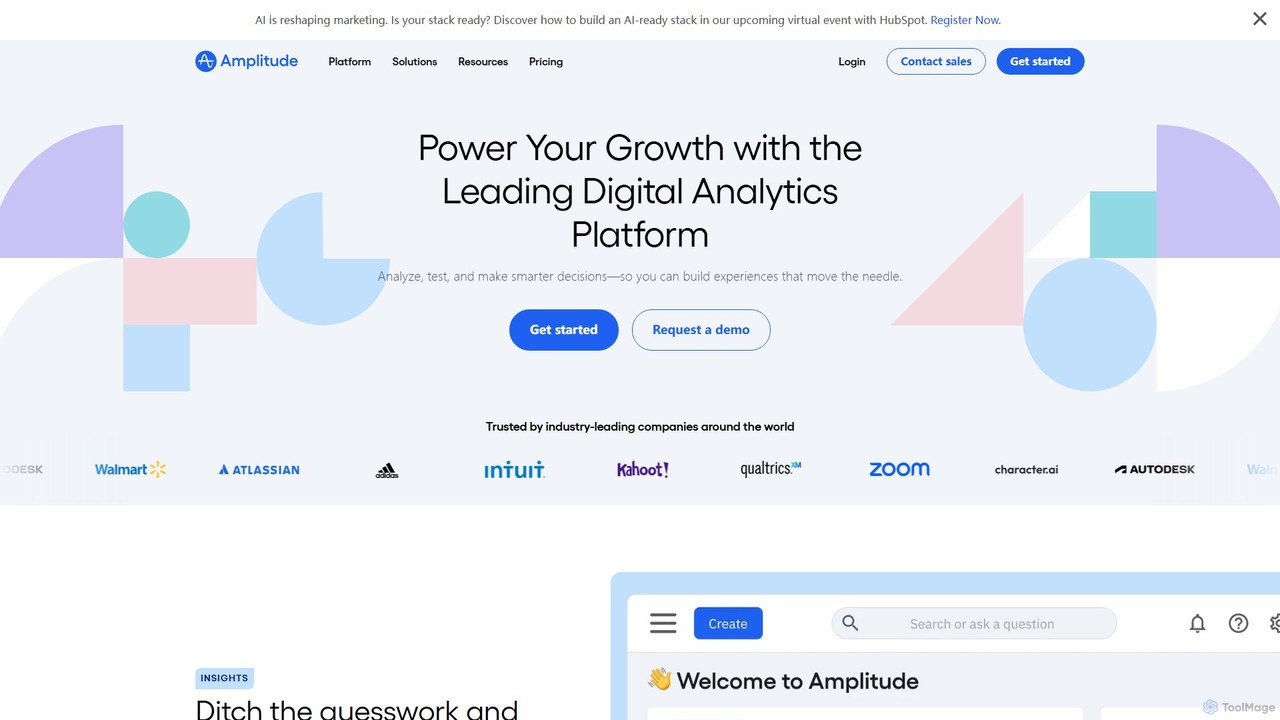
Amplitude is a leading digital analytics platform that uses AI to help businesses understand user behavior, optimize products, and drive growth. It provides a unified solution for product analytics, session replay, A/B testing, and feature management, enabling teams to make data-driven decisions and build better customer experiences.
Analytics
Percept Insight
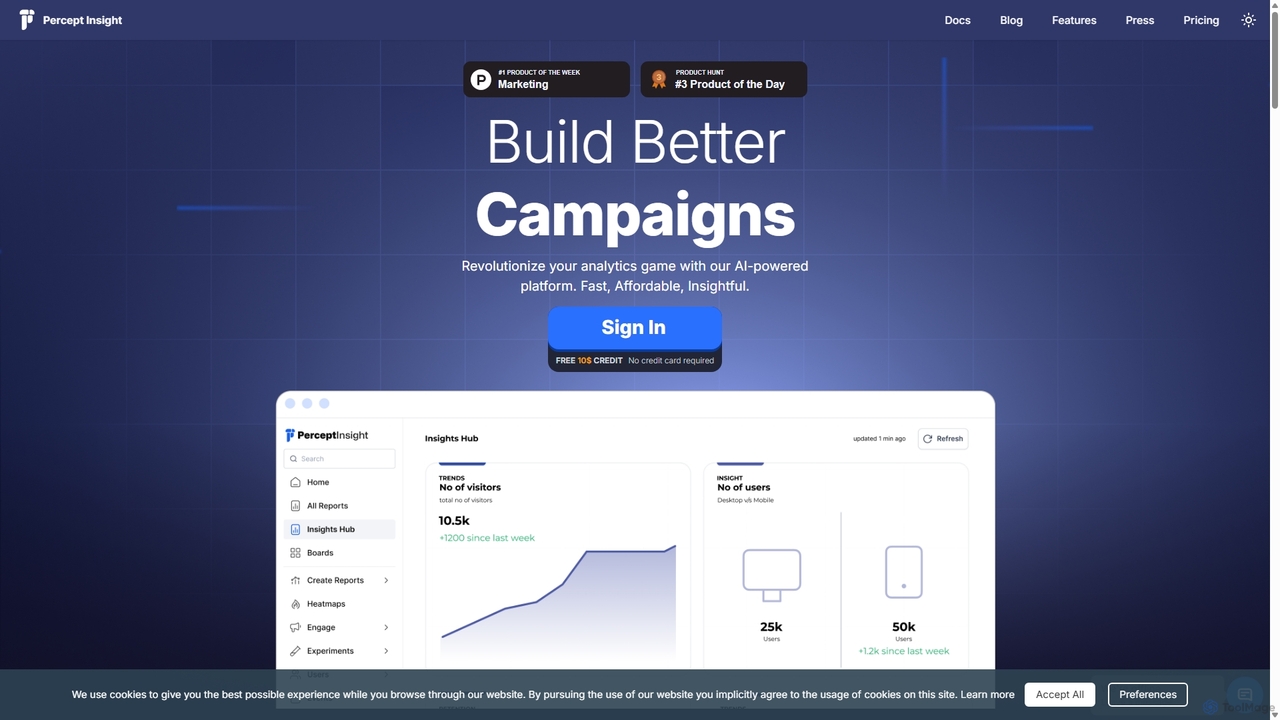
Percept Insight is an AI-powered, all-in-one analytics and engagement platform for product managers and marketers. It provides deep, real-time insights into user behavior, funnels, and cohorts, enabling data-driven decisions. The platform combines powerful analytics with multi-channel engagement tools (WhatsApp, SMS, email) to improve user retention and conversions, all with a cost-effective, pay-as-you-use pricing model.
Business Intelligence
Houseware
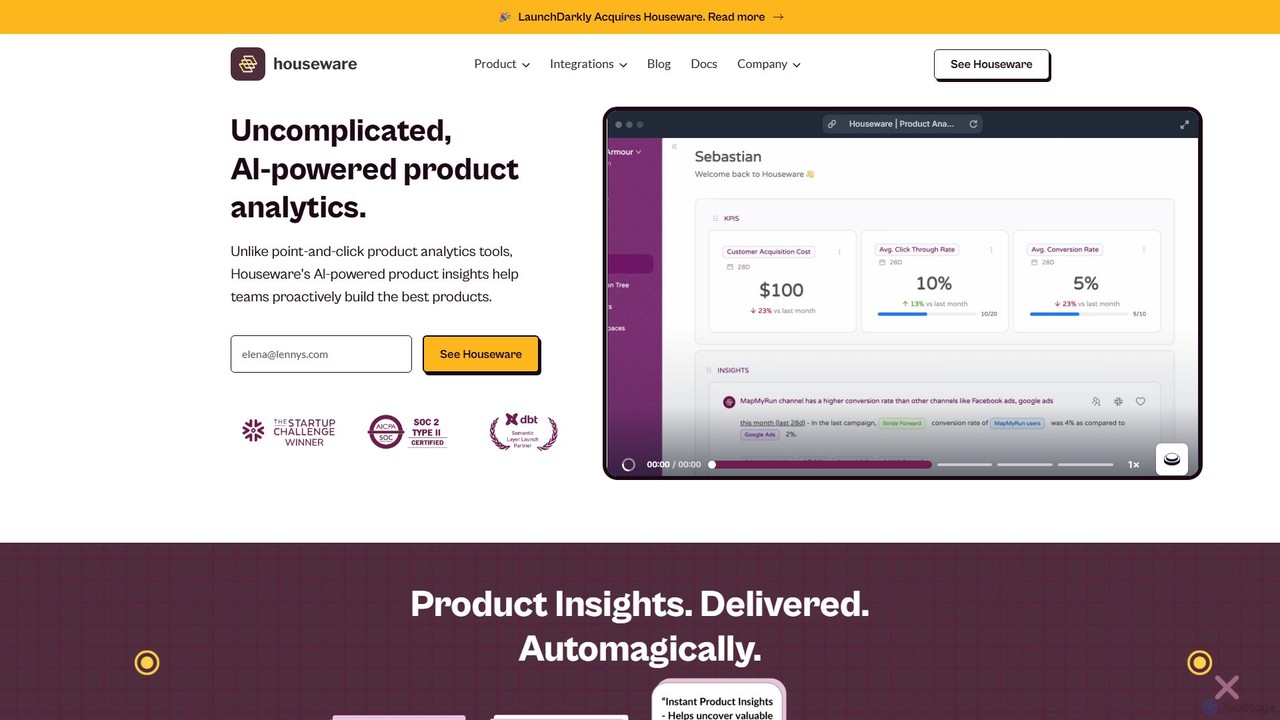
Houseware is an AI-powered, warehouse-native product analytics platform, now part of LaunchDarkly. It connects directly to your data warehouse to provide deep, proactive insights into user behavior. Featuring an AI Copilot, it helps product teams save time, perform complex funnel analysis, and make data-driven decisions without data silos.
Analytics
Analyzr
Analyzr is a no-code predictive analytics platform that empowers businesses to build custom machine learning models. It simplifies data analysis, enabling users to uncover insights for customer clustering, propensity scoring, and forecasting without requiring engineering expertise.
Predictive Analytics
Falcon
Falcon is an AI-powered business intelligence platform designed for e-commerce and retail. It analyzes sales, customer, and inventory data to provide predictive insights, automate marketing, and optimize operations, helping businesses increase profitability and efficiency.
Analytics
Krizmi
Krizmi is an AI-powered business solutions platform designed to enhance productivity and drive growth. It offers a suite of tools for content creation, marketing automation, data analysis, and workflow optimization. By leveraging advanced AI, Krizmi helps businesses streamline operations, make smarter decisions, and stay competitive in a rapidly evolving market.
Analytics
Julius AI
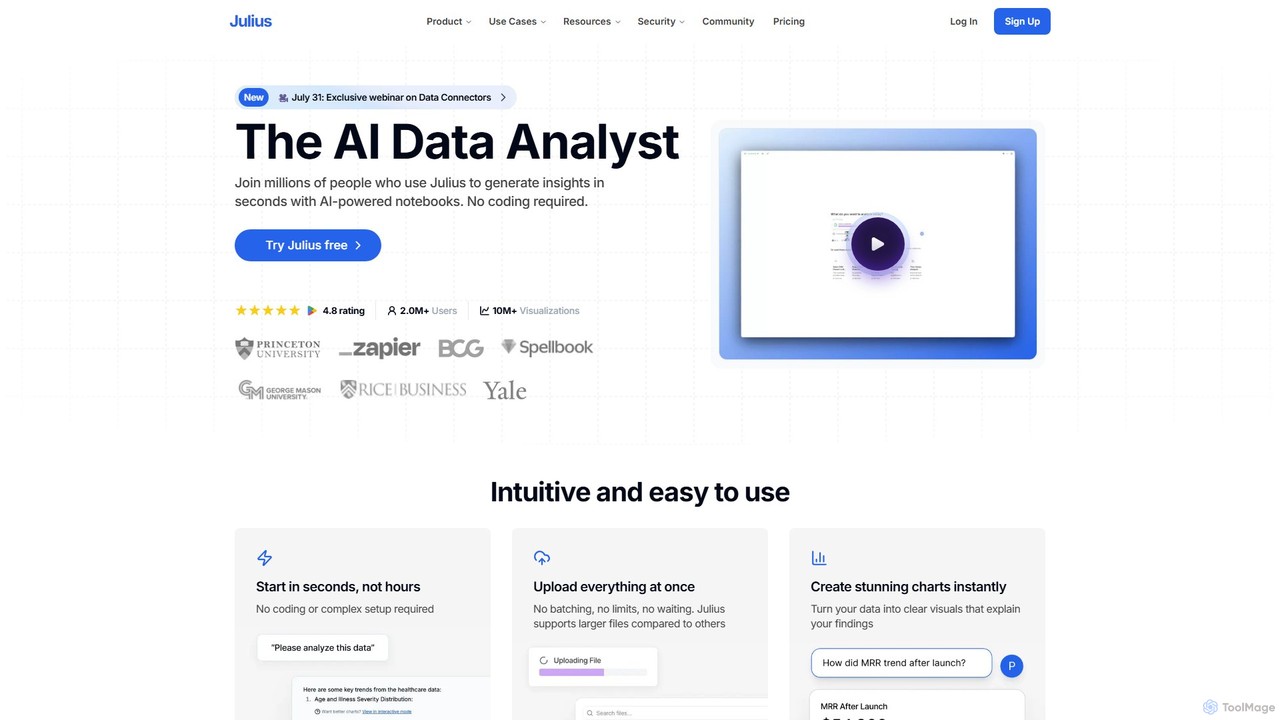
Julius AI is your AI Data Analyst, designed to interpret, analyze, and visualize complex data effortlessly. Connect your data from spreadsheets, databases, or PDFs, ask questions in natural language, and receive instant insights, charts, and reports. No coding is required, but it also supports Python, R, and SQL for advanced users, making data analysis accessible to everyone.
Developer Tools
ClickHouse
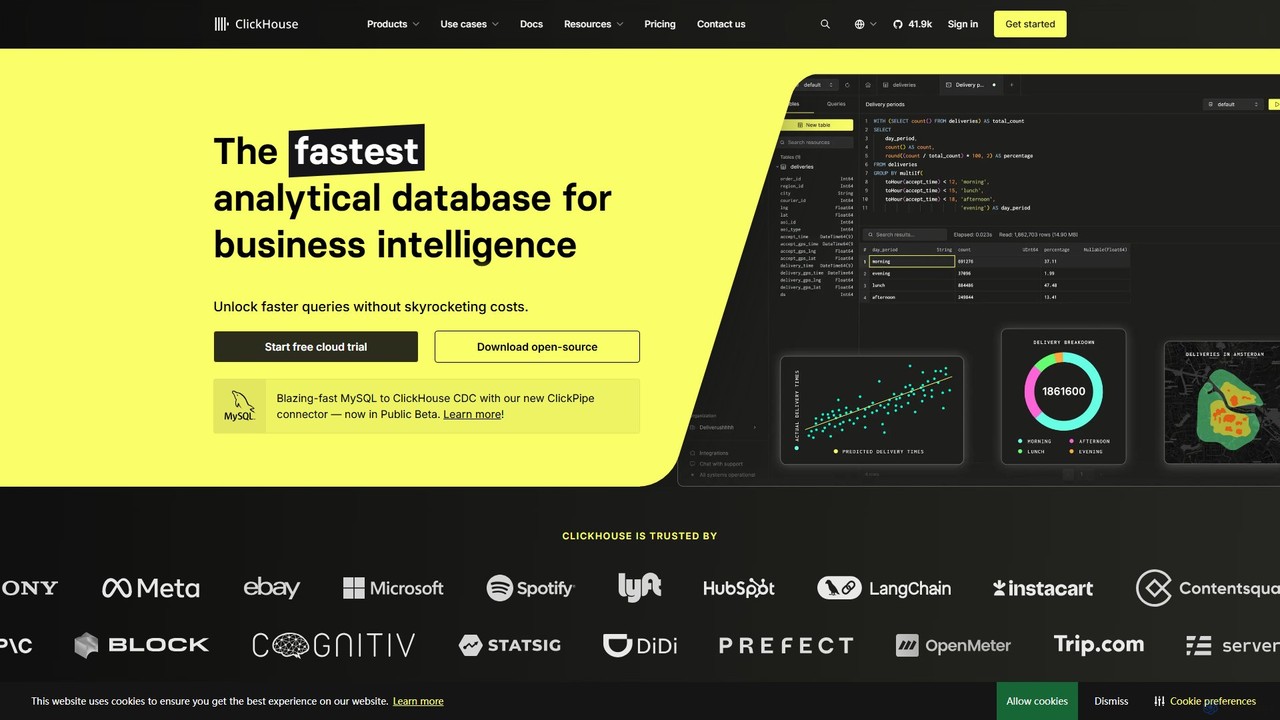
ClickHouse is a high-performance, open-source, column-oriented OLAP database management system. It's designed for real-time analytics on large-scale data, enabling blazing-fast queries for observability, business intelligence, ML/GenAI, and more, while remaining resource-efficient and cost-effective.
Databases
Rows
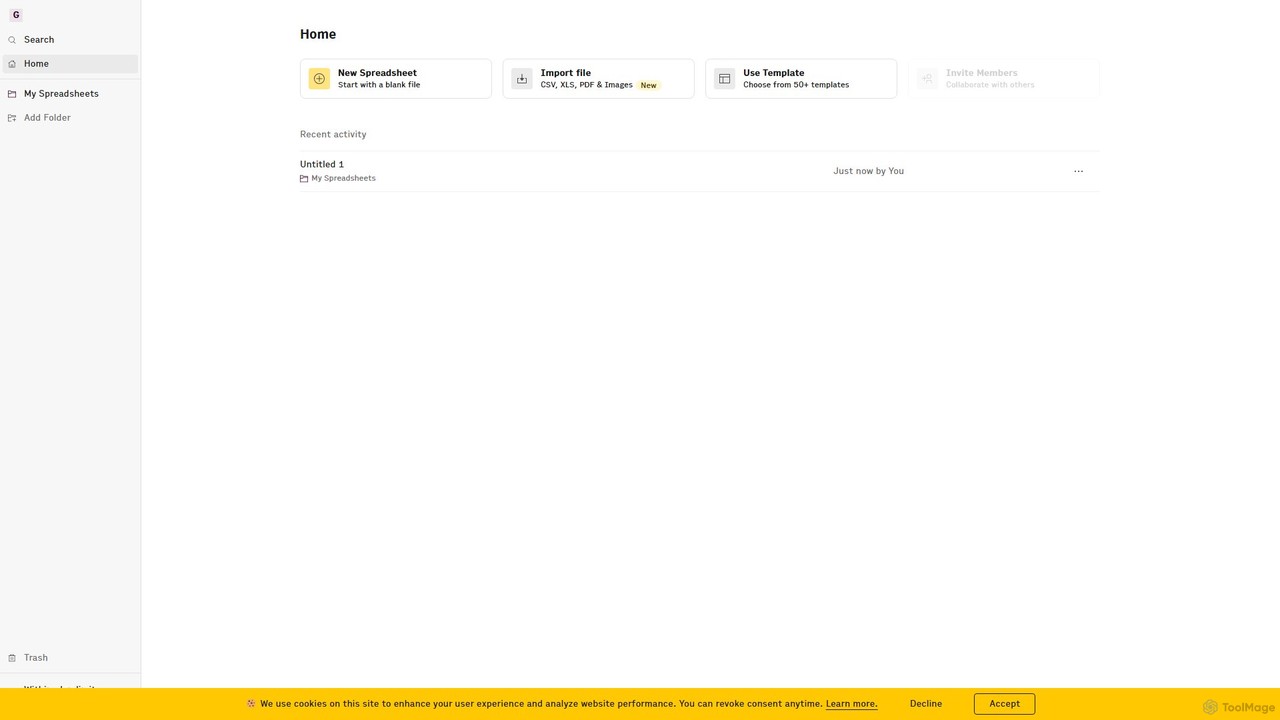
Rows is a next-generation spreadsheet that combines a familiar interface with powerful AI capabilities and seamless data integration. Connect to over 50 sources like Google Analytics, social media, and databases to automate data analysis, create live dashboards, and generate insights with an AI Analyst copilot.
Reporting
Coupler.io
Coupler.io is a no-code data analytics and automation platform that helps businesses connect disparate data sources from marketing, sales, and finance apps to spreadsheets, data warehouses, or BI tools. It automates data collection, transforms raw data into analysis-ready formats, and provides AI-powered insights and pre-built dashboard templates for faster, smarter decision-making.
Business Intelligence
ChartGen
ChartGen is an AI-powered chart generator that transforms raw data into stunning, professional visualizations in seconds. Users simply upload CSV or Excel files, describe their desired chart in plain English, and the AI instantly creates various chart types like bar, line, and pie charts. It's designed for quick, effortless data visualization without requiring design or coding skills.
Charts & Graphs
Flowpoint
Flowpoint is an AI-powered agentic process builder designed for website intelligence. It automates website analytics by connecting to data sources like Google Analytics, using AI agents to analyze data and generate in-depth reports in minutes. This no-code platform empowers marketers to optimize website performance, improve ROI, and gain actionable insights without requiring technical expertise.
Website Analytics
Lifesight
Lifesight is an AI-powered unified marketing measurement platform that helps businesses optimize ad spend and drive predictable growth. It uses advanced methodologies like Causal Marketing Mix Modeling (MMM), Incrementality Testing, and Causal Attribution to reveal the true impact of marketing activities. By moving beyond flawed traditional attribution, Lifesight provides actionable insights to maximize ROI and align marketing and finance teams.
Data Analysis
June
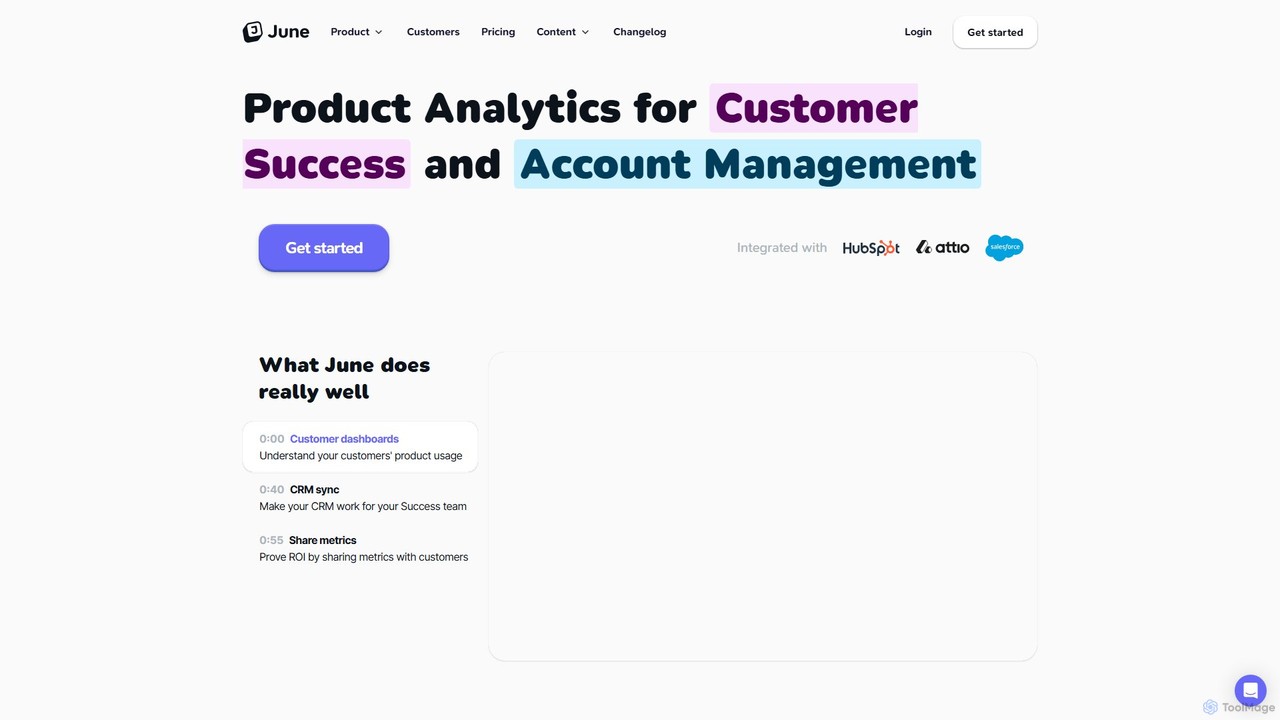
June is a product analytics platform designed for B2B SaaS companies. It helps customer success and account management teams understand product usage at the account level, proactively prevent churn, and identify expansion opportunities. By integrating with CRMs like HubSpot and Salesforce, June enriches customer data with actionable usage insights, enabling teams to build health scores and have more contextual conversations.
Product Analytics
Supaboard
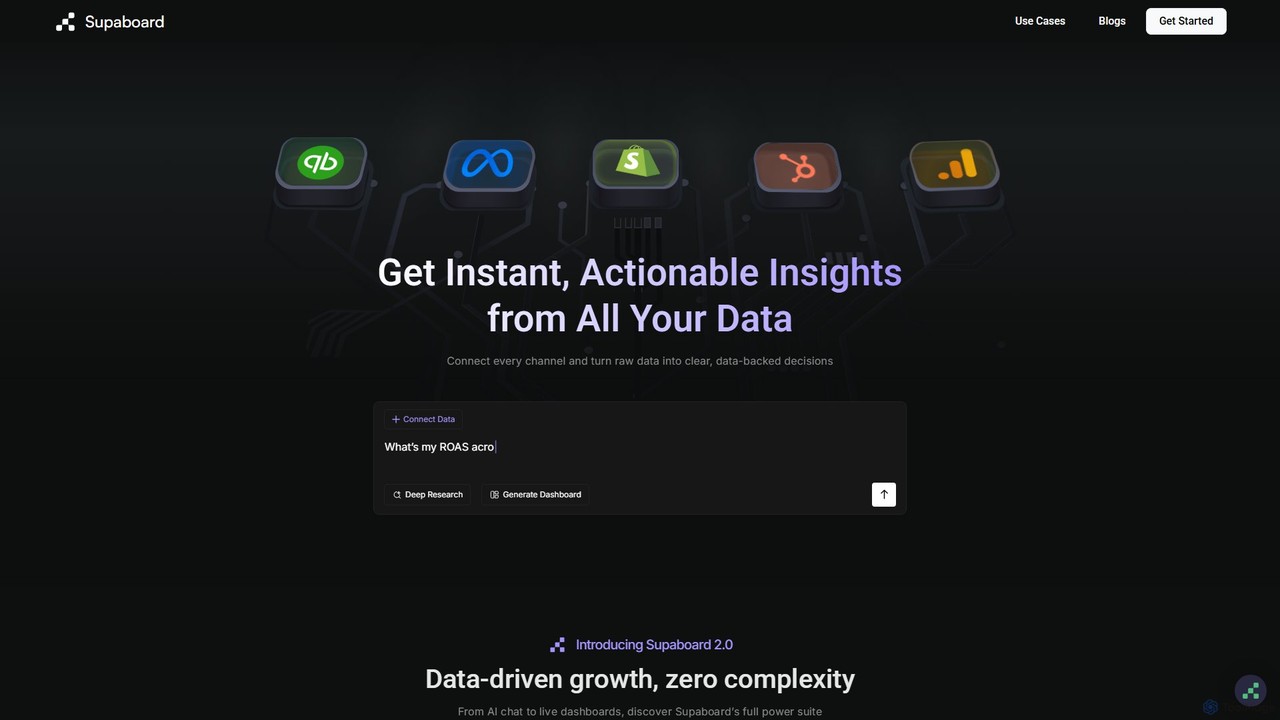
Supaboard is an AI-powered business intelligence platform that connects all your data sources into a unified hub. It transforms raw data into actionable insights and live dashboards, allowing teams to make data-backed decisions quickly without needing to write code or wrangle spreadsheets.
Business Intelligence